Page Summary
-
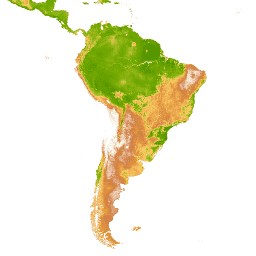
The MOD16A2 V105 product provides 8-day global terrestrial evapotranspiration data at 1km resolution from 2000-01-01 to 2014-12-27.
-
Evapotranspiration is the combined process of evaporation and plant transpiration and can be used to quantify the effects of climate, land use, and ecosystem changes.
-
The dataset includes bands for Evapotranspiration (ET), Latent Heat Flux (LE), Potential Evapotranspiration (PET), Potential Latent Heat Flux (PLE), and ET quality control (ET_QC).
-
Data is available through the Numerical Terradynamic Simulation Group at the University of Montana and has no restrictions on use, sale, or redistribution.
- Dataset Availability
- 2000-01-01T00:00:00Z–2014-12-27T00:00:00Z
- Dataset Producer
- Numerical Terradynamic Simulation Group, The University of Montana
- Cadence
- 8 Days
- Tags
Description
The MOD16A2 V105 product provides information about 8-day global terrestrial evapotranspiration at 1km pixel resolution. Evapotranspiration (ET) is the sum of evaporation and plant transpiration from the Earth's surface to the atmosphere. With long-term ET data, the effects of changes in climate, land use, and ecosystems disturbances can be quantified.
The MOD16A2 product is produced by the Numerical Terradynamic Simulation Group NTSG, University of Montana (UMT) in conjunction with NASA Earth Observing System. For more details about the algorithm used see the algorithm theoretical basis document.
- The period of coverage is 8 days with the exception of the last period at the end of the year which is either 5 or 6 days. ET/PET units are 0.1mm/5-day for December 27-31 of 2001, 2002, 2003, 2005, 2006, 2007, 2009, 2010, and 0.1mm/6-day for December 26-31 of 2000, 2004, 2008 (leap years).
** For some pixels in African rainforest, the MODIS albedo data from MCD43B2/MCD43B3 have no cloud-free data throughout an entire year. As a result, pixels for that year in all data bands are masked out.
Bands
Bands
Pixel size: 1000 meters (all bands)
| Name | Units | Min | Max | Scale | Pixel Size | Description | |||||||||||||||||||||||||||||||||||||||||||||||||||||||||||||||||||||||||||||||||||||||||||||
|---|---|---|---|---|---|---|---|---|---|---|---|---|---|---|---|---|---|---|---|---|---|---|---|---|---|---|---|---|---|---|---|---|---|---|---|---|---|---|---|---|---|---|---|---|---|---|---|---|---|---|---|---|---|---|---|---|---|---|---|---|---|---|---|---|---|---|---|---|---|---|---|---|---|---|---|---|---|---|---|---|---|---|---|---|---|---|---|---|---|---|---|---|---|---|---|---|---|---|---|
ET |
kg/m^2 | -5* | 453* | 0.1 | 1000 meters | Evapotranspiration, aggregated for period of coverage. |
|||||||||||||||||||||||||||||||||||||||||||||||||||||||||||||||||||||||||||||||||||||||||||||
LE |
J/m^2/day | -20* | 1671* | 10000 | 1000 meters | Latent heat flux, averaged daily over the period of coverage. |
|||||||||||||||||||||||||||||||||||||||||||||||||||||||||||||||||||||||||||||||||||||||||||||
PET |
kg/m^2 | -8* | 793* | 0.1 | 1000 meters | Potential evapotranspiration, aggregated for period of coverage. |
|||||||||||||||||||||||||||||||||||||||||||||||||||||||||||||||||||||||||||||||||||||||||||||
PLE |
J/m^2/day | -40* | 3174* | 10000 | 1000 meters | Potential Latent Heat Flux, averaged daily over the period ofcoverage. |
|||||||||||||||||||||||||||||||||||||||||||||||||||||||||||||||||||||||||||||||||||||||||||||
ET_QC |
1000 meters | ET quality control. |
|||||||||||||||||||||||||||||||||||||||||||||||||||||||||||||||||||||||||||||||||||||||||||||||||
Image Properties
Image Properties
| Name | Type | Description |
|---|---|---|
| days_of_coverage | DOUBLE | Number of days covered by each image since the period of coverage for the last asset of the year can be of varying length |
Terms of Use
Terms of Use
All NTSG data distributed through this site has no restrictions on subsequent use, sale, or redistribution.
Citations
Qiaozhen Mu, Maosheng Zhao, Steven W. Running and Numerical Terradynamic Simulation Group (2014): MODIS Global Terrestrial Evapotranspiration (ET) Product MOD16A2 Collection 5.
Explore with Earth Engine
Code Editor (JavaScript)
var dataset = ee.ImageCollection('MODIS/NTSG/MOD16A2/105')
                  .filter(ee.Filter.date('2014-04-01', '2014-06-01'));
var evapotranspiration = dataset.select('ET');
var evapotranspirationVis = {
  min: 0,
  max: 300,
  palette:
      ['a50000', 'ff4f1a', 'f1e342', 'c7ef1f', '05fff3', '1707ff', 'd90bff'],
};
Map.setCenter(6.746, 46.529, 2);
Map.addLayer(evapotranspiration, evapotranspirationVis, 'Evapotranspiration');