Page Summary
-
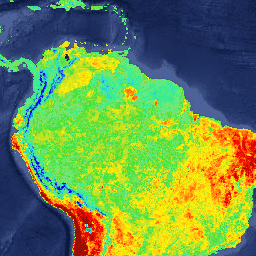
The MOD11A2 V6.1 product provides an average 8-day land surface temperature (LST) in a 1200 x 1200 kilometer grid.
-
Data is available from 2000-02-18 to 2025-10-08 with an 8-day cadence.
-
The dataset includes bands for day and night land surface temperature, quality indicators, view time and angle, emissivity, and clear sky conditions.
-
MODIS data and products acquired through the LP DAAC have no restrictions on subsequent use, sale, or redistribution.
- Dataset Availability
- 2000-02-18T00:00:00Z–2026-06-02T00:00:00Z
- Dataset Producer
- NASA LP DAAC at the USGS EROS Center
- Cadence
- 8 Days
- Tags
Description
The MOD11A2 V6.1 product provides an average 8-day land surface temperature (LST) in a 1200 x 1200 kilometer grid. Each pixel value in MOD11A2 is a simple average of all the corresponding MOD11A1 LST pixels collected within that 8 day period. The MOD11A2 does a simple averaging of all daily LST values, without any filtering for specific QA bits. Each of the MOD11A2 QA values are set based on what majority of input daily QA values are for any given pixel.
The 8 day compositing period was chosen because twice that period is the exact ground track repeat period of the Terra and Aqua platforms. In this product, along with both the day- and night-time surface temperature bands and their quality indicator (QC) layers, are also MODIS bands 31 and 32 and eight observation layers.
Documentation:
Bands
Bands
Pixel size: 1000 meters (all bands)
| Name | Units | Min | Max | Scale | Offset | Pixel Size | Description | ||||||||||||||||||||||||||||||||||||||||||||||||||||||||||||||||||||||||||||||||||||||||||||
|---|---|---|---|---|---|---|---|---|---|---|---|---|---|---|---|---|---|---|---|---|---|---|---|---|---|---|---|---|---|---|---|---|---|---|---|---|---|---|---|---|---|---|---|---|---|---|---|---|---|---|---|---|---|---|---|---|---|---|---|---|---|---|---|---|---|---|---|---|---|---|---|---|---|---|---|---|---|---|---|---|---|---|---|---|---|---|---|---|---|---|---|---|---|---|---|---|---|---|---|
LST_Day_1km |
K | 7500 | 65535 | 0.02 | 1000 meters | Day land surface temperature |
|||||||||||||||||||||||||||||||||||||||||||||||||||||||||||||||||||||||||||||||||||||||||||||
QC_Day |
1000 meters | Daytime LST quality indicators |
|||||||||||||||||||||||||||||||||||||||||||||||||||||||||||||||||||||||||||||||||||||||||||||||||
Day_view_time |
h | 0 | 240 | 0.1 | 1000 meters | Local time of day observation |
|||||||||||||||||||||||||||||||||||||||||||||||||||||||||||||||||||||||||||||||||||||||||||||
Day_view_angl |
deg | 0 | 130 | -65 | 1000 meters | View zenith angle of day observation |
|||||||||||||||||||||||||||||||||||||||||||||||||||||||||||||||||||||||||||||||||||||||||||||
LST_Night_1km |
K | 7500 | 65635 | 0.02 | 1000 meters | Night land surface temperature |
|||||||||||||||||||||||||||||||||||||||||||||||||||||||||||||||||||||||||||||||||||||||||||||
QC_Night |
1000 meters | Nighttime LST quality indicators |
|||||||||||||||||||||||||||||||||||||||||||||||||||||||||||||||||||||||||||||||||||||||||||||||||
Night_view_time |
h | 0 | 240 | 0.1 | 1000 meters | Local time of night observation |
|||||||||||||||||||||||||||||||||||||||||||||||||||||||||||||||||||||||||||||||||||||||||||||
Night_view_angl |
deg | 0 | 130 | -65 | 1000 meters | View zenith angle of night observation |
|||||||||||||||||||||||||||||||||||||||||||||||||||||||||||||||||||||||||||||||||||||||||||||
Emis_31 |
1 | 255 | 0.002 | 0.49 | 1000 meters | Band 31 emissivity |
|||||||||||||||||||||||||||||||||||||||||||||||||||||||||||||||||||||||||||||||||||||||||||||
Emis_32 |
1 | 255 | 0.002 | 0.49 | 1000 meters | Band 32 emissivity |
|||||||||||||||||||||||||||||||||||||||||||||||||||||||||||||||||||||||||||||||||||||||||||||
Clear_sky_days |
1000 meters | Days in clear-sky conditions |
|||||||||||||||||||||||||||||||||||||||||||||||||||||||||||||||||||||||||||||||||||||||||||||||||
Clear_sky_nights |
1000 meters | Nights in clear-sky conditions |
|||||||||||||||||||||||||||||||||||||||||||||||||||||||||||||||||||||||||||||||||||||||||||||||||
Terms of Use
Terms of Use
MODIS data and products acquired through the LP DAAC have no restrictions on subsequent use, sale, or redistribution.
Citations
Please visit LP DAAC 'Citing Our Data' page for information on citing LP DAAC datasets.
DOIs
Explore with Earth Engine
Code Editor (JavaScript)
var dataset = ee.ImageCollection('MODIS/061/MOD11A2')
                  .filter(ee.Filter.date('2018-01-01', '2018-05-01'));
var landSurfaceTemperature = dataset.select('LST_Day_1km');
var landSurfaceTemperatureVis = {
  min: 14000.0,
  max: 16000.0,
  palette: [
    '040274', '040281', '0502a3', '0502b8', '0502ce', '0502e6',
    '0602ff', '235cb1', '307ef3', '269db1', '30c8e2', '32d3ef',
    '3be285', '3ff38f', '86e26f', '3ae237', 'b5e22e', 'd6e21f',
    'fff705', 'ffd611', 'ffb613', 'ff8b13', 'ff6e08', 'ff500d',
    'ff0000', 'de0101', 'c21301', 'a71001', '911003'
  ],
};
Map.setCenter(6.746, 46.529, 2);
Map.addLayer(
    landSurfaceTemperature, landSurfaceTemperatureVis,
    'Land Surface Temperature');
import ee
import geemap.core as geemap
Colab (Python)
dataset = ee.ImageCollection('MODIS/061/MOD11A2').filter(
    ee.Filter.date('2018-01-01', '2018-05-01')
)

land_surface_temperature = dataset.select('LST_Day_1km')

land_surface_temperature_vis = {
    'min': 14000.0,
    'max': 16000.0,
    'palette': [
        '040274', '040281', '0502a3', '0502b8', '0502ce', '0502e6',
        '0602ff', '235cb1', '307ef3', '269db1', '30c8e2', '32d3ef',
        '3be285', '3ff38f', '86e26f', '3ae237', 'b5e22e', 'd6e21f',
        'fff705', 'ffd611', 'ffb613', 'ff8b13', 'ff6e08', 'ff500d',
        'ff0000', 'de0101', 'c21301', 'a71001', '911003'
    ],
}

m = geemap.Map()
m.set_center(6.746, 46.529, 2)
m.add_layer(
    land_surface_temperature,
    land_surface_temperature_vis,
    'Land Surface Temperature',
)
m