- Veri Kümesi Kullanılabilirliği
- 2013-03-18T15:58:14Z–2026-07-10T09:27:52.898000Z
- Veri Kümesi Üreticisi
- USGS
- Yeniden Ziyaret Aralığı
- 16 gün
- Etiketler
Açıklama
Bu veri kümesi, Landsat 8 OLI/TIRS sensörleri tarafından üretilen verilerden elde edilen atmosferik olarak düzeltilmiş yüzey yansıtma ve yeryüzü sıcaklığını içerir. Bu görüntüler, ortorektifiye edilmiş yüzey yansıtma için işlenmiş 5 görünür ve yakın kızılötesi (VNIR) bant ile ortorektifiye edilmiş yüzey sıcaklığı için işlenmiş 2 kısa dalga kızılötesi (SWIR) bant ve 1 termal kızılötesi (TIR) bant içerir. Ayrıca, ST ürünlerinin hesaplanmasında kullanılan ara bantların yanı sıra kalite kontrol bantlarını da içerirler.
Landsat 8 SR ürünleri, Land Surface Reflectance Code (LaSRC) ile oluşturulur. Tüm Collection 2 ST ürünleri, Rochester Institute of Technology (RIT) ve National Aeronautics and Space Administration (NASA) Jet Propulsion Laboratory (JPL) tarafından ortaklaşa oluşturulan tek kanallı bir algoritmayla üretilir.
Toplanan veri şeritleri, standartlaştırılmış bir referans ızgarası kullanılarak yaklaşık 170 km x 183 km'lik alanı kapsayan, çakışan "sahneler" halinde paketlenir.
Bazı öğelerde yalnızca SR verileri bulunur. Bu durumda ST bantları mevcuttur ancak boştur. Hem ST hem de SR bantlarına sahip öğeler için "PROCESSING_LEVEL" değeri "L2SP" olarak ayarlanır. Yalnızca SR bantlarına sahip öğeler için "PROCESSING_LEVEL" değeri "L2SR" olarak ayarlanır.
Ek belgeler ve kullanım örnekleri.
Landsat Collection 2 dosyaları, talep eden öder esasına göre Google Cloud Storage paketinde herkese açık olarak sunulur. Dosyalar, analiz kolaylığı için düzenli olarak güncellenen bir BigQuery tablosunda dizine eklenir: earth-engine-public-data.geo_index.landsat_c2_index.
Veri sağlayıcı notları:
ASTER NDVI, ASTER GED ürününü hedef Landsat sahnesine göre zamansal olarak ayarlamak için gerektiğinden, veri ürünleri yüzey sıcaklığına başarılı bir şekilde işlenmek üzere hem optik hem de termal veriler içermelidir. Bu nedenle, gece yapılan edinmeler yüzey sıcaklığı olarak işlenemez.
Bulutlara ve muhtemelen bulut gölgelerine göre yüzey sıcaklığı alımlarında bilinen bir hata vardır. Bu sorunların nitelendirilmesi Cook ve diğerleri tarafından belgelenmiştir. (2014).
ASTER GED, başarılı ST ürünü oluşturma için gerekli olan ortalama emisyon verilerinin eksik olduğu alanlar içeriyor. Eksik ASTER GED bilgileri varsa bu alanlarda eksik ST verileri olur.
ASTER GED veri kümesi, 2000-2008 yılları arasında elde edilen ASTER sahnelerinin tüm açık hava piksellerinden oluşturulur. Bu veri kümesi küresel bir uzamsal kapsama sahip olsa da ASTER ölçümlerinde sürekli bulut kirlenmesi nedeniyle ortalama emisyon bilgisi eksik olan alanlar vardır.
USGS, ASTER GED'de fiziksel olmayan değerleri (emisyon < 0,6) daha da tarayarak algılanmayan bulutlar nedeniyle emisyonun düşük tahmin edilmesini önler. ASTER GED girişi olmayan veya fiziksel olmayan emisyon değeri olan herhangi bir piksel için elde edilen Landsat ST ürünlerinde eksik pikseller bulunur. ASTER GED ortalama iklimbilim verilerinin statik yapısı göz önüne alındığında, eksik Landsat ST pikselleri zaman içinde (1982-günümüz) tutarlı olacaktır. Daha fazla bilgi için landsat-collection-2-surface-temperature-data-gaps-due-missing başlıklı makaleyi inceleyin.
Bantlar
Bantlar
Piksel boyutu: 30 metre (tüm bantlar)
| Ad | Birimler | Min. | Maks. | Ölçek | Göreli konum | Piksel Boyutu | Dalga Boyu | Açıklama | |||||||||||||||||||||||||||||||||||||||||||||||||||||||||||||||||||||||||||||||||||||||||||
|---|---|---|---|---|---|---|---|---|---|---|---|---|---|---|---|---|---|---|---|---|---|---|---|---|---|---|---|---|---|---|---|---|---|---|---|---|---|---|---|---|---|---|---|---|---|---|---|---|---|---|---|---|---|---|---|---|---|---|---|---|---|---|---|---|---|---|---|---|---|---|---|---|---|---|---|---|---|---|---|---|---|---|---|---|---|---|---|---|---|---|---|---|---|---|---|---|---|---|---|
SR_B1 |
1 | 65455 | 2,75e-05 | -0,2 | 30 metre | 0,435-0,451 μm | Bant 1 (ultra mavi, kıyı aerosolü) yüzey yansıması |
||||||||||||||||||||||||||||||||||||||||||||||||||||||||||||||||||||||||||||||||||||||||||||
SR_B2 |
1 | 65455 | 2,75e-05 | -0,2 | 30 metre | 0,452-0,512 μm | Bant 2 (mavi) yüzey yansıması |
||||||||||||||||||||||||||||||||||||||||||||||||||||||||||||||||||||||||||||||||||||||||||||
SR_B3 |
1 | 65455 | 2,75e-05 | -0,2 | 30 metre | 0,533-0,590 μm | Bant 3 (yeşil) yüzey yansıması |
||||||||||||||||||||||||||||||||||||||||||||||||||||||||||||||||||||||||||||||||||||||||||||
SR_B4 |
1 | 65455 | 2,75e-05 | -0,2 | 30 metre | 0,636-0,673 μm | Bant 4 (kırmızı) yüzey yansıması |
||||||||||||||||||||||||||||||||||||||||||||||||||||||||||||||||||||||||||||||||||||||||||||
SR_B5 |
1 | 65455 | 2,75e-05 | -0,2 | 30 metre | 0,851-0,879 μm | Bant 5 (yakın kızılötesi) yüzey yansıması |
||||||||||||||||||||||||||||||||||||||||||||||||||||||||||||||||||||||||||||||||||||||||||||
SR_B6 |
1 | 65455 | 2,75e-05 | -0,2 | 30 metre | 1,566-1,651 μm | Bant 6 (kısa dalga kızılötesi 1) yüzey yansıması |
||||||||||||||||||||||||||||||||||||||||||||||||||||||||||||||||||||||||||||||||||||||||||||
SR_B7 |
1 | 65455 | 2,75e-05 | -0,2 | 30 metre | 2,107-2,294 μm | Bant 7 (kısa dalga kızılötesi 2) yüzey yansıması |
||||||||||||||||||||||||||||||||||||||||||||||||||||||||||||||||||||||||||||||||||||||||||||
SR_QA_AEROSOL |
30 metre | Yok | Aerosol özellikleri |
||||||||||||||||||||||||||||||||||||||||||||||||||||||||||||||||||||||||||||||||||||||||||||||||
ST_B10 |
K | 0 | 65.535 | 0,00341802 | 149 | 30 metre | 10,60-11,19 μm | Bant 10 yüzey sıcaklığı. "PROCESSING_LEVEL" değeri "L2SR" olarak ayarlanırsa bu bant tamamen maskelenir. |
|||||||||||||||||||||||||||||||||||||||||||||||||||||||||||||||||||||||||||||||||||||||||||
ST_ATRAN |
0 | 10.000 | 0,0001 | 30 metre | Yok | Atmosferik Geçirgenlik. "PROCESSING_LEVEL" değeri "L2SR" olarak ayarlanırsa bu bant tamamen maskelenir. |
|||||||||||||||||||||||||||||||||||||||||||||||||||||||||||||||||||||||||||||||||||||||||||||
ST_CDIST |
km | 0 | 24000 | 0,01 | 30 metre | Yok | Pikselin buluta olan uzaklığı. "PROCESSING_LEVEL" değeri "L2SR" olarak ayarlanırsa bu bant tamamen maskelenir. |
||||||||||||||||||||||||||||||||||||||||||||||||||||||||||||||||||||||||||||||||||||||||||||
ST_DRAD |
W/(m^2*sr*um)/ DN | 0 | 28000 | 0,001 | 30 metre | Yok | Aşağı Yönlü Işınım. "PROCESSING_LEVEL" değeri "L2SR" olarak ayarlanırsa bu bant tamamen maskelenir. |
||||||||||||||||||||||||||||||||||||||||||||||||||||||||||||||||||||||||||||||||||||||||||||
ST_EMIS |
0 | 10.000 | 0,0001 | 30 metre | Yok | ASTER GED'den tahmin edilen 10. banttaki emisyon. "PROCESSING_LEVEL" değeri "L2SR" olarak ayarlanırsa bu bant tamamen maskelenir. |
|||||||||||||||||||||||||||||||||||||||||||||||||||||||||||||||||||||||||||||||||||||||||||||
ST_EMSD |
0 | 10.000 | 0,0001 | 30 metre | Yok | Yayınım standart sapması. "PROCESSING_LEVEL" değeri "L2SR" olarak ayarlanırsa bu bant tamamen maskelenir. |
|||||||||||||||||||||||||||||||||||||||||||||||||||||||||||||||||||||||||||||||||||||||||||||
ST_QA |
K | 0 | 32767 | 0,01 | 30 metre | Yok | Yüzey sıcaklığı bandının belirsizliği. "PROCESSING_LEVEL" değeri "L2SR" olarak ayarlanırsa bu bant tamamen maskelenir. |
||||||||||||||||||||||||||||||||||||||||||||||||||||||||||||||||||||||||||||||||||||||||||||
ST_TRAD |
W/(m^2*sr*um)/ DN | 0 | 22.000 | 0,001 | 30 metre | Yok | Termal bant, ışıma değerine dönüştürülür. "PROCESSING_LEVEL" değeri "L2SR" olarak ayarlanırsa bu bant tamamen maskelenir. |
||||||||||||||||||||||||||||||||||||||||||||||||||||||||||||||||||||||||||||||||||||||||||||
ST_URAD |
W/(m^2*sr*um)/ DN | 0 | 28000 | 0,001 | 30 metre | Yok | Yukarı Yansıyan Işınım. "PROCESSING_LEVEL" değeri "L2SR" olarak ayarlanırsa bu bant tamamen maskelenir. |
||||||||||||||||||||||||||||||||||||||||||||||||||||||||||||||||||||||||||||||||||||||||||||
QA_PIXEL |
30 metre | Yok | CFMASK algoritmasından oluşturulan piksel kalitesi özellikleri. |
||||||||||||||||||||||||||||||||||||||||||||||||||||||||||||||||||||||||||||||||||||||||||||||||
QA_RADSAT |
30 metre | Yok | Radyometrik doygunluk kalite kontrolü |
||||||||||||||||||||||||||||||||||||||||||||||||||||||||||||||||||||||||||||||||||||||||||||||||
Resim Özellikleri
Görüntü Özellikleri
| Ad | Tür | Açıklama |
|---|---|---|
| ALGORITHM_SOURCE_SURFACE_REFLECTANCE | Dize | Yüzey yansıtma algoritmasının adı ve sürümü. |
| ALGORITHM_SOURCE_SURFACE_TEMPERATURE | Dize | Yüzey sıcaklığı algoritmasının adı ve sürümü. |
| CLOUD_COVER | ÇİFT | Bulut örtüsü yüzdesi (0-100), -1 = hesaplanmadı. |
| CLOUD_COVER_LAND | ÇİFT | Kara üzerindeki bulut örtüsü yüzdesi (0-100), -1 = hesaplanmadı. |
| COLLECTION_CATEGORY | Dize | Sahne koleksiyonu kategorisi, "T1" veya "T2". |
| DATA_SOURCE_AIR_TEMPERATURE | Dize | Hava sıcaklığı veri kaynağı. |
| DATA_SOURCE_ELEVATION | Dize | Yükseklik veri kaynağı. |
| DATA_SOURCE_OZONE | Dize | Ozon veri kaynağı. |
| DATA_SOURCE_PRESSURE | Dize | Basınç veri kaynağı. |
| DATA_SOURCE_REANALYSIS | Dize | Yeniden analiz edilen veri kaynağı. |
| DATA_SOURCE_TIRS_STRAY_LIGHT_CORRECTION | Dize | TIRS kaçak ışık düzeltme veri kaynağı. |
| DATA_SOURCE_WATER_VAPOR | Dize | Su buharı veri kaynağı. |
| DATE_PRODUCT_GENERATED | ÇİFT | Ürünün oluşturulduğu tarihin zaman damgası. |
| EARTH_SUN_DISTANCE | ÇİFT | Dünya-Güneş mesafesi (AU). |
| EPHEMERIS_TYPE | Dize | Kullanılan yörünge efemeris türü hakkında kullanıcıyı bilgilendiren tanımlayıcı: "KESİN" veya "TAHMİNİ". Alan mevcut değilse kullanıcı "PREDICTIVE" değerini varsaymalıdır. |
| GEOMETRIC_RMSE_MODEL | ÇİFT | Hem yörünge boyunca hem de yörüngeye dik yönde geometrik artıkların (metre) birleştirilmiş RMSE'si (kök ortalama kare hatası). Bu parametre yalnızca L1_PROCESSING_LEVEL L1TP ise bulunur. |
| GEOMETRIC_RMSE_MODEL_X | ÇİFT | Yörünge yönünde geometrik doğruluk düzeltmesinde kullanılan YKP'lerde (Yer Kontrol Noktaları) ölçülen geometrik artıkların RMSE'si (Kök Ortalama Kare Hatası) (metre). Bu parametre yalnızca L1_PROCESSING_LEVEL L1TP ise bulunur. |
| GEOMETRIC_RMSE_MODEL_Y | ÇİFT | Yörünge yönünde geometrik doğruluk düzeltmesinde kullanılan YKN'lerde (Yer Kontrol Noktaları) ölçülen geometrik artıkların RMSE'si (Kök Ortalama Kare Hatası) (metre). Bu parametre yalnızca L1_PROCESSING_LEVEL L1TP ise bulunur. |
| GEOMETRIC_RMSE_VERIFY | ÇİFT | GLS2000 kullanılarak arazi düzeltmeli üründe bağımsız olarak ölçülen geometrik artıkların RMSE'si (metre). Bu parametre yalnızca L1_PROCESSING_LEVEL L1TP ise bulunur. |
| GROUND_CONTROL_POINTS_MODEL | ÇİFT | Hassasiyet düzeltme sürecinde kullanılan YNK sayısı. Bu parametre yalnızca L1_PROCESSING_LEVEL L1TP ise bulunur. |
| GROUND_CONTROL_POINTS_VERIFY | ÇİFT | Arazi düzeltmeli ürünün doğrulanmasında kullanılan YKP (Yer Kontrol Noktaları) sayısı. |
| GROUND_CONTROL_POINTS_VERSION | ÇİFT | Doğruluk düzeltme sürecinde kullanılan GCP veri kümesi sürümü. Bu parametre yalnızca L1_PROCESSING_LEVEL L1TP ise bulunur. |
| IMAGE_QUALITY_OLI | MÜD | OLI bantlarının görüntü kalitesi. 1 = en kötü, 9 = en iyi, 0 = kalite hesaplanmadı. Landsat 8 için bu parametre, OLI sensöründen alınan 12 bitlik veriler kullanılarak toplanan sahneler için aşağı doğru ayarlanır (TRUNCATION_OLI = "LOWER"). |
| IMAGE_QUALITY_TIRS | MÜD | TIRS bantlarının görüntü kalitesi. 1 = en kötü, 9 = en iyi, 0 = kalite hesaplanmadı. Ayrıca, TIRS_SSM_POSITION_STATUS değeri için "SWITCHED" ile işlenen sahnelerde aşağı doğru ayarlanır. |
| L1_DATE_PRODUCT_GENERATED | Dize | İlgili L1 ürünü için ürün oluşturma tarihi. |
| L1_LANDSAT_PRODUCT_ID | Dize | İlgili L1 ürünü için Landsat Ürün Tanımlayıcısı. |
| L1_PROCESSING_LEVEL | Dize | İlgili D1 ürünü için işleme düzeyi. |
| L1_PROCESSING_SOFTWARE_VERSION | Dize | İlgili L1 ürünü için işleme yazılımı sürümü. |
| LANDSAT_PRODUCT_ID | Dize | Landsat Ürün Tanımlayıcısı |
| LANDSAT_SCENE_ID | Dize | Kısa Landsat Sahne Tanımlayıcısı |
| PROCESSING_LEVEL | Dize | Hem SR hem de LST bantları mevcutsa "L2SP", yalnızca SR bantları mevcutsa "L2SR". |
| PROCESSING_SOFTWARE_VERSION | Dize | Ürünü oluşturan işleme yazılımının sürümü. |
| ROLL_ANGLE | ÇİFT | Sahne merkezindeki uzay aracı yuvarlanma açısının miktarı. Yuvarlanma değeri, x ekseni anlık yer izi hız vektörüyle hizalanmış olan Yaw Steering Frame (YSF) referansında verilir. Bu x ekseni etrafındaki dönüşler sağ el kuralına göre yapılır: Pozitif bir dönüş, cihazların yer izinin soluna doğru yönlenmesine neden olurken negatif bir dönüş, cihazın sağa doğru yönlenmesine neden olur. |
| SCENE_CENTER_TIME | Dize | ISO 8601 dizesinde belirtilen gözlem zamanı. |
| SENSOR_ID | Dize | Sensörün adı. |
| SPACECRAFT_ID | Dize | Uzay aracının adı. |
| SUN_AZIMUTH | ÇİFT | Resim merkezinin çekim zamanında, resim merkezinin konumundaki güneş azimut açısı (derece). Pozitif değerler, kuzeyden doğuya veya saat yönünde olan açıları gösterir. Negatif değerler, kuzeyden batıya veya saat yönünün tersine doğru olan açıları gösterir. |
| SUN_ELEVATION | ÇİFT | Resim merkezinin çekildiği sırada resim merkezinin konumundaki güneşin yükseklik açısı (derece). Pozitif değer, gündüz çekilen bir sahneyi gösterir. Negatif değer, gece sahnesini gösterir. Not: Yansıtma hesaplaması için güneş zenit açısı gerekir. Bu açı, 90 - güneşin yükselme açısıdır. |
| TARGET_WRS_PATH | MÜD | Görüntünün görüş hattı (LOS) sahne merkezine en yakın WRS-2 yolu. |
| TARGET_WRS_ROW | MÜD | Görüntünün LOS sahne merkezine en yakın WRS-2 satırı. 880-889 satırları Kuzey Kutbu, 990-999 satırları ise WRS-2'nin tanımlanmadığı Güney Kutbu için ayrılmıştır. |
| TEMPERATURE_MAXIMUM_BAND_ST_B10 | ÇİFT | Bant 10 için ulaşılabilen maksimum sıcaklık değeri. |
| TEMPERATURE_MINIMUM_BAND_ST_B10 | ÇİFT | Bant 10 için ulaşılabilir minimum sıcaklık değeri. |
| TIRS_SSM_MODEL | Dize | Landsat 8 TIRS Sahne Seçme Aynası (SSM) konumunun nasıl belirlendiğini gösterir.
|
| TIRS_SSM_POSITION_STATUS | Dize |
|
| TRUNCATION_OLI | Dize |
Normal kesme modu "UPPER"dır. |
| WRS_PATH | MÜD | WRS yolu sahne sayısı. |
| WRS_ROW | MÜD | Sahnenin WRS satır numarası. |
Kullanım Şartları
Kullanım Şartları
Landsat veri kümeleri, federal düzeyde oluşturulan verilerdir. Bu nedenle kamu alanında yer alır ve telif hakkı kısıtlaması olmadan kullanılabilir, aktarılabilir veya çoğaltılabilir.
USGS'nin veri kaynağı olarak belirtilmesi veya kaynak gösterilmesi için aşağıdaki örnekte gösterildiği gibi bir metin alıntısı satırı eklenmelidir.
ABD Jeoloji Araştırması'nın izniyle (Ürün, Resim, Fotoğraf veya Veri Kümesi Adı)
Örnek: Landsat-7 görüntüsü, ABD Jeoloji Araştırması'nın izniyle kullanılmıştır.
USGS ürünlerinin uygun şekilde alıntılanması ve onaylanması hakkında daha fazla bilgi için USGS Görsel Kimlik Sistemi Rehberi'ne bakın.
Earth Engine ile Keşif
Kod Düzenleyici (JavaScript)
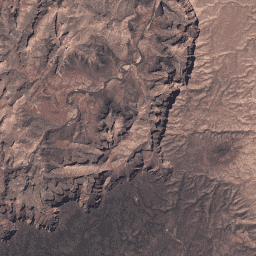
var dataset = ee.ImageCollection('LANDSAT/LC08/C02/T1_L2')
    .filterDate('2021-05-01', '2021-06-01');

// Applies scaling factors.
function applyScaleFactors(image) {
  var opticalBands = image.select('SR_B.').multiply(0.0000275).add(-0.2);
  var thermalBands = image.select('ST_B.*').multiply(0.00341802).add(149.0);
  return image.addBands(opticalBands, null, true)
              .addBands(thermalBands, null, true);
}

dataset = dataset.map(applyScaleFactors);

var visualization = {
  bands: ['SR_B4', 'SR_B3', 'SR_B2'],
  min: 0.0,
  max: 0.3,
};

Map.setCenter(-114.2579, 38.9275, 8);

Map.addLayer(dataset, visualization, 'True Color (432)');
import ee
import geemap.core as geemap
Colab (Python)
dataset = ee.ImageCollection('LANDSAT/LC08/C02/T1_L2').filterDate(
    '2021-05-01', '2021-06-01'
)


# Applies scaling factors.
def apply_scale_factors(image):
  optical_bands = image.select('SR_B.').multiply(0.0000275).add(-0.2)
  thermal_bands = image.select('ST_B.*').multiply(0.00341802).add(149.0)
  return image.addBands(optical_bands, None, True).addBands(
      thermal_bands, None, True
  )


dataset = dataset.map(apply_scale_factors)

visualization = {
    'bands': ['SR_B4', 'SR_B3', 'SR_B2'],
    'min': 0.0,
    'max': 0.3,
}

m = geemap.Map()
m.set_center(-114.2579, 38.9275, 8)
m.add_layer(dataset, visualization, 'True Color (432)')
m