- Dataset Availability
- 2025-01-01T00:00:00Z–2026-01-01T00:00:00Z
- Dataset Producer
- IBGE
- Tags
Description
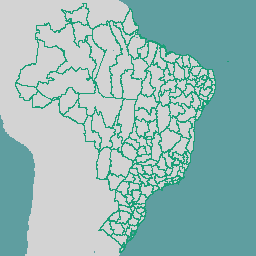
The Instituto Brasileiro de Geografia e Estatística (IBGE) provides official cartographic representations of the Brazilian territorial structure. This dataset contains the boundaries of the 133 Intermediate Geographic Regions (Regiões Geográficas Intermediárias) of Brazil for the reference year 2025 (Malha Territorial 2025).
Intermediate Geographic Regions group Immediate Geographic Regions to articulate the territorial mesh around regional urban centers and macro-economic flows.
For more information on the methodology and technical specifications, visit the IBGE Municipal Mesh Documentation.
Table Schema
Table Schema
| Name | Type | Description |
|---|---|---|
| CD_RGINT | STRING | 4-digit Intermediate Geographic Region Code |
| NM_RGINT | STRING | Intermediate Geographic Region Name |
| CD_UF | STRING | 2-digit State Code |
| NM_UF | STRING | State Name |
| SIGLA_UF | STRING | 2-letter State Abbreviation |
| CD_REGIAO | STRING | 1-digit Macro Region Code (1=Norte, 2=Nordeste, 3=Sudeste, 4=Sul, 5=Centro-Oeste) |
| NM_REGIAO | STRING | Macro Region Name |
| SIGLA_RG | STRING | Macro Region Abbreviation (N, NE, SE, S, CO) |
| AREA_KM2 | DOUBLE | Area in square kilometers |
Terms of Use
Terms of Use
This dataset is made available by the Instituto Brasileiro de Geografia e Estatística (IBGE) as open public data in accordance with Brazilian Federal Law No. 12.527/2011 (Access to Information Law). Users are free to use, modify, and distribute the data for personal, educational, research, and commercial applications, with appropriate attribution to IBGE.
Explore with Earth Engine
Code Editor (JavaScript)
var dataset = ee.FeatureCollection('IBGE/INTERMEDIARIAS/V2025');

Map.setCenter(-51.9253, -14.235, 4);

var styleParams = {
  fillColor: '1b9e7722',
  color: '1b9e77',
  width: 1.0,
};

dataset = dataset.style(styleParams);

Map.addLayer(dataset, {}, 'IBGE Brazil Intermediate Regions 2025');
Visualize as a FeatureView
A FeatureView is a view-only, accelerated representation of a
FeatureCollection. For more details, visit the
FeatureView documentation.
Code Editor (JavaScript)
var fvLayer = ui.Map.FeatureViewLayer('IBGE/INTERMEDIARIAS/V2025_FeatureView');

var visParams = {
  color: '1b9e77',
  fillColor: 'b5ffb4',
  opacity: 0.8,
  width: 1.0,
};

fvLayer.setVisParams(visParams);
fvLayer.setName('IBGE Brazil Intermediate Regions 2025');

Map.setCenter(-51.9253, -14.235, 4);
Map.add(fvLayer);