
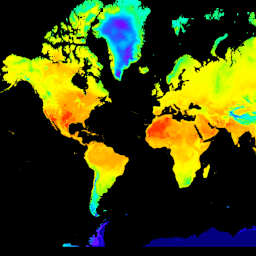
- در دسترس بودن مجموعه دادهها
- 1950-01-01T01:00:00Z–2026-09-01T23:00:00Z
- تولیدکننده مجموعه داده
- فروشگاه دادههای اقلیمی کوپرنیک
- کادانس
- ۱ ساعت
- برچسبها
توضیحات
ERA5-Land یک مجموعه داده بازتحلیل است که دیدگاهی منسجم از تکامل متغیرهای زمین در طول چندین دهه با وضوح بهبود یافته در مقایسه با ERA5 ارائه میدهد. ERA5-Land با بازپخش مؤلفه زمین از بازتحلیل اقلیمی ECMWF ERA5 تولید شده است. بازتحلیل، دادههای مدل را با مشاهدات از سراسر جهان در یک مجموعه داده کامل و سازگار جهانی با استفاده از قوانین فیزیک ترکیب میکند. بازتحلیل، دادههایی را تولید میکند که چندین دهه به عقب برمیگردند و توصیف دقیقی از آب و هوای گذشته ارائه میدهند. این مجموعه داده شامل هر 50 متغیر موجود در CDS است.
دادههای ERA5-Land از سال ۱۹۵۰ تا سه ماه آینده به صورت بلادرنگ در دسترس هستند.
لطفاً به بخش «مسائل شناختهشده» ERA5-Land مراجعه کنید. بهطور خاص، توجه داشته باشید که مقادیر سه مؤلفه از کل تبخیر و تعرق به شرح زیر جابجا شدهاند:
- متغیر «تبخیر از خاک لخت» (کد پارامتر mars 228101 (evabs)) دارای مقادیری است که مربوط به «تبخیر از تعرق پوشش گیاهی» (پارامتر mars 228103 (evavt)) است.
- متغیر «تبخیر از سطوح آبهای آزاد به جز اقیانوسها (کد پارامتر مریخ ۲۲۸۱۰۲ (evaow)) دارای مقادیری مطابق با «تبخیر از خاک لخت» (کد پارامتر مریخ ۲۲۸۱۰۱ (evabs)) است.
- متغیر «تبخیر ناشی از تعرق پوشش گیاهی» (کد پارامتر mars 228103 (evavt)) دارای مقادیری مطابق با «تبخیر از سطوح آبهای آزاد به جز اقیانوسها» (کد پارامتر mars 228102 (evaow)) است.
لطفاً توجه داشته باشید که قرارداد مربوط به انباشتگیهای مورد استفاده در ERA5-Land با ERA5 متفاوت است. با انباشتگیها همانند ERA-Interim یا ERA-Interim/Land رفتار میشود، یعنی از ابتدای پیشبینی تا انتهای مرحله پیشبینی انباشته میشوند. این اتفاق هر روز رخ میدهد و در نیمهشب مجدداً تنظیم میشود. برای اطلاعات بیشتر به این صفحه مراجعه کنید . تیم Earth Engine Data، 19 باند اضافی، یکی برای هر یک از باندهای انباشتگی، اضافه کرده است که مقادیر ساعتی آن به عنوان تفاوت بین دو مرحله پیشبینی متوالی محاسبه میشود.
باندها
باندها
اندازه پیکسل: ۱۱۱۳۲ متر (همه باندها)
| نام | واحدها | اندازه پیکسل | توضیحات |
|---|---|---|---|
dewpoint_temperature_2m | ک | ۱۱۱۳۲ متر | دمایی که هوا در ارتفاع ۲ متری بالای سطح زمین باید تا آن دما خنک شود تا اشباع رخ دهد. این معیاری از رطوبت هوا است. با ترکیب آن با دما و فشار، میتوان رطوبت نسبی را محاسبه کرد. دمای نقطه شبنم ۲ متری با درونیابی بین پایینترین سطح مدل و سطح زمین، با در نظر گرفتن شرایط جوی محاسبه میشود. |
temperature_2m | ک | ۱۱۱۳۲ متر | دمای هوا در ارتفاع ۲ متری بالای سطح زمین، دریا یا آبهای داخلی. دمای ۲ متری با درونیابی بین پایینترین سطح مدل و سطح زمین، با در نظر گرفتن شرایط جوی محاسبه میشود. |
skin_temperature | ک | ۱۱۱۳۲ متر | دمای سطح زمین. دمای پوست، دمای نظری مورد نیاز برای برآوردن تعادل انرژی سطحی است. این دما، دمای بالاترین لایه سطحی را نشان میدهد که ظرفیت گرمایی ندارد و بنابراین میتواند فوراً به تغییرات شارهای سطحی پاسخ دهد. دمای پوست در خشکی و دریا به طور متفاوتی محاسبه میشود. |
soil_temperature_level_1 | ک | ۱۱۱۳۲ متر | دمای خاک در لایه ۱ (۰ تا ۷ سانتیمتر) از سیستم پیشبینی یکپارچه ECMWF. سطح در ۰ سانتیمتر است. دمای خاک در وسط هر لایه تنظیم شده و انتقال حرارت در سطوح مشترک بین آنها محاسبه میشود. فرض بر این است که هیچ انتقال حرارتی از پایینترین لایه وجود ندارد. |
soil_temperature_level_2 | ک | ۱۱۱۳۲ متر | دمای خاک در لایه ۲ (۷-۲۸ سانتیمتر) از سامانه پیشبینی یکپارچه ECMWF. |
soil_temperature_level_3 | ک | ۱۱۱۳۲ متر | دمای خاک در لایه ۳ (۲۸-۱۰۰ سانتیمتر) از سامانه پیشبینی یکپارچه ECMWF. |
soil_temperature_level_4 | ک | ۱۱۱۳۲ متر | دمای خاک در لایه ۴ (۱۰۰-۲۸۹ سانتیمتر) از سامانه پیشبینی یکپارچه ECMWF. |
lake_bottom_temperature | ک | ۱۱۱۳۲ متر | دمای آب در کف آبراههای داخلی (دریاچهها، مخازن، رودخانهها) و آبهای ساحلی. ECMWF در ماه مه ۲۰۱۵ یک مدل دریاچه را برای نمایش دمای آب و یخ دریاچههای تمام آبراههای داخلی اصلی جهان در سیستم پیشبینی یکپارچه اجرا کرد. این مدل عمق و مساحت سطح دریاچه (یا پوشش کسری) را در طول زمان ثابت نگه میدارد. |
lake_ice_depth | متر | ۱۱۱۳۲ متر | ضخامت یخ روی آبهای داخلی (دریاچهها، مخازن و رودخانهها) و آبهای ساحلی. سیستم پیشبینی یکپارچه ECMWF (IFS) نشان دهنده تشکیل و ذوب یخ روی آبهای داخلی (دریاچهها، مخازن و رودخانهها) و آبهای ساحلی است. یک لایه یخ واحد نشان داده شده است. این پارامتر ضخامت آن لایه یخ است. |
lake_ice_temperature | ک | ۱۱۱۳۲ متر | دمای بالاترین سطح یخ روی آبهای داخلی (دریاچهها، مخازن، رودخانهها) و آبهای ساحلی. سامانه پیشبینی یکپارچه ECMWF نشان دهنده تشکیل و ذوب یخ روی دریاچهها است. یک لایه یخ واحد نشان داده شده است. |
lake_mix_layer_depth | متر | ۱۱۱۳۲ متر | ضخامت لایه بالایی یک توده آبی داخلی (دریاچه، مخازن و رودخانهها) یا آبهای ساحلی که به خوبی مخلوط شده و دمای تقریباً ثابتی با عمق دارد (توزیع یکنواخت دما). سیستم پیشبینی یکپارچه ECMWF، تودههای آبی داخلی را با دو لایه در حالت عمودی، لایه مخلوط در بالا و ترموکلاین در پایین نشان میدهد. مرز بالایی ترموکلاینها در پایین لایه مخلوط و مرز پایینی در کف دریاچه قرار دارد. اختلاط در لایه مخلوط میتواند زمانی رخ دهد که چگالی آب سطحی (و نزدیک به سطح) بیشتر از آب زیرین باشد. اختلاط همچنین میتواند از طریق عملکرد باد بر روی سطح دریاچه رخ دهد. |
lake_mix_layer_temperature | ک | ۱۱۱۳۲ متر | دمای بالاترین لایه از آبهای داخلی (دریاچهها، مخازن و رودخانهها) یا آبهای ساحلی) که به خوبی مخلوط شده است. سیستم پیشبینی یکپارچه ECMWF، آبهای داخلی را با دو لایه عمودی، لایه مخلوط در بالا و ترموکلاین در پایین نشان میدهد. مرز بالایی ترموکلاین در پایین لایه مخلوط و مرز پایینی در کف دریاچه قرار دارد. اختلاط در لایه مخلوط میتواند زمانی رخ دهد که چگالی آب سطحی (و نزدیک به سطح) بیشتر از آب زیرین باشد. اختلاط همچنین میتواند از طریق عملکرد باد بر روی سطح دریاچه رخ دهد. |
lake_shape_factor | ۱۱۱۳۲ متر | این پارامتر نحوه تغییر دما با عمق در لایه ترموکلاین آبهای داخلی (دریاچهها، مخازن و رودخانهها) و آبهای ساحلی را توصیف میکند. از آن برای محاسبه دمای کف دریاچه و سایر پارامترهای مرتبط با دریاچه استفاده میشود. سیستم پیشبینی یکپارچه ECMWF، آبهای داخلی و ساحلی را با دو لایه در حالت عمودی، لایه ترکیبی در بالا و ترموکلاین در پایین که دما با عمق تغییر میکند، نشان میدهد. | |
lake_total_layer_temperature | ک | ۱۱۱۳۲ متر | میانگین دمای کل ستون آب در آبهای داخلی (دریاچهها، مخازن و رودخانهها) و آبهای ساحلی. سیستم پیشبینی یکپارچه ECMWF، آبهای داخلی را با دو لایه در حالت عمودی، لایه ترکیبی در بالا و ترموکلاین در پایین که دما با عمق تغییر میکند، نشان میدهد. این پارامتر میانگین دو لایه است. |
snow_albedo | ۱۱۱۳۲ متر | این به عنوان کسری از تابش خورشیدی (موج کوتاه) که توسط برف، در سراسر طیف خورشیدی، برای تابش مستقیم و پراکنده منعکس میشود، تعریف میشود. این معیاری از بازتاب سلولهای شبکهای پوشیده از برف است. مقادیر آن بین 0 تا 1 متغیر است. به طور معمول، برف و یخ بازتاب بالایی با مقادیر آلبدو 0.8 و بالاتر دارند. | |
snow_cover | ۱۱۱۳۲ متر | این نشان دهنده کسری (0-1) از سلول/جعبه شبکه اشغال شده توسط برف است (مشابه میدانهای پوشش ابر ERA5). | |
snow_density | کیلوگرم بر متر مکعب | ۱۱۱۳۲ متر | جرم برف در هر متر مکعب در لایه برف. مدل سیستم پیشبینی یکپارچه (IFS) ECMWF برف را به عنوان یک لایه اضافی واحد روی بالاترین سطح خاک نشان میدهد. برف ممکن است تمام یا بخشی از کادر شبکه را بپوشاند. |
snow_depth | متر | ۱۱۱۳۲ متر | میانگین لحظهای ضخامت برف روی زمین (به استثنای برف روی تاج پوشش) در قالب شبکهای. |
snow_depth_water_equivalent | متر معادل آب | ۱۱۱۳۲ متر | عمق برف از ناحیه پوشیده از برف یک جعبه شبکه. واحدهای آن متر معادل آب است، بنابراین عمقی است که آب در صورت ذوب شدن برف و پخش شدن یکنواخت آن در کل جعبه شبکه خواهد داشت. سیستم پیشبینی یکپارچه ECMWF برف را به عنوان یک لایه اضافی واحد روی بالاترین سطح خاک نشان میدهد. برف ممکن است تمام یا بخشی از جعبه شبکه را بپوشاند. |
snowfall | متر معادل آب | ۱۱۱۳۲ متر | کل برف انباشته شده که به سطح زمین باریده است. این برف شامل برف ناشی از جریان جوی در مقیاس بزرگ (مقیاسهای افقی بزرگتر از حدود چند صد متر) و همرفت است که در آن مناطق کوچکتر (حدود 5 کیلومتر تا چند صد کیلومتر) از هوای گرم بالا میروند. اگر برف در طول دورهای که این متغیر انباشته شده است ذوب شده باشد، آنگاه بیشتر از عمق برف خواهد بود. این متغیر، کل مقدار آب انباشته شده از ابتدای زمان پیشبینی تا پایان مرحله پیشبینی است. واحدهای داده شده، عمق آب را در صورت ذوب شدن برف و پخش شدن یکنواخت آن در جعبه شبکه اندازهگیری میکنند. هنگام مقایسه متغیرهای مدل با مشاهدات باید دقت کرد، زیرا مشاهدات اغلب به یک نقطه خاص در فضا و زمان محلی هستند، نه اینکه میانگینها را در یک جعبه شبکه مدل و مرحله زمانی مدل نشان دهند. |
snowmelt | متر معادل آب | ۱۱۱۳۲ متر | میانگین ذوب برف روی مربع شبکه (برای یافتن ذوب برف، آن را بر کسر برف تقسیم کنید). این متغیر از ابتدای زمان پیشبینی تا انتهای مرحله پیشبینی جمع میشود. |
temperature_of_snow_layer | ک | ۱۱۱۳۲ متر | این متغیر دمای لایه برف را از زمین تا سطح مشترک برف-هوا نشان میدهد. مدل سیستم پیشبینی یکپارچه (IFS) ECMWF برف را به عنوان یک لایه اضافی واحد روی بالاترین سطح خاک نشان میدهد. برف ممکن است تمام یا بخشی از کادر شبکه را بپوشاند. |
skin_reservoir_content | متر معادل آب | ۱۱۱۳۲ متر | مقدار آب موجود در پوشش گیاهی و/یا در یک لایه نازک روی خاک. این مقدار، میزان بارانی را که توسط شاخ و برگ جذب میشود و آب حاصل از شبنم را نشان میدهد. حداکثر مقدار «محتوای مخزن پوست» که یک جعبه شبکهای میتواند در خود نگه دارد، به نوع پوشش گیاهی بستگی دارد و ممکن است صفر باشد. آب از طریق تبخیر از «مخزن پوست» خارج میشود. |
volumetric_soil_water_layer_1 | کسر حجمی | ۱۱۱۳۲ متر | حجم آب در لایه ۱ خاک (۰ تا ۷ سانتیمتر) از سیستم پیشبینی یکپارچه ECMWF. سطح در ۰ سانتیمتر است. آب حجمی خاک با بافت خاک (یا طبقهبندی)، عمق خاک و سطح آب زیرزمینی زیرین مرتبط است. |
volumetric_soil_water_layer_2 | کسر حجمی | ۱۱۱۳۲ متر | حجم آب در لایه دوم خاک (7 تا 28 سانتیمتر) از سامانه پیشبینی یکپارچه ECMWF. |
volumetric_soil_water_layer_3 | کسر حجمی | ۱۱۱۳۲ متر | حجم آب در لایه ۳ خاک (۲۸-۱۰۰ سانتیمتر) از سامانه پیشبینی یکپارچه ECMWF. |
volumetric_soil_water_layer_4 | کسر حجمی | ۱۱۱۳۲ متر | حجم آب در لایه خاک ۴ (۱۰۰-۲۸۹ سانتیمتر) از سامانه پیشبینی یکپارچه ECMWF. |
forecast_albedo | ۱۱۱۳۲ متر | معیاری برای سنجش بازتابندگی سطح زمین است. این کسری از تابش خورشیدی (موج کوتاه) است که توسط سطح زمین، در سراسر طیف خورشیدی، برای تابش مستقیم و پراکنده منعکس میشود. مقادیر بین ۰ تا ۱ هستند. معمولاً برف و یخ دارای بازتابندگی بالایی با مقادیر آلبدو ۰.۸ و بالاتر هستند، زمین مقادیر متوسطی بین حدود ۰.۱ تا ۰.۴ دارد و اقیانوس مقادیر کم ۰.۱ یا کمتر دارد. تابش خورشید (تابش خورشیدی یا موج کوتاه) تا حدی توسط ابرها و ذرات موجود در جو (آئروسلها) به فضا منعکس میشود و مقداری از آن جذب میشود. بقیه آن به سطح زمین برخورد میکند، جایی که مقداری از آن منعکس میشود. بخشی که توسط سطح زمین منعکس میشود به آلبدو بستگی دارد. در سیستم پیشبینی یکپارچه ECMWF (IFS)، از آلبدو پسزمینه اقلیمی (مقادیر مشاهده شده به طور متوسط در یک دوره چند ساله) استفاده میشود که توسط مدل روی آب، یخ و برف اصلاح میشود. آلبدو اغلب به صورت درصد (%) نشان داده میشود. | |
surface_latent_heat_flux | ژول بر متر مربع | ۱۱۱۳۲ متر | تبادل گرمای نهان با سطح از طریق انتشار آشفته. این متغیرها از ابتدای زمان پیشبینی تا انتهای مرحله پیشبینی جمع میشوند. طبق قرارداد مدل، شارهای رو به پایین مثبت هستند. |
surface_net_solar_radiation | ژول بر متر مربع | ۱۱۱۳۲ متر | مقدار تابش خورشیدی (که به عنوان تابش موج کوتاه نیز شناخته میشود) که به سطح زمین میرسد (چه مستقیم و چه پراکنده) منهای مقدار بازتاب شده توسط سطح زمین (که توسط آلبدو کنترل میشود). تابش خورشید (تابش خورشیدی یا موج کوتاه) تا حدی توسط ابرها و ذرات موجود در جو (آئروسلها) به فضا بازتاب میشود و مقداری از آن جذب میشود. بقیه به سطح زمین برخورد میکند، جایی که مقداری از آن بازتاب میشود. تفاوت بین تابش خورشیدی رو به پایین و بازتاب شده، تابش خورشیدی خالص سطحی است. این متغیر از ابتدای زمان پیشبینی تا انتهای مرحله پیشبینی جمع میشود. واحدها ژول بر متر مربع (J m-2) هستند. برای تبدیل به وات بر متر مربع (W m-2)، مقادیر جمع شده باید بر دوره انباشت بیان شده بر حسب ثانیه تقسیم شوند. قرارداد ECMWF برای شارهای عمودی به سمت پایین مثبت است. |
surface_net_thermal_radiation | ژول بر متر مربع | ۱۱۱۳۲ متر | تابش حرارتی خالص در سطح. میدان تجمعی از ابتدای زمان پیشبینی تا انتهای مرحله پیشبینی. طبق قرارداد مدل، شارهای رو به پایین مثبت هستند. |
surface_sensible_heat_flux | ژول بر متر مربع | ۱۱۱۳۲ متر | انتقال گرما بین سطح زمین و جو از طریق اثرات حرکت هوای متلاطم (اما بدون در نظر گرفتن هرگونه انتقال گرما ناشی از تراکم یا تبخیر). مقدار شار گرمای محسوس توسط اختلاف دما بین سطح و جو رویی، سرعت باد و زبری سطح تعیین میشود. به عنوان مثال، هوای سرد روی یک سطح گرم، شار گرمای محسوسی را از زمین (یا اقیانوس) به جو تولید میکند. این یک متغیر تک سطحی است و از ابتدای زمان پیشبینی تا انتهای مرحله پیشبینی انباشته میشود. واحدها ژول بر متر مربع (J m-2) هستند. برای تبدیل به وات بر متر مربع (W m-2)، مقادیر انباشته شده باید بر دوره انباشت بیان شده بر حسب ثانیه تقسیم شوند. قرارداد ECMWF برای شارهای عمودی به سمت پایین مثبت است. |
surface_solar_radiation_downwards | ژول بر متر مربع | ۱۱۱۳۲ متر | مقدار تابش خورشیدی (که به عنوان تابش موج کوتاه نیز شناخته میشود) که به سطح زمین میرسد. این متغیر شامل تابش خورشیدی مستقیم و پراکنده است. تابش خورشید (تابش خورشیدی یا موج کوتاه) تا حدی توسط ابرها و ذرات موجود در جو (آئروسلها) به فضا منعکس میشود و مقداری از آن جذب میشود. بقیه آن به سطح زمین برخورد میکند (که با این متغیر نشان داده میشود). با تقریب نسبتاً خوبی، این متغیر معادل مدلی است که توسط یک پیرانومتر (ابزاری برای اندازهگیری تابش خورشیدی) در سطح اندازهگیری میشود. با این حال، هنگام مقایسه متغیرهای مدل با مشاهدات باید دقت کرد، زیرا مشاهدات اغلب به یک نقطه خاص در فضا و زمان محلی هستند، نه اینکه میانگینها را در یک جعبه شبکه مدل و گام زمانی مدل نشان دهند. این متغیر از ابتدای زمان پیشبینی تا انتهای گام پیشبینی انباشته میشود. واحدها ژول بر متر مربع (J m-2) هستند. برای تبدیل به وات بر متر مربع (W m-2)، مقادیر انباشته شده باید بر دوره انباشت بیان شده بر حسب ثانیه تقسیم شوند. قرارداد ECMWF برای شارهای عمودی به سمت پایین مثبت است. |
surface_thermal_radiation_downwards | ژول بر متر مربع | ۱۱۱۳۲ متر | مقدار تابش حرارتی (که به عنوان تابش موج بلند یا زمینی نیز شناخته میشود) ساطع شده توسط جو و ابرها که به سطح زمین میرسد. سطح زمین تابش حرارتی ساطع میکند که مقداری از آن توسط جو و ابرها جذب میشود. جو و ابرها نیز تابش حرارتی را در همه جهات ساطع میکنند که مقداری از آن به سطح میرسد (که با این متغیر نشان داده میشود). این متغیر از ابتدای زمان پیشبینی تا انتهای مرحله پیشبینی جمع میشود. واحدها ژول بر متر مربع (J m-2) هستند. برای تبدیل به وات بر متر مربع (W m-2)، مقادیر جمع شده باید بر دوره تجمع بیان شده بر حسب ثانیه تقسیم شوند. قرارداد ECMWF برای شارهای عمودی به سمت پایین مثبت است. |
evaporation_from_bare_soil | متر معادل آب | ۱۱۱۳۲ متر | میزان تبخیر از خاک لخت در بالای سطح زمین. این متغیر از ابتدای زمان پیشبینی تا انتهای مرحله پیشبینی جمع میشود. |
evaporation_from_open_water_surfaces_excluding_oceans | متر معادل آب | ۱۱۱۳۲ متر | میزان تبخیر از ذخایر آب سطحی مانند دریاچهها و مناطق سیلزده اما به استثنای اقیانوسها. این متغیر از ابتدای زمان پیشبینی تا پایان مرحله پیشبینی جمعآوری میشود. |
evaporation_from_the_top_of_canopy | متر معادل آب | ۱۱۱۳۲ متر | میزان تبخیر از مخزن جذب تاج پوشش در بالای تاج پوشش. این متغیر از ابتدای زمان پیشبینی تا انتهای مرحله پیشبینی جمع میشود. |
evaporation_from_vegetation_transpiration | متر معادل آب | ۱۱۱۳۲ متر | میزان تبخیر ناشی از تعرق پوشش گیاهی. این همان معنای استخراج ریشه را دارد، یعنی مقدار آب استخراج شده از لایههای مختلف خاک. این متغیر از ابتدای زمان پیشبینی تا پایان مرحله پیشبینی جمع میشود. |
potential_evaporation | متر | ۱۱۱۳۲ متر | تبخیر بالقوه (pev) در مدل فعلی ECMWF با فراخوانی مجدد روال تعادل انرژی سطحی با متغیرهای پوشش گیاهی تنظیم شده روی "کشاورزی زراعی/مختلط" و با فرض عدم وجود تنش از رطوبت خاک محاسبه میشود. به عبارت دیگر، تبخیر برای زمینهای کشاورزی طوری محاسبه میشود که گویی به خوبی آبیاری میشوند و با فرض اینکه جو تحت تأثیر این شرایط مصنوعی سطح قرار نمیگیرد. مورد دوم ممکن است همیشه واقعبینانه نباشد. اگرچه pev برای ارائه تخمینی از نیازهای آبیاری در نظر گرفته شده است، اما این روش میتواند در شرایط خشک به دلیل تبخیر بیش از حد شدید ناشی از هوای خشک، نتایج غیرواقعی ارائه دهد. این متغیر از ابتدای زمان پیشبینی تا انتهای مرحله پیشبینی انباشته میشود. |
runoff | متر | ۱۱۱۳۲ متر | مقداری از آب حاصل از بارندگی، ذوب برف یا در اعماق خاک، در خاک ذخیره میشود. در غیر این صورت، آب یا روی سطح (رواناب سطحی) یا زیر زمین (رواناب زیرسطحی) تخلیه میشود و مجموع این دو به سادگی "رواناب" نامیده میشود. این متغیر، کل مقدار آب انباشته شده از ابتدای زمان پیشبینی تا پایان مرحله پیشبینی است. واحد رواناب، عمق بر حسب متر است. این عمقی است که آب در صورت پخش شدن یکنواخت روی جعبه شبکه خواهد داشت. هنگام مقایسه متغیرهای مدل با مشاهدات باید دقت کرد، زیرا مشاهدات اغلب به جای میانگینگیری در یک منطقه مربع شبکه، به یک نقطه خاص محلی هستند. مشاهدات همچنین اغلب در واحدهای مختلف، مانند میلیمتر در روز، به جای مترهای انباشته شده تولید شده در اینجا، انجام میشوند. رواناب معیاری از میزان آب موجود در خاک است و به عنوان مثال، میتواند به عنوان شاخص خشکسالی یا سیل استفاده شود. اطلاعات بیشتر در مورد نحوه محاسبه رواناب در مستندات فرآیندهای فیزیکی IFS ارائه شده است. |
snow_evaporation | متر معادل آب | ۱۱۱۳۲ متر | تبخیر از برف به طور متوسط در جعبه شبکه (برای یافتن شار برف، آن را بر کسر برف تقسیم کنید). این متغیر از ابتدای زمان پیشبینی تا انتهای مرحله پیشبینی جمع میشود. |
sub_surface_runoff | متر | ۱۱۱۳۲ متر | مقداری از آب حاصل از بارندگی، ذوب برف یا در اعماق خاک، در خاک ذخیره میشود. در غیر این صورت، آب یا روی سطح (رواناب سطحی) یا زیر زمین (رواناب زیرسطحی) تخلیه میشود و مجموع این دو به سادگی «رواناب» نامیده میشود. این متغیر از ابتدای زمان پیشبینی تا انتهای مرحله پیشبینی انباشته میشود. واحدهای رواناب، عمق بر حسب متر هستند. این عمقی است که آب در صورت پخش شدن یکنواخت روی جعبه شبکه خواهد داشت. هنگام مقایسه متغیرهای مدل با مشاهدات باید دقت کرد، زیرا مشاهدات اغلب به جای میانگینگیری در یک منطقه مربع شبکه، به یک نقطه خاص محلی هستند. مشاهدات همچنین اغلب در واحدهای مختلف، مانند میلیمتر در روز، به جای مترهای انباشته شده تولید شده در اینجا، انجام میشوند. رواناب معیاری از میزان آب موجود در خاک است و به عنوان مثال میتواند به عنوان شاخص خشکسالی یا سیل استفاده شود. اطلاعات بیشتر در مورد نحوه محاسبه رواناب در مستندات فرآیندهای فیزیکی IFS ارائه شده است. |
surface_runoff | متر | ۱۱۱۳۲ متر | مقداری از آب حاصل از بارندگی، ذوب برف یا در اعماق خاک، در خاک ذخیره میشود. در غیر این صورت، آب یا روی سطح (رواناب سطحی) یا زیر زمین (رواناب زیرسطحی) تخلیه میشود و مجموع این دو به سادگی "رواناب" نامیده میشود. این متغیر، کل مقدار آب انباشته شده از ابتدای زمان پیشبینی تا پایان مرحله پیشبینی است. واحد رواناب، عمق بر حسب متر است. این عمقی است که آب در صورت پخش شدن یکنواخت روی جعبه شبکه خواهد داشت. هنگام مقایسه متغیرهای مدل با مشاهدات باید دقت کرد، زیرا مشاهدات اغلب به جای میانگینگیری در یک منطقه مربع شبکه، به یک نقطه خاص محلی هستند. مشاهدات همچنین اغلب در واحدهای مختلف، مانند میلیمتر در روز، به جای مترهای انباشته شده تولید شده در اینجا، انجام میشوند. رواناب معیاری از میزان آب موجود در خاک است و به عنوان مثال، میتواند به عنوان شاخص خشکسالی یا سیل استفاده شود. اطلاعات بیشتر در مورد نحوه محاسبه رواناب در مستندات فرآیندهای فیزیکی IFS ارائه شده است. |
total_evaporation | متر معادل آب | ۱۱۱۳۲ متر | مقدار آب انباشته شده که از سطح زمین تبخیر شده است، شامل نمایش ساده شده تعرق (از پوشش گیاهی)، و تبدیل آن به بخار در هوای بالا. این متغیر از ابتدای پیشبینی تا انتهای مرحله پیشبینی انباشته میشود. قرارداد سیستم پیشبینی یکپارچه ECMWF این است که شارهای رو به پایین مثبت هستند. بنابراین، مقادیر منفی نشان دهنده تبخیر و مقادیر مثبت نشان دهنده میعان هستند. |
u_component_of_wind_10m | اماس | ۱۱۱۳۲ متر | مؤلفه شرقی باد ۱۰ متری. این سرعت افقی هوا است که در ارتفاع ده متری از سطح زمین، بر حسب متر بر ثانیه، به سمت شرق حرکت میکند. هنگام مقایسه این متغیر با مشاهدات باید دقت شود، زیرا مشاهدات باد در مقیاسهای مکانی و زمانی کوچک متفاوت است و تحت تأثیر عوارض محلی، پوشش گیاهی و ساختمانهایی قرار میگیرد که فقط به طور متوسط در سیستم پیشبینی یکپارچه ECMWF نشان داده میشوند. این متغیر را میتوان با مؤلفه V باد ۱۰ متری ترکیب کرد تا سرعت و جهت باد افقی ۱۰ متری را به دست آورد. |
v_component_of_wind_10m | اماس | ۱۱۱۳۲ متر | مؤلفه شمالی باد ۱۰ متری. این سرعت افقی هوا است که در ارتفاع ده متری از سطح زمین به سمت شمال حرکت میکند و بر حسب متر بر ثانیه است. هنگام مقایسه این متغیر با مشاهدات باید دقت کرد، زیرا مشاهدات باد در مقیاسهای مکانی و زمانی کوچک متفاوت است و تحت تأثیر عوارض محلی، پوشش گیاهی و ساختمانهایی قرار میگیرد که فقط به طور متوسط در سیستم پیشبینی یکپارچه ECMWF نشان داده میشوند. این متغیر را میتوان با مؤلفه U باد ۱۰ متری ترکیب کرد تا سرعت و جهت باد افقی ۱۰ متری را به دست آورد. |
surface_pressure | پا | ۱۱۱۳۲ متر | فشار (نیرو بر واحد سطح) جو بر روی سطح زمین، دریا و آبهای درون خشکی. این معیاری از وزن تمام هوای موجود در یک ستون عمودی بالای سطح زمین است که در یک نقطه ثابت نشان داده میشود. فشار سطح اغلب در ترکیب با دما برای محاسبه چگالی هوا استفاده میشود. تغییرات شدید فشار با ارتفاع، مشاهده سیستمهای کمفشار و پرفشار را بر روی مناطق کوهستانی دشوار میکند، بنابراین معمولاً از فشار متوسط سطح دریا، به جای فشار سطح، برای این منظور استفاده میشود. واحدهای این متغیر پاسکال (Pa) هستند. فشار سطح اغلب بر حسب هکتوپاسکال اندازهگیری میشود و گاهی اوقات در واحدهای قدیمی میلیبار، میلیبار (1 هکتوپاسکال = 1 میلیبار = 100 پاسکال) ارائه میشود. |
total_precipitation | متر | ۱۱۱۳۲ متر | آب مایع و یخزده انباشتهشده، شامل باران و برف، که به سطح زمین میبارد. این مجموع بارش در مقیاس بزرگ (بارشی که توسط الگوهای آب و هوایی در مقیاس بزرگ، مانند ناوهها و جبهههای سرد ایجاد میشود) و بارش همرفتی (که توسط همرفت ایجاد میشود و زمانی رخ میدهد که هوا در سطوح پایینتر جو گرمتر و کمچگالتر از هوای بالا باشد، بنابراین بالا میرود) است. متغیرهای بارش شامل مه، شبنم یا بارشی که قبل از فرود آمدن در سطح زمین در جو تبخیر میشود، نمیشوند. این متغیر از ابتدای زمان پیشبینی تا انتهای مرحله پیشبینی انباشته میشود. واحدهای بارش عمق بر حسب متر هستند. این عمقی است که آب اگر به طور مساوی روی جعبه شبکه پخش شود، خواهد داشت. هنگام مقایسه متغیرهای مدل با مشاهدات باید دقت کرد، زیرا مشاهدات اغلب به یک نقطه خاص در فضا و زمان محلی هستند، نه اینکه میانگینها را در یک جعبه شبکه مدل و مرحله زمانی مدل نشان دهند. |
leaf_area_index_high_vegetation | کسر مساحت | ۱۱۱۳۲ متر | نیمی از کل سطح برگ سبز در واحد سطح افقی زمین برای نوع پوشش گیاهی متراکم. |
leaf_area_index_low_vegetation | کسر مساحت | ۱۱۱۳۲ متر | نیمی از کل سطح برگ سبز در واحد سطح افقی زمین برای نوع پوشش گیاهی کم ارتفاع. |
snowfall_hourly | متر معادل آب | ۱۱۱۳۲ متر | بارش برف از مقادیر تجمعی اولیه به مقادیر ساعتی تفکیک شده است |
snowmelt_hourly | متر معادل آب | ۱۱۱۳۲ متر | ذوب برف از مقادیر تجمعی اولیه به مقادیر ساعتی تفکیک شده است |
surface_latent_heat_flux_hourly | ژول بر متر مربع | ۱۱۱۳۲ متر | شار گرمای نهان سطحی که از مقادیر تجمعی اولیه به مقادیر ساعتی تفکیک شده است |
surface_net_solar_radiation_hourly | ژول بر متر مربع | ۱۱۱۳۲ متر | تابش خالص خورشیدی سطحی که از مقادیر تجمعی اولیه به مقادیر ساعتی تفکیک شده است |
surface_net_thermal_radiation_hourly | ژول بر متر مربع | ۱۱۱۳۲ متر | تابش حرارتی خالص سطحی که از مقادیر تجمعی اولیه به مقادیر ساعتی تفکیک شده است |
surface_sensible_heat_flux_hourly | ژول بر متر مربع | ۱۱۱۳۲ متر | شار گرمای محسوس سطحی که از مقادیر تجمعی اولیه به مقادیر ساعتی تفکیک شده است |
surface_solar_radiation_downwards_hourly | ژول بر متر مربع | ۱۱۱۳۲ متر | تابش خورشیدی سطحی به سمت پایین، از مقادیر تجمعی اولیه به مقادیر ساعتی تفکیک شده است |
surface_thermal_radiation_downwards_hourly | ژول بر متر مربع | ۱۱۱۳۲ متر | تابش حرارتی سطحی به سمت پایین که از مقادیر تجمعی اولیه به مقادیر ساعتی تفکیک شده است |
evaporation_from_bare_soil_hourly | متر معادل آب | ۱۱۱۳۲ متر | تبخیر از خاک لخت که از مقادیر تجمعی اولیه به مقادیر ساعتی تفکیک شده است |
evaporation_from_open_water_surfaces_excluding_oceans_hourly | متر معادل آب | ۱۱۱۳۲ متر | تبخیر از سطوح آبهای آزاد به جز اقیانوسها، تفکیکشده از مقادیر تجمعی اولیه به مقادیر ساعتی |
evaporation_from_the_top_of_canopy_hourly | متر معادل آب | ۱۱۱۳۲ متر | تبخیر از بالای تاج پوشش گیاهی که از مقادیر تجمعی اولیه به مقادیر ساعتی تفکیک شده است |
evaporation_from_vegetation_transpiration_hourly | متر معادل آب | ۱۱۱۳۲ متر | تبخیر ناشی از تعرق پوشش گیاهی که از مقادیر تجمعی اولیه به مقادیر ساعتی تفکیک شده است |
potential_evaporation_hourly | متر | ۱۱۱۳۲ متر | تبخیر بالقوه تفکیک شده از مقادیر تجمعی اولیه به مقادیر ساعتی |
runoff_hourly | متر | ۱۱۱۳۲ متر | رواناب تفکیک شده از مقادیر تجمعی اولیه به مقادیر ساعتی |
snow_evaporation_hourly | متر معادل آب | ۱۱۱۳۲ متر | تبخیر برف از مقادیر تجمعی اولیه به مقادیر ساعتی تفکیک شده است |
sub_surface_runoff_hourly | متر | ۱۱۱۳۲ متر | رواناب زیرسطحی از مقادیر تجمعی اولیه به مقادیر ساعتی تفکیک شده است |
surface_runoff_hourly | متر | ۱۱۱۳۲ متر | رواناب سطحی تفکیک شده از مقادیر تجمعی اولیه به مقادیر ساعتی |
total_evaporation_hourly | متر معادل آب | ۱۱۱۳۲ متر | تبخیر کل تفکیک شده از مقادیر تجمعی اولیه به مقادیر ساعتی |
total_precipitation_hourly | متر | ۱۱۱۳۲ متر | کل بارش تفکیکشده از مقادیر تجمعی اولیه به مقادیر ساعتی |
ویژگیهای تصویر
ویژگیهای تصویر
| نام | نوع | توضیحات |
|---|---|---|
| ساعت | داخلی | ساعت روز |
شرایط استفاده
شرایط استفاده
لطفاً استفاده از ERA5-Land را همانطور که در توافقنامه مجوز Copernicus C3S/CAMS ذکر شده است، تأیید کنید:
۵.۱.۱ در مواردی که دارنده مجوز، محصولات کوپرنیک را به عموم مردم ارائه یا توزیع میکند، باید با استفاده از اطلاعیه زیر یا هرگونه اطلاعیه مشابه، منبع را به اطلاع گیرندگان برساند: «تولید شده با استفاده از اطلاعات خدمات تغییرات اقلیمی کوپرنیک [سال]».
۵.۱.۲ در مواردی که دارنده مجوز، انتشار یا توزیعی حاوی محصولات کوپرنیکِ اصلاحشده یا تغییریافته را انجام میدهد یا در آن مشارکت میکند، دارنده مجوز باید اطلاعیه زیر یا هرگونه اطلاعیه مشابه را ارائه دهد: «حاوی اطلاعات خدمات تغییرات اقلیمی کوپرنیکِ اصلاحشده [سال]»؛
هرگونه انتشار یا توزیعی که مشمول بندهای ۵.۱.۱ و ۵.۱.۲ باشد، باید تصریح کند که نه کمیسیون اروپا و نه ECMWF مسئولیتی در قبال هرگونه استفادهای که ممکن است از اطلاعات یا دادههای موجود در کوپرنیک انجام شود، ندارند.
نقل قولها
Muñoz Sabater, J., (2019): دادههای میانگین ماهانه ERA5-Land از سال 1981 تاکنون. سرویس تغییرات اقلیمی کوپرنیک (C3S) فروشگاه دادههای اقلیمی (CDS). (<تاریخ دسترسی>)، doi:10.24381/cds.68d2bb30
با موتور زمین کاوش کنید
ویرایشگر کد (جاوااسکریپت)
var dataset = ee.ImageCollection('ECMWF/ERA5_LAND/HOURLY')
                .filter(ee.Filter.date('2020-07-01', '2020-07-02'));

var visualization = {
  bands: ['temperature_2m'],
  min: 250.0,
  max: 320.0,
  palette: [
    '000080', '0000d9', '4000ff', '8000ff', '0080ff', '00ffff',
    '00ff80', '80ff00', 'daff00', 'ffff00', 'fff500', 'ffda00',
    'ffb000', 'ffa400', 'ff4f00', 'ff2500', 'ff0a00', 'ff00ff',
  ]
};

Map.setCenter(22.2, 21.2, 0);

Map.addLayer(dataset, visualization, 'Air temperature [K] at 2m height');
import ee
import geemap.core as geemap
کولب (پایتون)
dataset = ee.ImageCollection('ECMWF/ERA5_LAND/HOURLY').filter(
    ee.Filter.date('2020-07-01', '2020-07-02')
)

visualization = {
    'bands': ['temperature_2m'],
    'min': 250.0,
    'max': 320.0,
    'palette': [
        '000080', '0000d9', '4000ff', '8000ff', '0080ff', '00ffff',
        '00ff80', '80ff00', 'daff00', 'ffff00', 'fff500', 'ffda00',
        'ffb000', 'ffa400', 'ff4f00', 'ff2500', 'ff0a00', 'ff00ff',
    ],
}

m = geemap.Map()
m.set_center(22.2, 21.2, 0)
m.add_layer(dataset, visualization, 'Air temperature [K] at 2m height')
m
- در دسترس بودن مجموعه دادهها
- 1950-01-01T01:00:00Z–2026-09-01T23:00:00Z
- تولیدکننده مجموعه داده
- فروشگاه دادههای اقلیمی کوپرنیک
- کادانس
- ۱ ساعت
- برچسبها
توضیحات
ERA5-Land یک مجموعه داده بازتحلیل است که دیدگاهی منسجم از تکامل متغیرهای زمین در طول چندین دهه با وضوح بهبود یافته در مقایسه با ERA5 ارائه میدهد. ERA5-Land با بازپخش مؤلفه زمین از بازتحلیل اقلیمی ECMWF ERA5 تولید شده است. بازتحلیل، دادههای مدل را با مشاهدات از سراسر جهان در یک مجموعه داده کامل و سازگار جهانی با استفاده از قوانین فیزیک ترکیب میکند. بازتحلیل، دادههایی را تولید میکند که چندین دهه به عقب برمیگردند و توصیف دقیقی از آب و هوای گذشته ارائه میدهند. این مجموعه داده شامل هر 50 متغیر موجود در CDS است.
دادههای ERA5-Land از سال ۱۹۵۰ تا سه ماه آینده به صورت بلادرنگ در دسترس هستند.
لطفاً به بخش «مسائل شناختهشده» ERA5-Land مراجعه کنید. بهطور خاص، توجه داشته باشید که مقادیر سه مؤلفه از کل تبخیر و تعرق به شرح زیر جابجا شدهاند:
- متغیر «تبخیر از خاک لخت» (کد پارامتر mars 228101 (evabs)) دارای مقادیری است که مربوط به «تبخیر از تعرق پوشش گیاهی» (پارامتر mars 228103 (evavt)) است.
- متغیر «تبخیر از سطوح آبهای آزاد به جز اقیانوسها (کد پارامتر مریخ ۲۲۸۱۰۲ (evaow)) دارای مقادیری مطابق با «تبخیر از خاک لخت» (کد پارامتر مریخ ۲۲۸۱۰۱ (evabs)) است.
- متغیر «تبخیر ناشی از تعرق پوشش گیاهی» (کد پارامتر mars 228103 (evavt)) دارای مقادیری مطابق با «تبخیر از سطوح آبهای آزاد به جز اقیانوسها» (کد پارامتر mars 228102 (evaow)) است.
لطفاً توجه داشته باشید که قرارداد مربوط به انباشتگیهای مورد استفاده در ERA5-Land با ERA5 متفاوت است. با انباشتگیها همانند ERA-Interim یا ERA-Interim/Land رفتار میشود، یعنی از ابتدای پیشبینی تا انتهای مرحله پیشبینی انباشته میشوند. این اتفاق هر روز رخ میدهد و در نیمهشب مجدداً تنظیم میشود. برای اطلاعات بیشتر به این صفحه مراجعه کنید . تیم Earth Engine Data، 19 باند اضافی، یکی برای هر یک از باندهای انباشتگی، اضافه کرده است که مقادیر ساعتی آن به عنوان تفاوت بین دو مرحله پیشبینی متوالی محاسبه میشود.
باندها
باندها
اندازه پیکسل: ۱۱۱۳۲ متر (همه باندها)
| نام | واحدها | اندازه پیکسل | توضیحات |
|---|---|---|---|
dewpoint_temperature_2m | ک | ۱۱۱۳۲ متر | دمایی که هوا در ارتفاع ۲ متری بالای سطح زمین باید تا آن دما خنک شود تا اشباع رخ دهد. این معیاری از رطوبت هوا است. با ترکیب آن با دما و فشار، میتوان رطوبت نسبی را محاسبه کرد. دمای نقطه شبنم ۲ متری با درونیابی بین پایینترین سطح مدل و سطح زمین، با در نظر گرفتن شرایط جوی محاسبه میشود. |
temperature_2m | ک | ۱۱۱۳۲ متر | دمای هوا در ارتفاع ۲ متری بالای سطح زمین، دریا یا آبهای داخلی. دمای ۲ متری با درونیابی بین پایینترین سطح مدل و سطح زمین، با در نظر گرفتن شرایط جوی محاسبه میشود. |
skin_temperature | ک | ۱۱۱۳۲ متر | دمای سطح زمین. دمای پوست، دمای نظری مورد نیاز برای برآوردن تعادل انرژی سطحی است. این دما، دمای بالاترین لایه سطحی را نشان میدهد که ظرفیت گرمایی ندارد و بنابراین میتواند فوراً به تغییرات شارهای سطحی پاسخ دهد. دمای پوست در خشکی و دریا به طور متفاوتی محاسبه میشود. |
soil_temperature_level_1 | ک | ۱۱۱۳۲ متر | Temperature of the soil in layer 1 (0 - 7 cm) of the ECMWF Integrated Forecasting System. The surface is at 0 cm. Soil temperature is set at the middle of each layer, and heat transfer is calculated at the interfaces between them. It is assumed that there is no heat transfer out of the bottom of the lowest layer. |
soil_temperature_level_2 | ک | ۱۱۱۳۲ متر | Temperature of the soil in layer 2 (7-28 cm) of the ECMWF Integrated Forecasting System. |
soil_temperature_level_3 | ک | ۱۱۱۳۲ متر | Temperature of the soil in layer 3 (28-100 cm) of the ECMWF Integrated Forecasting System. |
soil_temperature_level_4 | ک | ۱۱۱۳۲ متر | Temperature of the soil in layer 4 (100-289 cm) of the ECMWF Integrated Forecasting System. |
lake_bottom_temperature | ک | ۱۱۱۳۲ متر | Temperature of water at the bottom of inland water bodies (lakes, reservoirs, rivers) and coastal waters. ECMWF implemented a lake model in May 2015 to represent the water temperature and lake ice of all the world's major inland water bodies in the Integrated Forecasting System. The model keeps lake depth and surface area (or fractional cover) constant in time. |
lake_ice_depth | متر | ۱۱۱۳۲ متر | The thickness of ice on inland water bodies (lakes, reservoirs and rivers) and coastal waters. The ECMWF Integrated Forecasting System (IFS) represents the formation and melting of ice on inland water bodies (lakes, reservoirs and rivers) and coastal water. A single ice layer is represented. This parameter is the thickness of that ice layer. |
lake_ice_temperature | ک | ۱۱۱۳۲ متر | The temperature of the uppermost surface of ice on inland water bodies (lakes, reservoirs, rivers) and coastal waters. The ECMWF Integrated Forecasting System represents the formation and melting of ice on lakes. A single ice layer is represented. |
lake_mix_layer_depth | متر | ۱۱۱۳۲ متر | The thickness of the upper most layer of an inland water body (lake, reservoirs, and rivers) or coastal waters that is well mixed and has a near constant temperature with depth (uniform distribution of temperature). The ECMWF Integrated Forecasting System represents inland water bodies with two layers in the vertical, the mixed layer above and the thermocline below. Thermoclines upper boundary is located at the mixed layer bottom, and the lower boundary at the lake bottom. Mixing within the mixed layer can occur when the density of the surface (and near-surface) water is greater than that of the water below. Mixing can also occur through the action of wind on the surface of the lake. |
lake_mix_layer_temperature | ک | ۱۱۱۳۲ متر | The temperature of the upper most layer of inland water bodies (lakes, reservoirs and rivers) or coastal waters) that is well mixed. The ECMWF Integrated Forecasting System represents inland water bodies with two layers in the vertical, the mixed layer above and the thermocline below. Thermoclines upper boundary is located at the mixed layer bottom, and the lower boundary at the lake bottom. Mixing within the mixed layer can occur when the density of the surface (and near-surface) water is greater than that of the water below. Mixing can also occur through the action of wind on the surface of the lake. |
lake_shape_factor | ۱۱۱۳۲ متر | This parameter describes the way that temperature changes with depth in the thermocline layer of inland water bodies (lakes, reservoirs and rivers) and coastal waters. It is used to calculate the lake bottom temperature and other lake-related parameters. The ECMWF Integrated Forecasting System represents inland and coastal water bodies with two layers in the vertical, the mixed layer above and the thermocline below where temperature changes with depth. | |
lake_total_layer_temperature | ک | ۱۱۱۳۲ متر | The mean temperature of total water column in inland water bodies (lakes, reservoirs and rivers) and coastal waters. The ECMWF Integrated Forecasting System represents inland water bodies with two layers in the vertical, the mixed layer above and the thermocline below where temperature changes with depth. This parameter is the mean over the two layers. |
snow_albedo | ۱۱۱۳۲ متر | It is defined as the fraction of solar (shortwave) radiation reflected by the snow, across the solar spectrum, for both direct and diffuse radiation. It is a measure of the reflectivity of the snow covered grid cells. Values vary between 0 and 1. Typically, snow and ice have high reflectivity with albedo values of 0.8 and above. | |
snow_cover | ۱۱۱۳۲ متر | It represents the fraction (0-1) of the cell / grid-box occupied by snow (similar to the cloud cover fields of ERA5). | |
snow_density | kg/m^3 | ۱۱۱۳۲ متر | Mass of snow per cubic meter in the snow layer. The ECMWF Integrated Forecast System (IFS) model represents snow as a single additional layer over the uppermost soil level. The snow may cover all or part of the grid box. |
snow_depth | متر | ۱۱۱۳۲ متر | Instantaneous grid-box average of the snow thickness on the ground (excluding snow on canopy). |
snow_depth_water_equivalent | m of water equivalent | ۱۱۱۳۲ متر | Depth of snow from the snow-covered area of a grid box. Its units are meters of water equivalent, so it is the depth the water would have if the snow melted and was spread evenly over the whole grid box. The ECMWF Integrated Forecast System represents snow as a single additional layer over the uppermost soil level. The snow may cover all or part of the grid box. |
snowfall | m of water equivalent | ۱۱۱۳۲ متر | Accumulated total snow that has fallen to the Earth's surface. It consists of snow due to the large-scale atmospheric flow (horizontal scales greater than around a few hundred meters) and convection where smaller scale areas (around 5km to a few hundred kilometers) of warm air rise. If snow has melted during the period over which this variable was accumulated, then it will be higher than the snow depth. This variable is the total amount of water accumulated from the beginning of the forecast time to the end of the forecast step. The units given measure the depth the water would have if the snow melted and was spread evenly over the grid box. Care should be taken when comparing model variables with observations, because observations are often local to a particular point in space and time, rather than representing averages over a model grid box and model time step. |
snowmelt | m of water equivalent | ۱۱۱۳۲ متر | Melting of snow averaged over the grid box (to find melt over snow, divide by snow fraction). This variable is accumulated from the beginning of the forecast time to the end of the forecast step. |
temperature_of_snow_layer | ک | ۱۱۱۳۲ متر | This variable gives the temperature of the snow layer from the ground to the snow-air interface. The ECMWF Integrated Forecast System (IFS) model represents snow as a single additional layer over the uppermost soil level. The snow may cover all or part of the grid box. |
skin_reservoir_content | m of water equivalent | ۱۱۱۳۲ متر | Amount of water in the vegetation canopy and/or in a thin layer on the soil. It represents the amount of rain intercepted by foliage, and water from dew. The maximum amount of 'skin reservoir content' a grid box can hold depends on the type of vegetation, and may be zero. Water leaves the 'skin reservoir' by evaporation. |
volumetric_soil_water_layer_1 | کسر حجمی | ۱۱۱۳۲ متر | Volume of water in soil layer 1 (0 - 7 cm) of the ECMWF Integrated Forecasting System. The surface is at 0 cm. The volumetric soil water is associated with the soil texture (or classification), soil depth, and the underlying groundwater level. |
volumetric_soil_water_layer_2 | کسر حجمی | ۱۱۱۳۲ متر | Volume of water in soil layer 2 (7 -28 cm) of the ECMWF Integrated Forecasting System. |
volumetric_soil_water_layer_3 | کسر حجمی | ۱۱۱۳۲ متر | Volume of water in soil layer 3 (28-100 cm) of the ECMWF Integrated Forecasting System. |
volumetric_soil_water_layer_4 | کسر حجمی | ۱۱۱۳۲ متر | Volume of water in soil layer 4 (100-289 cm) of the ECMWF Integrated Forecasting System. |
forecast_albedo | ۱۱۱۳۲ متر | Is a measure of the reflectivity of the Earth's surface. It is the fraction of solar (shortwave) radiation reflected by Earth's surface, across the solar spectrum, for both direct and diffuse radiation. Values are between 0 and 1. Typically, snow and ice have high reflectivity with albedo values of 0.8 and above, land has intermediate values between about 0.1 and 0.4 and the ocean has low values of 0.1 or less. Radiation from the Sun (solar, or shortwave, radiation) is partly reflected back to space by clouds and particles in the atmosphere (aerosols) and some of it is absorbed. The rest is incident on the Earth's surface, where some of it is reflected. The portion that is reflected by the Earth's surface depends on the albedo. In the ECMWF Integrated Forecasting System (IFS), a climatological background albedo (observed values averaged over a period of several years) is used, modified by the model over water, ice and snow. Albedo is often shown as a percentage (%). | |
surface_latent_heat_flux | ژول بر متر مربع | ۱۱۱۳۲ متر | Exchange of latent heat with the surface through turbulent diffusion. This variables is accumulated from the beginning of the forecast time to the end of the forecast step. By model convention, downward fluxes are positive. |
surface_net_solar_radiation | ژول بر متر مربع | ۱۱۱۳۲ متر | Amount of solar radiation (also known as shortwave radiation) reaching the surface of the Earth (both direct and diffuse) minus the amount reflected by the Earth's surface (which is governed by the albedo). Radiation from the Sun (solar, or shortwave, radiation) is partly reflected back to space by clouds and particles in the atmosphere (aerosols) and some of it is absorbed. The rest is incident on the Earth's surface, where some of it is reflected. The difference between downward and reflected solar radiation is the surface net solar radiation. This variable is accumulated from the beginning of the forecast time to the end of the forecast step. The units are joules per square meter (J m-2). To convert to watts per square meter (W m-2), the accumulated values should be divided by the accumulation period expressed in seconds. The ECMWF convention for vertical fluxes is positive downwards. |
surface_net_thermal_radiation | ژول بر متر مربع | ۱۱۱۳۲ متر | Net thermal radiation at the surface. Accumulated field from the beginning of the forecast time to the end of the forecast step. By model convention downward fluxes are positive. |
surface_sensible_heat_flux | ژول بر متر مربع | ۱۱۱۳۲ متر | Transfer of heat between the Earth's surface and the atmosphere through the effects of turbulent air motion (but excluding any heat transfer resulting from condensation or evaporation). The magnitude of the sensible heat flux is governed by the difference in temperature between the surface and the overlying atmosphere, wind speed and the surface roughness. For example, cold air overlying a warm surface would produce a sensible heat flux from the land (or ocean) into the atmosphere. This is a single level variable and it is accumulated from the beginning of the forecast time to the end of the forecast step. The units are joules per square meter (J m-2). To convert to watts per square meter (W m-2), the accumulated values should be divided by the accumulation period expressed in seconds. The ECMWF convention for vertical fluxes is positive downwards. |
surface_solar_radiation_downwards | ژول بر متر مربع | ۱۱۱۳۲ متر | Amount of solar radiation (also known as shortwave radiation) reaching the surface of the Earth. This variable comprises both direct and diffuse solar radiation. Radiation from the Sun (solar, or shortwave, radiation) is partly reflected back to space by clouds and particles in the atmosphere (aerosols) and some of it is absorbed. The rest is incident on the Earth's surface (represented by this variable). To a reasonably good approximation, this variable is the model equivalent of what would be measured by a pyranometer (an instrument used for measuring solar radiation) at the surface. However, care should be taken when comparing model variables with observations, because observations are often local to a particular point in space and time, rather than representing averages over a model grid box and model time step. This variable is accumulated from the beginning of the forecast time to the end of the forecast step. The units are joules per square meter (J m-2). To convert to watts per square meter (W m-2), the accumulated values should be divided by the accumulation period expressed in seconds. The ECMWF convention for vertical fluxes is positive downwards. |
surface_thermal_radiation_downwards | ژول بر متر مربع | ۱۱۱۳۲ متر | Amount of thermal (also known as longwave or terrestrial) radiation emitted by the atmosphere and clouds that reaches the Earth's surface. The surface of the Earth emits thermal radiation, some of which is absorbed by the atmosphere and clouds. The atmosphere and clouds likewise emit thermal radiation in all directions, some of which reaches the surface (represented by this variable). This variable is accumulated from the beginning of the forecast time to the end of the forecast step. The units are joules per square meter (J m-2). To convert to watts per square meter (W m-2), the accumulated values should be divided by the accumulation period expressed in seconds. The ECMWF convention for vertical fluxes is positive downwards. |
evaporation_from_bare_soil | m of water equivalent | ۱۱۱۳۲ متر | The amount of evaporation from bare soil at the top of the land surface. This variable is accumulated from the beginning of the forecast time to the end of the forecast step. |
evaporation_from_open_water_surfaces_excluding_oceans | m of water equivalent | ۱۱۱۳۲ متر | Amount of evaporation from surface water storage like lakes and inundated areas but excluding oceans. This variable is accumulated from the beginning of the forecast time to the end of the forecast step. |
evaporation_from_the_top_of_canopy | m of water equivalent | ۱۱۱۳۲ متر | The amount of evaporation from the canopy interception reservoir at the top of the canopy. This variable is accumulated from the beginning of the forecast time to the end of the forecast step. |
evaporation_from_vegetation_transpiration | m of water equivalent | ۱۱۱۳۲ متر | Amount of evaporation from vegetation transpiration. This has the same meaning as root extraction ie the amount of water extracted from the different soil layers. This variable is accumulated from the beginning of the forecast time to the end of the forecast step. |
potential_evaporation | متر | ۱۱۱۳۲ متر | Potential evaporation (pev) in the current ECMWF model is computed, by making a second call to the surface energy balance routine with the vegetation variables set to "crops/mixed farming" and assuming no stress from soil moisture. In other words, evaporation is computed for agricultural land as if it is well watered and assuming that the atmosphere is not affected by this artificial surface condition. The latter may not always be realistic. Although pev is meant to provide an estimate of irrigation requirements, the method can give unrealistic results in arid conditions due to too strong evaporation forced by dry air. This variable is accumulated from the beginning of the forecast time to the end of the forecast step. |
runoff | متر | ۱۱۱۳۲ متر | Some water from rainfall, melting snow, or deep in the soil, stays stored in the soil. Otherwise, the water drains away, either over the surface (surface runoff), or under the ground (sub-surface runoff) and the sum of these two is simply called 'runoff'. This variable is the total amount of water accumulated from the beginning of the forecast time to the end of the forecast step. The units of runoff are depth in meters. This is the depth the water would have if it were spread evenly over the grid box. Care should be taken when comparing model variables with observations, because observations are often local to a particular point rather than averaged over a grid square area. Observations are also often taken in different units, such as mm/day, rather than the accumulated meters produced here. Runoff is a measure of the availability of water in the soil, and can, for example, be used as an indicator of drought or flood. More information about how runoff is calculated is given in the IFS Physical Processes documentation. |
snow_evaporation | m of water equivalent | ۱۱۱۳۲ متر | Evaporation from snow averaged over the grid box (to find flux over snow, divide by snow fraction). This variable is accumulated from the beginning of the forecast time to the end of the forecast step. |
sub_surface_runoff | متر | ۱۱۱۳۲ متر | Some water from rainfall, melting snow, or deep in the soil, stays stored in the soil. Otherwise, the water drains away, either over the surface (surface runoff), or under the ground(sub-surface runoff) and the sum of these two is simply called 'runoff'. This variable is accumulated from the beginning of the forecast time to the end of the forecast step. The units of runoff are depth in meters. This is the depth the water would have if it were spread evenly over the grid box. Care should be taken when comparing model variables with observations, because observations are often local to a particular point rather than averaged over a grid square area. Observations are also often taken in different units, such as mm/day, rather than the accumulated meters produced here. Runoff is a measure of the availability of water in the soil, and can, for example, be used as an indicator of drought or flood. More information about how runoff is calculated is given in the IFS Physical Processes documentation. |
surface_runoff | متر | ۱۱۱۳۲ متر | Some water from rainfall, melting snow, or deep in the soil, stays stored in the soil. Otherwise, the water drains away, either over the surface (surface runoff), or under the ground (sub-surface runoff) and the sum of these two is simply called 'runoff'. This variable is the total amount of water accumulated from the beginning of the forecast time to the end of the forecast step. The units of runoff are depth in meters. This is the depth the water would have if it were spread evenly over the grid box. Care should be taken when comparing model variables with observations, because observations are often local to a particular point rather than averaged over a grid square area. Observations are also often taken in different units, such as mm/day, rather than the accumulated meters produced here. Runoff is a measure of the availability of water in the soil, and can, for example, be used as an indicator of drought or flood. More information about how runoff is calculated is given in the IFS Physical Processes documentation. |
total_evaporation | m of water equivalent | ۱۱۱۳۲ متر | Accumulated amount of water that has evaporated from the Earth's surface, including a simplified representation of transpiration (from vegetation), into vapor in the air above. This variable is accumulated from the beginning of the forecast to the end of the forecast step. The ECMWF Integrated Forecasting System convention is that downward fluxes are positive. Therefore, negative values indicate evaporation and positive values indicate condensation. |
u_component_of_wind_10m | اماس | ۱۱۱۳۲ متر | Eastward component of the 10m wind. It is the horizontal speed of air moving towards the east, at a height of ten meters above the surface of the Earth, in meters per second. Care should be taken when comparing this variable with observations, because wind observations vary on small space and time scales and are affected by the local terrain, vegetation and buildings that are represented only on average in the ECMWF Integrated Forecasting System. This variable can be combined with the V component of 10m wind to give the speed and direction of the horizontal 10m wind. |
v_component_of_wind_10m | اماس | ۱۱۱۳۲ متر | Northward component of the 10m wind. It is the horizontal speed of air moving towards the north, at a height of ten meters above the surface of the Earth, in meters per second. Care should be taken when comparing this variable with observations, because wind observations vary on small space and time scales and are affected by the local terrain, vegetation and buildings that are represented only on average in the ECMWF Integrated Forecasting System. This variable can be combined with the U component of 10m wind to give the speed and direction of the horizontal 10m wind. |
surface_pressure | پا | ۱۱۱۳۲ متر | Pressure (force per unit area) of the atmosphere on the surface of land, sea and in-land water. It is a measure of the weight of all the air in a column vertically above the area of the Earth's surface represented at a fixed point. Surface pressure is often used in combination with temperature to calculate air density. The strong variation of pressure with altitude makes it difficult to see the low and high pressure systems over mountainous areas, so mean sea level pressure, rather than surface pressure, is normally used for this purpose. The units of this variable are Pascals (Pa). Surface pressure is often measured in hPa and sometimes is presented in the old units of millibars, mb (1 hPa = 1 mb = 100 Pa). |
total_precipitation | متر | ۱۱۱۳۲ متر | Accumulated liquid and frozen water, including rain and snow, that falls to the Earth's surface. It is the sum of large-scale precipitation (that precipitation which is generated by large-scale weather patterns, such as troughs and cold fronts) and convective precipitation (generated by convection which occurs when air at lower levels in the atmosphere is warmer and less dense than the air above, so it rises). Precipitation variables do not include fog, dew or the precipitation that evaporates in the atmosphere before it lands at the surface of the Earth. This variable is accumulated from the beginning of the forecast time to the end of the forecast step. The units of precipitation are depth in meters. It is the depth the water would have if it were spread evenly over the grid box. Care should be taken when comparing model variables with observations, because observations are often local to a particular point in space and time, rather than representing averages over a model grid box and model time step. |
leaf_area_index_high_vegetation | کسر مساحت | ۱۱۱۳۲ متر | One-half of the total green leaf area per unit horizontal ground surface area for high vegetation type. |
leaf_area_index_low_vegetation | کسر مساحت | ۱۱۱۳۲ متر | One-half of the total green leaf area per unit horizontal ground surface area for low vegetation type. |
snowfall_hourly | m of water equivalent | ۱۱۱۳۲ متر | snowfall disaggregated from the original cumulative values into hourly values |
snowmelt_hourly | m of water equivalent | ۱۱۱۳۲ متر | snowmelt disaggregated from the original cumulative values into hourly values |
surface_latent_heat_flux_hourly | ژول بر متر مربع | ۱۱۱۳۲ متر | surface latent heat flux disaggregated from the original cumulative values into hourly values |
surface_net_solar_radiation_hourly | ژول بر متر مربع | ۱۱۱۳۲ متر | surface net solar radiation disaggregated from the original cumulative values into hourly values |
surface_net_thermal_radiation_hourly | ژول بر متر مربع | ۱۱۱۳۲ متر | surface net thermal radiation disaggregated from the original cumulative values into hourly values |
surface_sensible_heat_flux_hourly | ژول بر متر مربع | ۱۱۱۳۲ متر | surface sensible heat flux disaggregated from the original cumulative values into hourly values |
surface_solar_radiation_downwards_hourly | ژول بر متر مربع | ۱۱۱۳۲ متر | surface solar radiation downwards disaggregated from the original cumulative values into hourly values |
surface_thermal_radiation_downwards_hourly | ژول بر متر مربع | ۱۱۱۳۲ متر | surface thermal radiation downwards disaggregated from the original cumulative values into hourly values |
evaporation_from_bare_soil_hourly | m of water equivalent | ۱۱۱۳۲ متر | evaporation from bare soil disaggregated from the original cumulative values into hourly values |
evaporation_from_open_water_surfaces_excluding_oceans_hourly | m of water equivalent | ۱۱۱۳۲ متر | evaporation from open water surfaces excluding oceans disaggregated from the original cumulative values into hourly values |
evaporation_from_the_top_of_canopy_hourly | m of water equivalent | ۱۱۱۳۲ متر | evaporation from the top of canopy disaggregated from the original cumulative values into hourly values |
evaporation_from_vegetation_transpiration_hourly | m of water equivalent | ۱۱۱۳۲ متر | evaporation from vegetation transpiration disaggregated from the original cumulative values into hourly values |
potential_evaporation_hourly | متر | ۱۱۱۳۲ متر | potential evaporation disaggregated from the original cumulative values into hourly values |
runoff_hourly | متر | ۱۱۱۳۲ متر | runoff disaggregated from the original cumulative values into hourly values |
snow_evaporation_hourly | m of water equivalent | ۱۱۱۳۲ متر | snow evaporation disaggregated from the original cumulative values into hourly values |
sub_surface_runoff_hourly | متر | ۱۱۱۳۲ متر | sub surface runoff disaggregated from the original cumulative values into hourly values |
surface_runoff_hourly | متر | ۱۱۱۳۲ متر | surface runoff disaggregated from the original cumulative values into hourly values |
total_evaporation_hourly | m of water equivalent | ۱۱۱۳۲ متر | total evaporation disaggregated from the original cumulative values into hourly values |
total_precipitation_hourly | متر | 11132 meters | total precipitation disaggregated from the original cumulative values into hourly values |
ویژگیهای تصویر
ویژگیهای تصویر
| نام | نوع | توضیحات |
|---|---|---|
| ساعت | داخلی | ساعت روز |
شرایط استفاده
شرایط استفاده
Please acknowledge the use of ERA5-Land as stated in the Copernicus C3S/CAMS License agreement :
5.1.1 Where the Licensee communicates or distributes Copernicus Products to the public, the Licensee shall inform the recipients of the source by using the following or any similar notice: 'Generated using Copernicus Climate Change Service Information [Year]'.
5.1.2 Where the Licensee makes or contributes to a publication or distribution containing adapted or modified Copernicus Products, the Licensee shall provide the following or any similar notice: 'Contains modified Copernicus Climate Change Service Information [Year]';
Any such publication or distribution covered by clauses 5.1.1 and 5.1.2 shall state that neither the European Commission nor ECMWF is responsible for any use that may be made of the Copernicus Information or Data it contains.
نقل قولها
Muñoz Sabater, J., (2019): ERA5-Land monthly averaged data from 1981 to present. Copernicus Climate Change Service (C3S) Climate Data Store (CDS). (<date of access>), doi:10.24381/cds.68d2bb30
با موتور زمین کاوش کنید
ویرایشگر کد (جاوااسکریپت)
var dataset = ee.ImageCollection('ECMWF/ERA5_LAND/HOURLY')
                .filter(ee.Filter.date('2020-07-01', '2020-07-02'));

var visualization = {
  bands: ['temperature_2m'],
  min: 250.0,
  max: 320.0,
  palette: [
    '000080', '0000d9', '4000ff', '8000ff', '0080ff', '00ffff',
    '00ff80', '80ff00', 'daff00', 'ffff00', 'fff500', 'ffda00',
    'ffb000', 'ffa400', 'ff4f00', 'ff2500', 'ff0a00', 'ff00ff',
  ]
};

Map.setCenter(22.2, 21.2, 0);

Map.addLayer(dataset, visualization, 'Air temperature [K] at 2m height');
import ee
import geemap.core as geemap
کولب (پایتون)
dataset = ee.ImageCollection('ECMWF/ERA5_LAND/HOURLY').filter(
    ee.Filter.date('2020-07-01', '2020-07-02')
)

visualization = {
    'bands': ['temperature_2m'],
    'min': 250.0,
    'max': 320.0,
    'palette': [
        '000080', '0000d9', '4000ff', '8000ff', '0080ff', '00ffff',
        '00ff80', '80ff00', 'daff00', 'ffff00', 'fff500', 'ffda00',
        'ffb000', 'ffa400', 'ff4f00', 'ff2500', 'ff0a00', 'ff00ff',
    ],
}

m = geemap.Map()
m.set_center(22.2, 21.2, 0)
m.add_layer(dataset, visualization, 'Air temperature [K] at 2m height')
m
- در دسترس بودن مجموعه دادهها
- 1950-01-01T01:00:00Z–2026-09-01T23:00:00Z
- تولیدکننده مجموعه داده
- Copernicus Climate Data Store
- کادانس
- ۱ ساعت
- برچسبها
توضیحات
ERA5-Land is a reanalysis dataset providing a consistent view of the evolution of land variables over several decades at an enhanced resolution compared to ERA5. ERA5-Land has been produced by replaying the land component of the ECMWF ERA5 climate reanalysis. Reanalysis combines model data with observations from across the world into a globally complete and consistent dataset using the laws of physics. Reanalysis produces data that goes several decades back in time, providing an accurate description of the climate of the past. This dataset includes all 50 variables as available on CDS.
ERA5-Land data is available from 1950 to three months from real-time.
Please consult the ERA5-Land "Known Issues" section . In particular, note that three components of the total evapotranspiration have values swapped as follows:
- variable "Evaporation from bare soil" (mars parameter code 228101 (evabs)) has the values corresponding to the "Evaporation from vegetation transpiration" (mars parameter 228103 (evavt)),
- variable "Evaporation from open water surfaces excluding oceans (mars parameter code 228102 (evaow)) has the values corresponding to the "Evaporation from bare soil" (mars parameter code 228101 (evabs)),
- variable "Evaporation from vegetation transpiration" (mars parameter code 228103 (evavt)) has the values corresponding to the "Evaporation from open water surfaces excluding oceans" (mars parameter code 228102 (evaow)).
Please note that the convention for accumulations used in ERA5-Land differs with that for ERA5. The accumulations are treated the same as those in ERA-Interim or ERA-Interim/Land, ie, they are accumulated from the beginning of the forecast to the end of the forecast step. This happens within every day and gets reset on midnight. See this page for more information . The Earth Engine Data team added 19 additional bands, one for each of the accumulation bands, with the hourly values computed as the difference between two consecutive forecast steps.
باندها
باندها
اندازه پیکسل: ۱۱۱۳۲ متر (همه باندها)
| نام | واحدها | اندازه پیکسل | توضیحات |
|---|---|---|---|
dewpoint_temperature_2m | ک | ۱۱۱۳۲ متر | Temperature to which the air, at 2 meters above the surface of the Earth, would have to be cooled for saturation to occur. It is a measure of the humidity of the air. Combined with temperature and pressure, it can be used to calculate the relative humidity. 2m dew point temperature is calculated by interpolating between the lowest model level and the Earth's surface, taking account of the atmospheric conditions. |
temperature_2m | ک | 11132 meters | Temperature of air at 2m above the surface of land, sea or in-land waters. 2m temperature is calculated by interpolating between the lowest model level and the Earth's surface, taking account of the atmospheric conditions. |
skin_temperature | ک | 11132 meters | Temperature of the surface of the Earth. The skin temperature is the theoretical temperature that is required to satisfy the surface energy balance. It represents the temperature of the uppermost surface layer, which has no heat capacity and so can respond instantaneously to changes in surface fluxes. Skin temperature is calculated differently over land and sea. |
soil_temperature_level_1 | ک | 11132 meters | Temperature of the soil in layer 1 (0 - 7 cm) of the ECMWF Integrated Forecasting System. The surface is at 0 cm. Soil temperature is set at the middle of each layer, and heat transfer is calculated at the interfaces between them. It is assumed that there is no heat transfer out of the bottom of the lowest layer. |
soil_temperature_level_2 | ک | 11132 meters | Temperature of the soil in layer 2 (7-28 cm) of the ECMWF Integrated Forecasting System. |
soil_temperature_level_3 | ک | 11132 meters | Temperature of the soil in layer 3 (28-100 cm) of the ECMWF Integrated Forecasting System. |
soil_temperature_level_4 | ک | 11132 meters | Temperature of the soil in layer 4 (100-289 cm) of the ECMWF Integrated Forecasting System. |
lake_bottom_temperature | ک | 11132 meters | Temperature of water at the bottom of inland water bodies (lakes, reservoirs, rivers) and coastal waters. ECMWF implemented a lake model in May 2015 to represent the water temperature and lake ice of all the world's major inland water bodies in the Integrated Forecasting System. The model keeps lake depth and surface area (or fractional cover) constant in time. |
lake_ice_depth | متر | 11132 meters | The thickness of ice on inland water bodies (lakes, reservoirs and rivers) and coastal waters. The ECMWF Integrated Forecasting System (IFS) represents the formation and melting of ice on inland water bodies (lakes, reservoirs and rivers) and coastal water. A single ice layer is represented. This parameter is the thickness of that ice layer. |
lake_ice_temperature | ک | 11132 meters | The temperature of the uppermost surface of ice on inland water bodies (lakes, reservoirs, rivers) and coastal waters. The ECMWF Integrated Forecasting System represents the formation and melting of ice on lakes. A single ice layer is represented. |
lake_mix_layer_depth | متر | 11132 meters | The thickness of the upper most layer of an inland water body (lake, reservoirs, and rivers) or coastal waters that is well mixed and has a near constant temperature with depth (uniform distribution of temperature). The ECMWF Integrated Forecasting System represents inland water bodies with two layers in the vertical, the mixed layer above and the thermocline below. Thermoclines upper boundary is located at the mixed layer bottom, and the lower boundary at the lake bottom. Mixing within the mixed layer can occur when the density of the surface (and near-surface) water is greater than that of the water below. Mixing can also occur through the action of wind on the surface of the lake. |
lake_mix_layer_temperature | ک | 11132 meters | The temperature of the upper most layer of inland water bodies (lakes, reservoirs and rivers) or coastal waters) that is well mixed. The ECMWF Integrated Forecasting System represents inland water bodies with two layers in the vertical, the mixed layer above and the thermocline below. Thermoclines upper boundary is located at the mixed layer bottom, and the lower boundary at the lake bottom. Mixing within the mixed layer can occur when the density of the surface (and near-surface) water is greater than that of the water below. Mixing can also occur through the action of wind on the surface of the lake. |
lake_shape_factor | 11132 meters | This parameter describes the way that temperature changes with depth in the thermocline layer of inland water bodies (lakes, reservoirs and rivers) and coastal waters. It is used to calculate the lake bottom temperature and other lake-related parameters. The ECMWF Integrated Forecasting System represents inland and coastal water bodies with two layers in the vertical, the mixed layer above and the thermocline below where temperature changes with depth. | |
lake_total_layer_temperature | ک | 11132 meters | The mean temperature of total water column in inland water bodies (lakes, reservoirs and rivers) and coastal waters. The ECMWF Integrated Forecasting System represents inland water bodies with two layers in the vertical, the mixed layer above and the thermocline below where temperature changes with depth. This parameter is the mean over the two layers. |
snow_albedo | 11132 meters | It is defined as the fraction of solar (shortwave) radiation reflected by the snow, across the solar spectrum, for both direct and diffuse radiation. It is a measure of the reflectivity of the snow covered grid cells. Values vary between 0 and 1. Typically, snow and ice have high reflectivity with albedo values of 0.8 and above. | |
snow_cover | 11132 meters | It represents the fraction (0-1) of the cell / grid-box occupied by snow (similar to the cloud cover fields of ERA5). | |
snow_density | kg/m^3 | ۱۱۱۳۲ متر | Mass of snow per cubic meter in the snow layer. The ECMWF Integrated Forecast System (IFS) model represents snow as a single additional layer over the uppermost soil level. The snow may cover all or part of the grid box. |
snow_depth | متر | 11132 meters | Instantaneous grid-box average of the snow thickness on the ground (excluding snow on canopy). |
snow_depth_water_equivalent | m of water equivalent | 11132 meters | Depth of snow from the snow-covered area of a grid box. Its units are meters of water equivalent, so it is the depth the water would have if the snow melted and was spread evenly over the whole grid box. The ECMWF Integrated Forecast System represents snow as a single additional layer over the uppermost soil level. The snow may cover all or part of the grid box. |
snowfall | m of water equivalent | 11132 meters | Accumulated total snow that has fallen to the Earth's surface. It consists of snow due to the large-scale atmospheric flow (horizontal scales greater than around a few hundred meters) and convection where smaller scale areas (around 5km to a few hundred kilometers) of warm air rise. If snow has melted during the period over which this variable was accumulated, then it will be higher than the snow depth. This variable is the total amount of water accumulated from the beginning of the forecast time to the end of the forecast step. The units given measure the depth the water would have if the snow melted and was spread evenly over the grid box. Care should be taken when comparing model variables with observations, because observations are often local to a particular point in space and time, rather than representing averages over a model grid box and model time step. |
snowmelt | m of water equivalent | 11132 meters | Melting of snow averaged over the grid box (to find melt over snow, divide by snow fraction). This variable is accumulated from the beginning of the forecast time to the end of the forecast step. |
temperature_of_snow_layer | ک | 11132 meters | This variable gives the temperature of the snow layer from the ground to the snow-air interface. The ECMWF Integrated Forecast System (IFS) model represents snow as a single additional layer over the uppermost soil level. The snow may cover all or part of the grid box. |
skin_reservoir_content | m of water equivalent | 11132 meters | Amount of water in the vegetation canopy and/or in a thin layer on the soil. It represents the amount of rain intercepted by foliage, and water from dew. The maximum amount of 'skin reservoir content' a grid box can hold depends on the type of vegetation, and may be zero. Water leaves the 'skin reservoir' by evaporation. |
volumetric_soil_water_layer_1 | کسر حجمی | 11132 meters | Volume of water in soil layer 1 (0 - 7 cm) of the ECMWF Integrated Forecasting System. The surface is at 0 cm. The volumetric soil water is associated with the soil texture (or classification), soil depth, and the underlying groundwater level. |
volumetric_soil_water_layer_2 | کسر حجمی | 11132 meters | Volume of water in soil layer 2 (7 -28 cm) of the ECMWF Integrated Forecasting System. |
volumetric_soil_water_layer_3 | کسر حجمی | 11132 meters | Volume of water in soil layer 3 (28-100 cm) of the ECMWF Integrated Forecasting System. |
volumetric_soil_water_layer_4 | کسر حجمی | 11132 meters | Volume of water in soil layer 4 (100-289 cm) of the ECMWF Integrated Forecasting System. |
forecast_albedo | 11132 meters | Is a measure of the reflectivity of the Earth's surface. It is the fraction of solar (shortwave) radiation reflected by Earth's surface, across the solar spectrum, for both direct and diffuse radiation. Values are between 0 and 1. Typically, snow and ice have high reflectivity with albedo values of 0.8 and above, land has intermediate values between about 0.1 and 0.4 and the ocean has low values of 0.1 or less. Radiation from the Sun (solar, or shortwave, radiation) is partly reflected back to space by clouds and particles in the atmosphere (aerosols) and some of it is absorbed. The rest is incident on the Earth's surface, where some of it is reflected. The portion that is reflected by the Earth's surface depends on the albedo. In the ECMWF Integrated Forecasting System (IFS), a climatological background albedo (observed values averaged over a period of several years) is used, modified by the model over water, ice and snow. Albedo is often shown as a percentage (%). | |
surface_latent_heat_flux | ژول بر متر مربع | 11132 meters | Exchange of latent heat with the surface through turbulent diffusion. This variables is accumulated from the beginning of the forecast time to the end of the forecast step. By model convention, downward fluxes are positive. |
surface_net_solar_radiation | ژول بر متر مربع | 11132 meters | Amount of solar radiation (also known as shortwave radiation) reaching the surface of the Earth (both direct and diffuse) minus the amount reflected by the Earth's surface (which is governed by the albedo). Radiation from the Sun (solar, or shortwave, radiation) is partly reflected back to space by clouds and particles in the atmosphere (aerosols) and some of it is absorbed. The rest is incident on the Earth's surface, where some of it is reflected. The difference between downward and reflected solar radiation is the surface net solar radiation. This variable is accumulated from the beginning of the forecast time to the end of the forecast step. The units are joules per square meter (J m-2). To convert to watts per square meter (W m-2), the accumulated values should be divided by the accumulation period expressed in seconds. The ECMWF convention for vertical fluxes is positive downwards. |
surface_net_thermal_radiation | ژول بر متر مربع | 11132 meters | Net thermal radiation at the surface. Accumulated field from the beginning of the forecast time to the end of the forecast step. By model convention downward fluxes are positive. |
surface_sensible_heat_flux | ژول بر متر مربع | 11132 meters | Transfer of heat between the Earth's surface and the atmosphere through the effects of turbulent air motion (but excluding any heat transfer resulting from condensation or evaporation). The magnitude of the sensible heat flux is governed by the difference in temperature between the surface and the overlying atmosphere, wind speed and the surface roughness. For example, cold air overlying a warm surface would produce a sensible heat flux from the land (or ocean) into the atmosphere. This is a single level variable and it is accumulated from the beginning of the forecast time to the end of the forecast step. The units are joules per square meter (J m-2). To convert to watts per square meter (W m-2), the accumulated values should be divided by the accumulation period expressed in seconds. The ECMWF convention for vertical fluxes is positive downwards. |
surface_solar_radiation_downwards | ژول بر متر مربع | 11132 meters | Amount of solar radiation (also known as shortwave radiation) reaching the surface of the Earth. This variable comprises both direct and diffuse solar radiation. Radiation from the Sun (solar, or shortwave, radiation) is partly reflected back to space by clouds and particles in the atmosphere (aerosols) and some of it is absorbed. The rest is incident on the Earth's surface (represented by this variable). To a reasonably good approximation, this variable is the model equivalent of what would be measured by a pyranometer (an instrument used for measuring solar radiation) at the surface. However, care should be taken when comparing model variables with observations, because observations are often local to a particular point in space and time, rather than representing averages over a model grid box and model time step. This variable is accumulated from the beginning of the forecast time to the end of the forecast step. The units are joules per square meter (J m-2). To convert to watts per square meter (W m-2), the accumulated values should be divided by the accumulation period expressed in seconds. The ECMWF convention for vertical fluxes is positive downwards. |
surface_thermal_radiation_downwards | ژول بر متر مربع | 11132 meters | Amount of thermal (also known as longwave or terrestrial) radiation emitted by the atmosphere and clouds that reaches the Earth's surface. The surface of the Earth emits thermal radiation, some of which is absorbed by the atmosphere and clouds. The atmosphere and clouds likewise emit thermal radiation in all directions, some of which reaches the surface (represented by this variable). This variable is accumulated from the beginning of the forecast time to the end of the forecast step. The units are joules per square meter (J m-2). To convert to watts per square meter (W m-2), the accumulated values should be divided by the accumulation period expressed in seconds. The ECMWF convention for vertical fluxes is positive downwards. |
evaporation_from_bare_soil | m of water equivalent | 11132 meters | The amount of evaporation from bare soil at the top of the land surface. This variable is accumulated from the beginning of the forecast time to the end of the forecast step. |
evaporation_from_open_water_surfaces_excluding_oceans | m of water equivalent | 11132 meters | Amount of evaporation from surface water storage like lakes and inundated areas but excluding oceans. This variable is accumulated from the beginning of the forecast time to the end of the forecast step. |
evaporation_from_the_top_of_canopy | m of water equivalent | 11132 meters | The amount of evaporation from the canopy interception reservoir at the top of the canopy. This variable is accumulated from the beginning of the forecast time to the end of the forecast step. |
evaporation_from_vegetation_transpiration | m of water equivalent | ۱۱۱۳۲ متر | Amount of evaporation from vegetation transpiration. This has the same meaning as root extraction ie the amount of water extracted from the different soil layers. This variable is accumulated from the beginning of the forecast time to the end of the forecast step. |
potential_evaporation | متر | 11132 meters | Potential evaporation (pev) in the current ECMWF model is computed, by making a second call to the surface energy balance routine with the vegetation variables set to "crops/mixed farming" and assuming no stress from soil moisture. In other words, evaporation is computed for agricultural land as if it is well watered and assuming that the atmosphere is not affected by this artificial surface condition. The latter may not always be realistic. Although pev is meant to provide an estimate of irrigation requirements, the method can give unrealistic results in arid conditions due to too strong evaporation forced by dry air. This variable is accumulated from the beginning of the forecast time to the end of the forecast step. |
runoff | متر | 11132 meters | Some water from rainfall, melting snow, or deep in the soil, stays stored in the soil. Otherwise, the water drains away, either over the surface (surface runoff), or under the ground (sub-surface runoff) and the sum of these two is simply called 'runoff'. This variable is the total amount of water accumulated from the beginning of the forecast time to the end of the forecast step. The units of runoff are depth in meters. This is the depth the water would have if it were spread evenly over the grid box. Care should be taken when comparing model variables with observations, because observations are often local to a particular point rather than averaged over a grid square area. Observations are also often taken in different units, such as mm/day, rather than the accumulated meters produced here. Runoff is a measure of the availability of water in the soil, and can, for example, be used as an indicator of drought or flood. More information about how runoff is calculated is given in the IFS Physical Processes documentation. |
snow_evaporation | m of water equivalent | 11132 meters | Evaporation from snow averaged over the grid box (to find flux over snow, divide by snow fraction). This variable is accumulated from the beginning of the forecast time to the end of the forecast step. |
sub_surface_runoff | متر | 11132 meters | Some water from rainfall, melting snow, or deep in the soil, stays stored in the soil. Otherwise, the water drains away, either over the surface (surface runoff), or under the ground(sub-surface runoff) and the sum of these two is simply called 'runoff'. This variable is accumulated from the beginning of the forecast time to the end of the forecast step. The units of runoff are depth in meters. This is the depth the water would have if it were spread evenly over the grid box. Care should be taken when comparing model variables with observations, because observations are often local to a particular point rather than averaged over a grid square area. Observations are also often taken in different units, such as mm/day, rather than the accumulated meters produced here. Runoff is a measure of the availability of water in the soil, and can, for example, be used as an indicator of drought or flood. More information about how runoff is calculated is given in the IFS Physical Processes documentation. |
surface_runoff | متر | 11132 meters | Some water from rainfall, melting snow, or deep in the soil, stays stored in the soil. Otherwise, the water drains away, either over the surface (surface runoff), or under the ground (sub-surface runoff) and the sum of these two is simply called 'runoff'. This variable is the total amount of water accumulated from the beginning of the forecast time to the end of the forecast step. The units of runoff are depth in meters. This is the depth the water would have if it were spread evenly over the grid box. Care should be taken when comparing model variables with observations, because observations are often local to a particular point rather than averaged over a grid square area. Observations are also often taken in different units, such as mm/day, rather than the accumulated meters produced here. Runoff is a measure of the availability of water in the soil, and can, for example, be used as an indicator of drought or flood. More information about how runoff is calculated is given in the IFS Physical Processes documentation. |
total_evaporation | m of water equivalent | 11132 meters | Accumulated amount of water that has evaporated from the Earth's surface, including a simplified representation of transpiration (from vegetation), into vapor in the air above. This variable is accumulated from the beginning of the forecast to the end of the forecast step. The ECMWF Integrated Forecasting System convention is that downward fluxes are positive. Therefore, negative values indicate evaporation and positive values indicate condensation. |
u_component_of_wind_10m | اماس | 11132 meters | Eastward component of the 10m wind. It is the horizontal speed of air moving towards the east, at a height of ten meters above the surface of the Earth, in meters per second. Care should be taken when comparing this variable with observations, because wind observations vary on small space and time scales and are affected by the local terrain, vegetation and buildings that are represented only on average in the ECMWF Integrated Forecasting System. This variable can be combined with the V component of 10m wind to give the speed and direction of the horizontal 10m wind. |
v_component_of_wind_10m | اماس | 11132 meters | Northward component of the 10m wind. It is the horizontal speed of air moving towards the north, at a height of ten meters above the surface of the Earth, in meters per second. Care should be taken when comparing this variable with observations, because wind observations vary on small space and time scales and are affected by the local terrain, vegetation and buildings that are represented only on average in the ECMWF Integrated Forecasting System. This variable can be combined with the U component of 10m wind to give the speed and direction of the horizontal 10m wind. |
surface_pressure | پا | 11132 meters | Pressure (force per unit area) of the atmosphere on the surface of land, sea and in-land water. It is a measure of the weight of all the air in a column vertically above the area of the Earth's surface represented at a fixed point. Surface pressure is often used in combination with temperature to calculate air density. The strong variation of pressure with altitude makes it difficult to see the low and high pressure systems over mountainous areas, so mean sea level pressure, rather than surface pressure, is normally used for this purpose. The units of this variable are Pascals (Pa). Surface pressure is often measured in hPa and sometimes is presented in the old units of millibars, mb (1 hPa = 1 mb = 100 Pa). |
total_precipitation | متر | 11132 meters | Accumulated liquid and frozen water, including rain and snow, that falls to the Earth's surface. It is the sum of large-scale precipitation (that precipitation which is generated by large-scale weather patterns, such as troughs and cold fronts) and convective precipitation (generated by convection which occurs when air at lower levels in the atmosphere is warmer and less dense than the air above, so it rises). Precipitation variables do not include fog, dew or the precipitation that evaporates in the atmosphere before it lands at the surface of the Earth. This variable is accumulated from the beginning of the forecast time to the end of the forecast step. The units of precipitation are depth in meters. It is the depth the water would have if it were spread evenly over the grid box. Care should be taken when comparing model variables with observations, because observations are often local to a particular point in space and time, rather than representing averages over a model grid box and model time step. |
leaf_area_index_high_vegetation | کسر مساحت | 11132 meters | One-half of the total green leaf area per unit horizontal ground surface area for high vegetation type. |
leaf_area_index_low_vegetation | کسر مساحت | 11132 meters | One-half of the total green leaf area per unit horizontal ground surface area for low vegetation type. |
snowfall_hourly | m of water equivalent | 11132 meters | snowfall disaggregated from the original cumulative values into hourly values |
snowmelt_hourly | m of water equivalent | 11132 meters | snowmelt disaggregated from the original cumulative values into hourly values |
surface_latent_heat_flux_hourly | ژول بر متر مربع | 11132 meters | surface latent heat flux disaggregated from the original cumulative values into hourly values |
surface_net_solar_radiation_hourly | ژول بر متر مربع | 11132 meters | surface net solar radiation disaggregated from the original cumulative values into hourly values |
surface_net_thermal_radiation_hourly | ژول بر متر مربع | 11132 meters | surface net thermal radiation disaggregated from the original cumulative values into hourly values |
surface_sensible_heat_flux_hourly | ژول بر متر مربع | ۱۱۱۳۲ متر | surface sensible heat flux disaggregated from the original cumulative values into hourly values |
surface_solar_radiation_downwards_hourly | ژول بر متر مربع | 11132 meters | surface solar radiation downwards disaggregated from the original cumulative values into hourly values |
surface_thermal_radiation_downwards_hourly | ژول بر متر مربع | 11132 meters | surface thermal radiation downwards disaggregated from the original cumulative values into hourly values |
evaporation_from_bare_soil_hourly | m of water equivalent | 11132 meters | evaporation from bare soil disaggregated from the original cumulative values into hourly values |
evaporation_from_open_water_surfaces_excluding_oceans_hourly | m of water equivalent | 11132 meters | evaporation from open water surfaces excluding oceans disaggregated from the original cumulative values into hourly values |
evaporation_from_the_top_of_canopy_hourly | m of water equivalent | 11132 meters | evaporation from the top of canopy disaggregated from the original cumulative values into hourly values |
evaporation_from_vegetation_transpiration_hourly | m of water equivalent | 11132 meters | evaporation from vegetation transpiration disaggregated from the original cumulative values into hourly values |
potential_evaporation_hourly | متر | 11132 meters | potential evaporation disaggregated from the original cumulative values into hourly values |
runoff_hourly | متر | 11132 meters | runoff disaggregated from the original cumulative values into hourly values |
snow_evaporation_hourly | m of water equivalent | 11132 meters | snow evaporation disaggregated from the original cumulative values into hourly values |
sub_surface_runoff_hourly | متر | 11132 meters | sub surface runoff disaggregated from the original cumulative values into hourly values |
surface_runoff_hourly | متر | 11132 meters | surface runoff disaggregated from the original cumulative values into hourly values |
total_evaporation_hourly | m of water equivalent | 11132 meters | total evaporation disaggregated from the original cumulative values into hourly values |
total_precipitation_hourly | متر | 11132 meters | total precipitation disaggregated from the original cumulative values into hourly values |
ویژگیهای تصویر
ویژگیهای تصویر
| نام | نوع | توضیحات |
|---|---|---|
| ساعت | داخلی | ساعت روز |
شرایط استفاده
شرایط استفاده
Please acknowledge the use of ERA5-Land as stated in the Copernicus C3S/CAMS License agreement :
5.1.1 Where the Licensee communicates or distributes Copernicus Products to the public, the Licensee shall inform the recipients of the source by using the following or any similar notice: 'Generated using Copernicus Climate Change Service Information [Year]'.
5.1.2 Where the Licensee makes or contributes to a publication or distribution containing adapted or modified Copernicus Products, the Licensee shall provide the following or any similar notice: 'Contains modified Copernicus Climate Change Service Information [Year]';
Any such publication or distribution covered by clauses 5.1.1 and 5.1.2 shall state that neither the European Commission nor ECMWF is responsible for any use that may be made of the Copernicus Information or Data it contains.
نقل قولها
Muñoz Sabater, J., (2019): ERA5-Land monthly averaged data from 1981 to present. Copernicus Climate Change Service (C3S) Climate Data Store (CDS). (<date of access>), doi:10.24381/cds.68d2bb30
با موتور زمین کاوش کنید
ویرایشگر کد (جاوااسکریپت)
var dataset = ee.ImageCollection('ECMWF/ERA5_LAND/HOURLY')
                .filter(ee.Filter.date('2020-07-01', '2020-07-02'));

var visualization = {
  bands: ['temperature_2m'],
  min: 250.0,
  max: 320.0,
  palette: [
    '000080', '0000d9', '4000ff', '8000ff', '0080ff', '00ffff',
    '00ff80', '80ff00', 'daff00', 'ffff00', 'fff500', 'ffda00',
    'ffb000', 'ffa400', 'ff4f00', 'ff2500', 'ff0a00', 'ff00ff',
  ]
};

Map.setCenter(22.2, 21.2, 0);

Map.addLayer(dataset, visualization, 'Air temperature [K] at 2m height');
import ee
import geemap.core as geemap
کولب (پایتون)
dataset = ee.ImageCollection('ECMWF/ERA5_LAND/HOURLY').filter(
    ee.Filter.date('2020-07-01', '2020-07-02')
)

visualization = {
    'bands': ['temperature_2m'],
    'min': 250.0,
    'max': 320.0,
    'palette': [
        '000080', '0000d9', '4000ff', '8000ff', '0080ff', '00ffff',
        '00ff80', '80ff00', 'daff00', 'ffff00', 'fff500', 'ffda00',
        'ffb000', 'ffa400', 'ff4f00', 'ff2500', 'ff0a00', 'ff00ff',
    ],
}

m = geemap.Map()
m.set_center(22.2, 21.2, 0)
m.add_layer(dataset, visualization, 'Air temperature [K] at 2m height')
m
- در دسترس بودن مجموعه دادهها
- 1950-01-01T01:00:00Z–2026-09-01T23:00:00Z
- تولیدکننده مجموعه داده
- Copernicus Climate Data Store
- کادانس
- ۱ ساعت
- برچسبها
توضیحات
ERA5-Land is a reanalysis dataset providing a consistent view of the evolution of land variables over several decades at an enhanced resolution compared to ERA5. ERA5-Land has been produced by replaying the land component of the ECMWF ERA5 climate reanalysis. Reanalysis combines model data with observations from across the world into a globally complete and consistent dataset using the laws of physics. Reanalysis produces data that goes several decades back in time, providing an accurate description of the climate of the past. This dataset includes all 50 variables as available on CDS.
ERA5-Land data is available from 1950 to three months from real-time.
Please consult the ERA5-Land "Known Issues" section . In particular, note that three components of the total evapotranspiration have values swapped as follows:
- variable "Evaporation from bare soil" (mars parameter code 228101 (evabs)) has the values corresponding to the "Evaporation from vegetation transpiration" (mars parameter 228103 (evavt)),
- variable "Evaporation from open water surfaces excluding oceans (mars parameter code 228102 (evaow)) has the values corresponding to the "Evaporation from bare soil" (mars parameter code 228101 (evabs)),
- variable "Evaporation from vegetation transpiration" (mars parameter code 228103 (evavt)) has the values corresponding to the "Evaporation from open water surfaces excluding oceans" (mars parameter code 228102 (evaow)).
Please note that the convention for accumulations used in ERA5-Land differs with that for ERA5. The accumulations are treated the same as those in ERA-Interim or ERA-Interim/Land, ie, they are accumulated from the beginning of the forecast to the end of the forecast step. This happens within every day and gets reset on midnight. See this page for more information . The Earth Engine Data team added 19 additional bands, one for each of the accumulation bands, with the hourly values computed as the difference between two consecutive forecast steps.
باندها
باندها
اندازه پیکسل: ۱۱۱۳۲ متر (همه باندها)
| نام | واحدها | اندازه پیکسل | توضیحات |
|---|---|---|---|
dewpoint_temperature_2m | ک | 11132 meters | Temperature to which the air, at 2 meters above the surface of the Earth, would have to be cooled for saturation to occur. It is a measure of the humidity of the air. Combined with temperature and pressure, it can be used to calculate the relative humidity. 2m dew point temperature is calculated by interpolating between the lowest model level and the Earth's surface, taking account of the atmospheric conditions. |
temperature_2m | ک | 11132 meters | Temperature of air at 2m above the surface of land, sea or in-land waters. 2m temperature is calculated by interpolating between the lowest model level and the Earth's surface, taking account of the atmospheric conditions. |
skin_temperature | ک | 11132 meters | Temperature of the surface of the Earth. The skin temperature is the theoretical temperature that is required to satisfy the surface energy balance. It represents the temperature of the uppermost surface layer, which has no heat capacity and so can respond instantaneously to changes in surface fluxes. Skin temperature is calculated differently over land and sea. |
soil_temperature_level_1 | ک | 11132 meters | Temperature of the soil in layer 1 (0 - 7 cm) of the ECMWF Integrated Forecasting System. The surface is at 0 cm. Soil temperature is set at the middle of each layer, and heat transfer is calculated at the interfaces between them. It is assumed that there is no heat transfer out of the bottom of the lowest layer. |
soil_temperature_level_2 | ک | 11132 meters | Temperature of the soil in layer 2 (7-28 cm) of the ECMWF Integrated Forecasting System. |
soil_temperature_level_3 | ک | 11132 meters | Temperature of the soil in layer 3 (28-100 cm) of the ECMWF Integrated Forecasting System. |
soil_temperature_level_4 | ک | 11132 meters | Temperature of the soil in layer 4 (100-289 cm) of the ECMWF Integrated Forecasting System. |
lake_bottom_temperature | ک | 11132 meters | Temperature of water at the bottom of inland water bodies (lakes, reservoirs, rivers) and coastal waters. ECMWF implemented a lake model in May 2015 to represent the water temperature and lake ice of all the world's major inland water bodies in the Integrated Forecasting System. The model keeps lake depth and surface area (or fractional cover) constant in time. |
lake_ice_depth | متر | ۱۱۱۳۲ متر | The thickness of ice on inland water bodies (lakes, reservoirs and rivers) and coastal waters. The ECMWF Integrated Forecasting System (IFS) represents the formation and melting of ice on inland water bodies (lakes, reservoirs and rivers) and coastal water. A single ice layer is represented. This parameter is the thickness of that ice layer. |
lake_ice_temperature | ک | 11132 meters | The temperature of the uppermost surface of ice on inland water bodies (lakes, reservoirs, rivers) and coastal waters. The ECMWF Integrated Forecasting System represents the formation and melting of ice on lakes. A single ice layer is represented. |
lake_mix_layer_depth | متر | 11132 meters | The thickness of the upper most layer of an inland water body (lake, reservoirs, and rivers) or coastal waters that is well mixed and has a near constant temperature with depth (uniform distribution of temperature). The ECMWF Integrated Forecasting System represents inland water bodies with two layers in the vertical, the mixed layer above and the thermocline below. Thermoclines upper boundary is located at the mixed layer bottom, and the lower boundary at the lake bottom. Mixing within the mixed layer can occur when the density of the surface (and near-surface) water is greater than that of the water below. Mixing can also occur through the action of wind on the surface of the lake. |
lake_mix_layer_temperature | ک | 11132 meters | The temperature of the upper most layer of inland water bodies (lakes, reservoirs and rivers) or coastal waters) that is well mixed. The ECMWF Integrated Forecasting System represents inland water bodies with two layers in the vertical, the mixed layer above and the thermocline below. Thermoclines upper boundary is located at the mixed layer bottom, and the lower boundary at the lake bottom. Mixing within the mixed layer can occur when the density of the surface (and near-surface) water is greater than that of the water below. Mixing can also occur through the action of wind on the surface of the lake. |
lake_shape_factor | 11132 meters | This parameter describes the way that temperature changes with depth in the thermocline layer of inland water bodies (lakes, reservoirs and rivers) and coastal waters. It is used to calculate the lake bottom temperature and other lake-related parameters. The ECMWF Integrated Forecasting System represents inland and coastal water bodies with two layers in the vertical, the mixed layer above and the thermocline below where temperature changes with depth. | |
lake_total_layer_temperature | ک | 11132 meters | The mean temperature of total water column in inland water bodies (lakes, reservoirs and rivers) and coastal waters. The ECMWF Integrated Forecasting System represents inland water bodies with two layers in the vertical, the mixed layer above and the thermocline below where temperature changes with depth. This parameter is the mean over the two layers. |
snow_albedo | 11132 meters | It is defined as the fraction of solar (shortwave) radiation reflected by the snow, across the solar spectrum, for both direct and diffuse radiation. It is a measure of the reflectivity of the snow covered grid cells. Values vary between 0 and 1. Typically, snow and ice have high reflectivity with albedo values of 0.8 and above. | |
snow_cover | 11132 meters | It represents the fraction (0-1) of the cell / grid-box occupied by snow (similar to the cloud cover fields of ERA5). | |
snow_density | kg/m^3 | 11132 meters | Mass of snow per cubic meter in the snow layer. The ECMWF Integrated Forecast System (IFS) model represents snow as a single additional layer over the uppermost soil level. The snow may cover all or part of the grid box. |
snow_depth | متر | 11132 meters | Instantaneous grid-box average of the snow thickness on the ground (excluding snow on canopy). |
snow_depth_water_equivalent | m of water equivalent | 11132 meters | Depth of snow from the snow-covered area of a grid box. Its units are meters of water equivalent, so it is the depth the water would have if the snow melted and was spread evenly over the whole grid box. The ECMWF Integrated Forecast System represents snow as a single additional layer over the uppermost soil level. The snow may cover all or part of the grid box. |
snowfall | m of water equivalent | 11132 meters | Accumulated total snow that has fallen to the Earth's surface. It consists of snow due to the large-scale atmospheric flow (horizontal scales greater than around a few hundred meters) and convection where smaller scale areas (around 5km to a few hundred kilometers) of warm air rise. If snow has melted during the period over which this variable was accumulated, then it will be higher than the snow depth. This variable is the total amount of water accumulated from the beginning of the forecast time to the end of the forecast step. The units given measure the depth the water would have if the snow melted and was spread evenly over the grid box. Care should be taken when comparing model variables with observations, because observations are often local to a particular point in space and time, rather than representing averages over a model grid box and model time step. |
snowmelt | m of water equivalent | 11132 meters | Melting of snow averaged over the grid box (to find melt over snow, divide by snow fraction). This variable is accumulated from the beginning of the forecast time to the end of the forecast step. |
temperature_of_snow_layer | ک | 11132 meters | This variable gives the temperature of the snow layer from the ground to the snow-air interface. The ECMWF Integrated Forecast System (IFS) model represents snow as a single additional layer over the uppermost soil level. The snow may cover all or part of the grid box. |
skin_reservoir_content | m of water equivalent | 11132 meters | Amount of water in the vegetation canopy and/or in a thin layer on the soil. It represents the amount of rain intercepted by foliage, and water from dew. The maximum amount of 'skin reservoir content' a grid box can hold depends on the type of vegetation, and may be zero. Water leaves the 'skin reservoir' by evaporation. |
volumetric_soil_water_layer_1 | کسر حجمی | 11132 meters | Volume of water in soil layer 1 (0 - 7 cm) of the ECMWF Integrated Forecasting System. The surface is at 0 cm. The volumetric soil water is associated with the soil texture (or classification), soil depth, and the underlying groundwater level. |
volumetric_soil_water_layer_2 | کسر حجمی | 11132 meters | Volume of water in soil layer 2 (7 -28 cm) of the ECMWF Integrated Forecasting System. |
volumetric_soil_water_layer_3 | کسر حجمی | 11132 meters | Volume of water in soil layer 3 (28-100 cm) of the ECMWF Integrated Forecasting System. |
volumetric_soil_water_layer_4 | کسر حجمی | 11132 meters | Volume of water in soil layer 4 (100-289 cm) of the ECMWF Integrated Forecasting System. |
forecast_albedo | 11132 meters | Is a measure of the reflectivity of the Earth's surface. It is the fraction of solar (shortwave) radiation reflected by Earth's surface, across the solar spectrum, for both direct and diffuse radiation. Values are between 0 and 1. Typically, snow and ice have high reflectivity with albedo values of 0.8 and above, land has intermediate values between about 0.1 and 0.4 and the ocean has low values of 0.1 or less. Radiation from the Sun (solar, or shortwave, radiation) is partly reflected back to space by clouds and particles in the atmosphere (aerosols) and some of it is absorbed. The rest is incident on the Earth's surface, where some of it is reflected. The portion that is reflected by the Earth's surface depends on the albedo. In the ECMWF Integrated Forecasting System (IFS), a climatological background albedo (observed values averaged over a period of several years) is used, modified by the model over water, ice and snow. Albedo is often shown as a percentage (%). | |
surface_latent_heat_flux | ژول بر متر مربع | 11132 meters | Exchange of latent heat with the surface through turbulent diffusion. This variables is accumulated from the beginning of the forecast time to the end of the forecast step. By model convention, downward fluxes are positive. |
surface_net_solar_radiation | ژول بر متر مربع | 11132 meters | Amount of solar radiation (also known as shortwave radiation) reaching the surface of the Earth (both direct and diffuse) minus the amount reflected by the Earth's surface (which is governed by the albedo). Radiation from the Sun (solar, or shortwave, radiation) is partly reflected back to space by clouds and particles in the atmosphere (aerosols) and some of it is absorbed. The rest is incident on the Earth's surface, where some of it is reflected. The difference between downward and reflected solar radiation is the surface net solar radiation. This variable is accumulated from the beginning of the forecast time to the end of the forecast step. The units are joules per square meter (J m-2). To convert to watts per square meter (W m-2), the accumulated values should be divided by the accumulation period expressed in seconds. The ECMWF convention for vertical fluxes is positive downwards. |
surface_net_thermal_radiation | ژول بر متر مربع | ۱۱۱۳۲ متر | Net thermal radiation at the surface. Accumulated field from the beginning of the forecast time to the end of the forecast step. By model convention downward fluxes are positive. |
surface_sensible_heat_flux | ژول بر متر مربع | 11132 meters | Transfer of heat between the Earth's surface and the atmosphere through the effects of turbulent air motion (but excluding any heat transfer resulting from condensation or evaporation). The magnitude of the sensible heat flux is governed by the difference in temperature between the surface and the overlying atmosphere, wind speed and the surface roughness. For example, cold air overlying a warm surface would produce a sensible heat flux from the land (or ocean) into the atmosphere. This is a single level variable and it is accumulated from the beginning of the forecast time to the end of the forecast step. The units are joules per square meter (J m-2). To convert to watts per square meter (W m-2), the accumulated values should be divided by the accumulation period expressed in seconds. The ECMWF convention for vertical fluxes is positive downwards. |
surface_solar_radiation_downwards | ژول بر متر مربع | 11132 meters | Amount of solar radiation (also known as shortwave radiation) reaching the surface of the Earth. This variable comprises both direct and diffuse solar radiation. Radiation from the Sun (solar, or shortwave, radiation) is partly reflected back to space by clouds and particles in the atmosphere (aerosols) and some of it is absorbed. The rest is incident on the Earth's surface (represented by this variable). To a reasonably good approximation, this variable is the model equivalent of what would be measured by a pyranometer (an instrument used for measuring solar radiation) at the surface. However, care should be taken when comparing model variables with observations, because observations are often local to a particular point in space and time, rather than representing averages over a model grid box and model time step. This variable is accumulated from the beginning of the forecast time to the end of the forecast step. The units are joules per square meter (J m-2). To convert to watts per square meter (W m-2), the accumulated values should be divided by the accumulation period expressed in seconds. The ECMWF convention for vertical fluxes is positive downwards. |
surface_thermal_radiation_downwards | ژول بر متر مربع | 11132 meters | Amount of thermal (also known as longwave or terrestrial) radiation emitted by the atmosphere and clouds that reaches the Earth's surface. The surface of the Earth emits thermal radiation, some of which is absorbed by the atmosphere and clouds. The atmosphere and clouds likewise emit thermal radiation in all directions, some of which reaches the surface (represented by this variable). This variable is accumulated from the beginning of the forecast time to the end of the forecast step. The units are joules per square meter (J m-2). To convert to watts per square meter (W m-2), the accumulated values should be divided by the accumulation period expressed in seconds. The ECMWF convention for vertical fluxes is positive downwards. |
evaporation_from_bare_soil | m of water equivalent | 11132 meters | The amount of evaporation from bare soil at the top of the land surface. This variable is accumulated from the beginning of the forecast time to the end of the forecast step. |
evaporation_from_open_water_surfaces_excluding_oceans | m of water equivalent | 11132 meters | Amount of evaporation from surface water storage like lakes and inundated areas but excluding oceans. This variable is accumulated from the beginning of the forecast time to the end of the forecast step. |
evaporation_from_the_top_of_canopy | m of water equivalent | 11132 meters | The amount of evaporation from the canopy interception reservoir at the top of the canopy. This variable is accumulated from the beginning of the forecast time to the end of the forecast step. |
evaporation_from_vegetation_transpiration | m of water equivalent | 11132 meters | Amount of evaporation from vegetation transpiration. This has the same meaning as root extraction ie the amount of water extracted from the different soil layers. This variable is accumulated from the beginning of the forecast time to the end of the forecast step. |
potential_evaporation | متر | 11132 meters | Potential evaporation (pev) in the current ECMWF model is computed, by making a second call to the surface energy balance routine with the vegetation variables set to "crops/mixed farming" and assuming no stress from soil moisture. In other words, evaporation is computed for agricultural land as if it is well watered and assuming that the atmosphere is not affected by this artificial surface condition. The latter may not always be realistic. Although pev is meant to provide an estimate of irrigation requirements, the method can give unrealistic results in arid conditions due to too strong evaporation forced by dry air. This variable is accumulated from the beginning of the forecast time to the end of the forecast step. |
runoff | متر | 11132 meters | Some water from rainfall, melting snow, or deep in the soil, stays stored in the soil. Otherwise, the water drains away, either over the surface (surface runoff), or under the ground (sub-surface runoff) and the sum of these two is simply called 'runoff'. This variable is the total amount of water accumulated from the beginning of the forecast time to the end of the forecast step. The units of runoff are depth in meters. This is the depth the water would have if it were spread evenly over the grid box. Care should be taken when comparing model variables with observations, because observations are often local to a particular point rather than averaged over a grid square area. Observations are also often taken in different units, such as mm/day, rather than the accumulated meters produced here. Runoff is a measure of the availability of water in the soil, and can, for example, be used as an indicator of drought or flood. More information about how runoff is calculated is given in the IFS Physical Processes documentation. |
snow_evaporation | m of water equivalent | 11132 meters | Evaporation from snow averaged over the grid box (to find flux over snow, divide by snow fraction). This variable is accumulated from the beginning of the forecast time to the end of the forecast step. |
sub_surface_runoff | متر | 11132 meters | Some water from rainfall, melting snow, or deep in the soil, stays stored in the soil. Otherwise, the water drains away, either over the surface (surface runoff), or under the ground(sub-surface runoff) and the sum of these two is simply called 'runoff'. This variable is accumulated from the beginning of the forecast time to the end of the forecast step. The units of runoff are depth in meters. This is the depth the water would have if it were spread evenly over the grid box. Care should be taken when comparing model variables with observations, because observations are often local to a particular point rather than averaged over a grid square area. Observations are also often taken in different units, such as mm/day, rather than the accumulated meters produced here. Runoff is a measure of the availability of water in the soil, and can, for example, be used as an indicator of drought or flood. More information about how runoff is calculated is given in the IFS Physical Processes documentation. |
surface_runoff | متر | 11132 meters | Some water from rainfall, melting snow, or deep in the soil, stays stored in the soil. Otherwise, the water drains away, either over the surface (surface runoff), or under the ground (sub-surface runoff) and the sum of these two is simply called 'runoff'. This variable is the total amount of water accumulated from the beginning of the forecast time to the end of the forecast step. The units of runoff are depth in meters. This is the depth the water would have if it were spread evenly over the grid box. Care should be taken when comparing model variables with observations, because observations are often local to a particular point rather than averaged over a grid square area. Observations are also often taken in different units, such as mm/day, rather than the accumulated meters produced here. Runoff is a measure of the availability of water in the soil, and can, for example, be used as an indicator of drought or flood. More information about how runoff is calculated is given in the IFS Physical Processes documentation. |
total_evaporation | m of water equivalent | 11132 meters | Accumulated amount of water that has evaporated from the Earth's surface, including a simplified representation of transpiration (from vegetation), into vapor in the air above. This variable is accumulated from the beginning of the forecast to the end of the forecast step. The ECMWF Integrated Forecasting System convention is that downward fluxes are positive. Therefore, negative values indicate evaporation and positive values indicate condensation. |
u_component_of_wind_10m | اماس | ۱۱۱۳۲ متر | Eastward component of the 10m wind. It is the horizontal speed of air moving towards the east, at a height of ten meters above the surface of the Earth, in meters per second. Care should be taken when comparing this variable with observations, because wind observations vary on small space and time scales and are affected by the local terrain, vegetation and buildings that are represented only on average in the ECMWF Integrated Forecasting System. This variable can be combined with the V component of 10m wind to give the speed and direction of the horizontal 10m wind. |
v_component_of_wind_10m | اماس | 11132 meters | Northward component of the 10m wind. It is the horizontal speed of air moving towards the north, at a height of ten meters above the surface of the Earth, in meters per second. Care should be taken when comparing this variable with observations, because wind observations vary on small space and time scales and are affected by the local terrain, vegetation and buildings that are represented only on average in the ECMWF Integrated Forecasting System. This variable can be combined with the U component of 10m wind to give the speed and direction of the horizontal 10m wind. |
surface_pressure | پا | 11132 meters | Pressure (force per unit area) of the atmosphere on the surface of land, sea and in-land water. It is a measure of the weight of all the air in a column vertically above the area of the Earth's surface represented at a fixed point. Surface pressure is often used in combination with temperature to calculate air density. The strong variation of pressure with altitude makes it difficult to see the low and high pressure systems over mountainous areas, so mean sea level pressure, rather than surface pressure, is normally used for this purpose. The units of this variable are Pascals (Pa). Surface pressure is often measured in hPa and sometimes is presented in the old units of millibars, mb (1 hPa = 1 mb = 100 Pa). |
total_precipitation | متر | 11132 meters | Accumulated liquid and frozen water, including rain and snow, that falls to the Earth's surface. It is the sum of large-scale precipitation (that precipitation which is generated by large-scale weather patterns, such as troughs and cold fronts) and convective precipitation (generated by convection which occurs when air at lower levels in the atmosphere is warmer and less dense than the air above, so it rises). Precipitation variables do not include fog, dew or the precipitation that evaporates in the atmosphere before it lands at the surface of the Earth. This variable is accumulated from the beginning of the forecast time to the end of the forecast step. The units of precipitation are depth in meters. It is the depth the water would have if it were spread evenly over the grid box. Care should be taken when comparing model variables with observations, because observations are often local to a particular point in space and time, rather than representing averages over a model grid box and model time step. |
leaf_area_index_high_vegetation | کسر مساحت | 11132 meters | One-half of the total green leaf area per unit horizontal ground surface area for high vegetation type. |
leaf_area_index_low_vegetation | کسر مساحت | 11132 meters | One-half of the total green leaf area per unit horizontal ground surface area for low vegetation type. |
snowfall_hourly | m of water equivalent | 11132 meters | snowfall disaggregated from the original cumulative values into hourly values |
snowmelt_hourly | m of water equivalent | 11132 meters | snowmelt disaggregated from the original cumulative values into hourly values |
surface_latent_heat_flux_hourly | ژول بر متر مربع | ۱۱۱۳۲ متر | surface latent heat flux disaggregated from the original cumulative values into hourly values |
surface_net_solar_radiation_hourly | ژول بر متر مربع | 11132 meters | surface net solar radiation disaggregated from the original cumulative values into hourly values |
surface_net_thermal_radiation_hourly | ژول بر متر مربع | 11132 meters | surface net thermal radiation disaggregated from the original cumulative values into hourly values |
surface_sensible_heat_flux_hourly | ژول بر متر مربع | 11132 meters | surface sensible heat flux disaggregated from the original cumulative values into hourly values |
surface_solar_radiation_downwards_hourly | ژول بر متر مربع | 11132 meters | surface solar radiation downwards disaggregated from the original cumulative values into hourly values |
surface_thermal_radiation_downwards_hourly | ژول بر متر مربع | 11132 meters | surface thermal radiation downwards disaggregated from the original cumulative values into hourly values |
evaporation_from_bare_soil_hourly | m of water equivalent | 11132 meters | evaporation from bare soil disaggregated from the original cumulative values into hourly values |
evaporation_from_open_water_surfaces_excluding_oceans_hourly | m of water equivalent | 11132 meters | evaporation from open water surfaces excluding oceans disaggregated from the original cumulative values into hourly values |
evaporation_from_the_top_of_canopy_hourly | m of water equivalent | 11132 meters | evaporation from the top of canopy disaggregated from the original cumulative values into hourly values |
evaporation_from_vegetation_transpiration_hourly | m of water equivalent | 11132 meters | evaporation from vegetation transpiration disaggregated from the original cumulative values into hourly values |
potential_evaporation_hourly | متر | 11132 meters | potential evaporation disaggregated from the original cumulative values into hourly values |
runoff_hourly | متر | 11132 meters | runoff disaggregated from the original cumulative values into hourly values |
snow_evaporation_hourly | m of water equivalent | 11132 meters | snow evaporation disaggregated from the original cumulative values into hourly values |
sub_surface_runoff_hourly | متر | ۱۱۱۳۲ متر | sub surface runoff disaggregated from the original cumulative values into hourly values |
surface_runoff_hourly | متر | 11132 meters | surface runoff disaggregated from the original cumulative values into hourly values |
total_evaporation_hourly | m of water equivalent | 11132 meters | total evaporation disaggregated from the original cumulative values into hourly values |
total_precipitation_hourly | متر | 11132 meters | total precipitation disaggregated from the original cumulative values into hourly values |
ویژگیهای تصویر
ویژگیهای تصویر
| نام | نوع | توضیحات |
|---|---|---|
| ساعت | داخلی | ساعت روز |
شرایط استفاده
شرایط استفاده
Please acknowledge the use of ERA5-Land as stated in the Copernicus C3S/CAMS License agreement :
5.1.1 Where the Licensee communicates or distributes Copernicus Products to the public, the Licensee shall inform the recipients of the source by using the following or any similar notice: 'Generated using Copernicus Climate Change Service Information [Year]'.
5.1.2 Where the Licensee makes or contributes to a publication or distribution containing adapted or modified Copernicus Products, the Licensee shall provide the following or any similar notice: 'Contains modified Copernicus Climate Change Service Information [Year]';
Any such publication or distribution covered by clauses 5.1.1 and 5.1.2 shall state that neither the European Commission nor ECMWF is responsible for any use that may be made of the Copernicus Information or Data it contains.
نقل قولها
Muñoz Sabater, J., (2019): ERA5-Land monthly averaged data from 1981 to present. Copernicus Climate Change Service (C3S) Climate Data Store (CDS). (<date of access>), doi:10.24381/cds.68d2bb30
با موتور زمین کاوش کنید
ویرایشگر کد (جاوااسکریپت)
var dataset = ee.ImageCollection('ECMWF/ERA5_LAND/HOURLY')
                .filter(ee.Filter.date('2020-07-01', '2020-07-02'));

var visualization = {
  bands: ['temperature_2m'],
  min: 250.0,
  max: 320.0,
  palette: [
    '000080', '0000d9', '4000ff', '8000ff', '0080ff', '00ffff',
    '00ff80', '80ff00', 'daff00', 'ffff00', 'fff500', 'ffda00',
    'ffb000', 'ffa400', 'ff4f00', 'ff2500', 'ff0a00', 'ff00ff',
  ]
};

Map.setCenter(22.2, 21.2, 0);

Map.addLayer(dataset, visualization, 'Air temperature [K] at 2m height');
import ee
import geemap.core as geemap
کولب (پایتون)
dataset = ee.ImageCollection('ECMWF/ERA5_LAND/HOURLY').filter(
    ee.Filter.date('2020-07-01', '2020-07-02')
)

visualization = {
    'bands': ['temperature_2m'],
    'min': 250.0,
    'max': 320.0,
    'palette': [
        '000080', '0000d9', '4000ff', '8000ff', '0080ff', '00ffff',
        '00ff80', '80ff00', 'daff00', 'ffff00', 'fff500', 'ffda00',
        'ffb000', 'ffa400', 'ff4f00', 'ff2500', 'ff0a00', 'ff00ff',
    ],
}

m = geemap.Map()
m.set_center(22.2, 21.2, 0)
m.add_layer(dataset, visualization, 'Air temperature [K] at 2m height')
m