
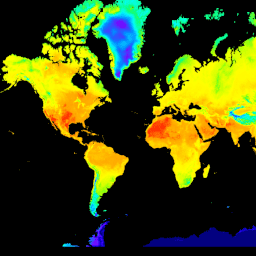
- Доступность набора данных
- 1950-01-01T01:00:00Z–2026-09-01T23:00:00Z
- Производитель наборов данных
- Хранилище климатических данных Copernicus
- Каденция
- 1 час
- Теги
Описание
ERA5-Land — это набор данных реанализа, обеспечивающий согласованное представление об эволюции переменных, характеризующих сушу, на протяжении нескольких десятилетий с улучшенным разрешением по сравнению с ERA5. ERA5-Land был создан путем воспроизведения компонента суши из климатического реанализа ECMWF ERA5. Реанализ объединяет данные модели с наблюдениями со всего мира в глобально полный и согласованный набор данных, используя законы физики. Реанализ создает данные, охватывающие несколько десятилетий, обеспечивая точное описание климата прошлого. Этот набор данных включает все 50 переменных, доступных на CDS.
Данные ERA5-Land доступны в режиме реального времени за период с 1950 года по три месяца включительно.
Пожалуйста, ознакомьтесь с разделом «Известные проблемы» на сайте ERA5-Land . В частности, обратите внимание на то, что значения трех компонентов общего испарения поменяны местами следующим образом:
- Переменная «Испарение с голой почвы» (код параметра Mars 228101 (evabs)) имеет значения, соответствующие переменной «Испарение из растительности в результате транспирации» (параметр Mars 228103 (evavt)).
- Переменная «Испарение с открытых водных поверхностей, за исключением океанов» (код параметра Mars 228102 (evaow)) имеет значения, соответствующие переменной «Испарение с голой почвы» (код параметра Mars 228101 (evabs)).
- Переменная «Испарение из растительности» (код параметра Марса 228103 (evavt)) имеет значения, соответствующие переменной «Испарение с открытых водных поверхностей, за исключением океанов» (код параметра Марса 228102 (evaow)).
Обратите внимание, что используемая в ERA5-Land система учета накоплений отличается от системы для ERA5. Накопления обрабатываются так же, как и в ERA-Interim или ERA-Interim/Land, то есть они накапливаются с начала прогноза до конца шага прогнозирования. Это происходит в течение каждого дня и обнуляется в полночь. Дополнительную информацию см. на этой странице . Команда Earth Engine Data добавила 19 дополнительных диапазонов, по одному для каждого диапазона накопления, при этом почасовые значения вычисляются как разница между двумя последовательными шагами прогнозирования.
Группы
Группы
Размер пикселя: 11132 метра (все диапазоны)
| Имя | Единицы | Размер пикселя | Описание |
|---|---|---|---|
dewpoint_temperature_2m | К | 11132 метра | Температура, до которой необходимо охладить воздух на высоте 2 метров над поверхностью Земли, чтобы произошло насыщение. Это показатель влажности воздуха. В сочетании с температурой и давлением её можно использовать для расчета относительной влажности. Температура точки росы на высоте 2 м рассчитывается путем интерполяции между самым нижним уровнем модели и поверхностью Земли с учетом атмосферных условий. |
temperature_2m | К | 11132 метра | Температура воздуха на высоте 2 м над поверхностью суши, моря или внутренних водоемов. Температура на высоте 2 м рассчитывается путем интерполяции между самым нижним уровнем модели и поверхностью Земли с учетом атмосферных условий. |
skin_temperature | К | 11132 метра | Температура поверхности Земли. Температура поверхности — это теоретическая температура, необходимая для соблюдения баланса энергии поверхности. Она представляет собой температуру самого верхнего слоя поверхности, который не обладает теплоемкостью и поэтому может мгновенно реагировать на изменения поверхностных потоков. Температура поверхности рассчитывается по-разному для суши и моря. |
soil_temperature_level_1 | К | 11132 метра | Температура грунта в слое 1 (0–7 см) интегрированной системы прогнозирования ECMWF. Поверхность находится на отметке 0 см. Температура грунта задается в середине каждого слоя, а теплопередача рассчитывается на границах между ними. Предполагается, что теплопередача из нижней части самого нижнего слоя отсутствует. |
soil_temperature_level_2 | К | 11132 метра | Температура почвы во втором слое (7-28 см) Интегрированной системы прогнозирования ЕСМВФ. |
soil_temperature_level_3 | К | 11132 метра | Температура почвы в слое 3 (28-100 см) Интегрированной системы прогнозирования ЕСМВФ. |
soil_temperature_level_4 | К | 11132 метра | Температура почвы в слое 4 (100-289 см) Интегрированной системы прогнозирования ЕСМВФ. |
lake_bottom_temperature | К | 11132 метра | Температура воды на дне внутренних водоемов (озер, водохранилищ, рек) и прибрежных вод. В мае 2015 года ECMWF внедрила модель озер для представления температуры воды и ледового покрова всех основных внутренних водоемов мира в рамках Интегрированной системы прогнозирования. Модель поддерживает постоянными во времени глубину озера и площадь его поверхности (или долю ледового покрова). |
lake_ice_depth | м | 11132 метра | Толщина льда на внутренних водоемах (озерах, водохранилищах и реках) и прибрежных водах. Интегрированная система прогнозирования ECMWF (IFS) отображает образование и таяние льда на внутренних водоемах (озерах, водохранилищах и реках) и прибрежных водах. Представлен один слой льда. Этот параметр представляет собой толщину этого слоя льда. |
lake_ice_temperature | К | 11132 метра | Температура верхнего слоя льда на внутренних водоемах (озерах, водохранилищах, реках) и прибрежных водах. Интегрированная система прогнозирования ECMWF отображает образование и таяние льда на озерах. Представлен один слой льда. |
lake_mix_layer_depth | м | 11132 метра | Толщина верхнего слоя внутренних водоемов (озер, водохранилищ и рек) или прибрежных вод, который хорошо перемешан и имеет почти постоянную температуру по глубине (равномерное распределение температуры). Интегрированная система прогнозирования ECMWF представляет внутренние водоемы с двумя вертикальными слоями: перемешанным слоем сверху и термоклинным слоем снизу. Верхняя граница термоклинного слоя расположена у дна перемешанного слоя, а нижняя — у дна озера. Перемешивание внутри перемешанного слоя может происходить, когда плотность поверхностной (и приповерхностной) воды превышает плотность нижележащей воды. Перемешивание также может происходить под действием ветра на поверхности озера. |
lake_mix_layer_temperature | К | 11132 метра | Температура самого верхнего слоя внутренних водоемов (озер, водохранилищ и рек) или прибрежных вод, который хорошо перемешивается. Интегрированная система прогнозирования ECMWF представляет внутренние водоемы с двумя слоями по вертикали: перемешанным слоем сверху и термоклинным слоем снизу. Верхняя граница термоклинного слоя расположена у дна перемешанного слоя, а нижняя — у дна озера. Перемешивание внутри перемешанного слоя может происходить, когда плотность поверхностной (и приповерхностной) воды превышает плотность воды ниже. Перемешивание также может происходить под действием ветра на поверхности озера. |
lake_shape_factor | 11132 метра | Этот параметр описывает изменение температуры с глубиной в термоклинном слое внутренних водоемов (озер, водохранилищ и рек) и прибрежных вод. Он используется для расчета температуры дна озера и других параметров, связанных с озерами. Интегрированная система прогнозирования ECMWF представляет внутренние и прибрежные водоемы двумя слоями по вертикали: перемешанным слоем сверху и термоклинным слоем снизу, где температура изменяется с глубиной. | |
lake_total_layer_temperature | К | 11132 метра | Средняя температура всего водного столба во внутренних водоемах (озерах, водохранилищах и реках) и прибрежных водах. Интегрированная система прогнозирования ECMWF представляет внутренние водоемы двумя слоями по вертикали: перемешанным слоем сверху и термоклинным слоем снизу, где температура изменяется с глубиной. Этот параметр представляет собой среднее значение по двум слоям. |
snow_albedo | 11132 метра | Он определяется как доля солнечного (коротковолнового) излучения, отраженного снегом во всем солнечном спектре, как прямого, так и рассеянного излучения. Это показатель отражательной способности ячеек сетки, покрытых снегом. Значения варьируются от 0 до 1. Как правило, снег и лед обладают высокой отражательной способностью со значениями альбедо 0,8 и выше. | |
snow_cover | 11132 метра | Это представляет собой долю (0-1) ячейки/ячейки сетки, занятую снегом (аналогично полям облачного покрова в ERA5). | |
snow_density | кг/м³ | 11132 метра | Масса снега на кубический метр в снежном слое. Модель интегрированной системы прогнозирования ECMWF (IFS) представляет снег как единый дополнительный слой над самым верхним уровнем почвы. Снег может покрывать всю или часть ячейки сетки. |
snow_depth | м | 11132 метра | Мгновенное среднее значение толщины снега на поверхности земли по ячейкам сетки (за исключением снега на растительности). |
snow_depth_water_equivalent | м водного эквивалента | 11132 метра | Глубина снежного покрова на заснеженной территории ячейки сетки. Единица измерения — метры водного эквивалента, то есть это глубина, которую имела бы вода, если бы снег растаял и равномерно распределился по всей ячейке сетки. Интегрированная система прогнозирования ECMWF представляет снег как один дополнительный слой над самым верхним слоем почвы. Снег может покрывать всю ячейку сетки или её часть. |
snowfall | м водного эквивалента | 11132 метра | Общее количество снега, выпавшего на поверхность Земли. Оно состоит из снега, образовавшегося в результате крупномасштабных атмосферных потоков (горизонтальные масштабы более нескольких сотен метров) и конвекции, при которой более мелкие области (от 5 км до нескольких сотен километров) теплого воздуха поднимаются вверх. Если снег растаял за период, в течение которого накапливалась эта переменная, то ее глубина будет больше, чем глубина снега. Эта переменная представляет собой общее количество воды, накопленное с начала прогнозируемого времени до конца прогнозного шага. Указанные единицы измерения показывают глубину воды, которую она имела бы, если бы снег растаял и был равномерно распределен по ячейке сетки. Следует проявлять осторожность при сравнении переменных модели с наблюдениями, поскольку наблюдения часто являются локальными для определенной точки в пространстве и времени, а не представляют собой средние значения по ячейке сетки модели и временному шагу модели. |
snowmelt | м водного эквивалента | 11132 метра | Среднее значение таяния снега по ячейке сетки (чтобы найти таяние снега, разделите на долю снега). Эта переменная накапливается с начала прогнозируемого периода до конца прогнозируемого шага. |
temperature_of_snow_layer | К | 11132 метра | Эта переменная показывает температуру снежного слоя от поверхности земли до границы раздела снег-воздух. Модель интегрированной системы прогнозирования ECMWF (IFS) представляет снег как единый дополнительный слой над самым верхним уровнем почвы. Снег может покрывать всю или часть ячейки сетки. |
skin_reservoir_content | м водного эквивалента | 11132 метра | Количество воды в растительном покрове и/или в тонком слое почвы. Оно представляет собой количество дождевой воды, перехваченной листвой, и воды из росы. Максимальное количество «содержимого поверхностного резервуара», которое может вместить ячейка сетки, зависит от типа растительности и может быть равно нулю. Вода покидает «поверхностный резервуар» за счет испарения. |
volumetric_soil_water_layer_1 | Объемная доля | 11132 метра | Объем воды в первом слое почвы (0–7 см) интегрированной системы прогнозирования ECMWF. Поверхность находится на уровне 0 см. Объем почвенной влаги связан с текстурой (или классификацией) почвы, глубиной залегания почвы и уровнем грунтовых вод. |
volumetric_soil_water_layer_2 | Объемная доля | 11132 метра | Объем воды во втором слое почвы (7-28 см) Интегрированной системы прогнозирования ЕСМВФ. |
volumetric_soil_water_layer_3 | Объемная доля | 11132 метра | Объем воды в третьем слое почвы (28-100 см) Интегрированной системы прогнозирования ЕСМВФ. |
volumetric_soil_water_layer_4 | Объемная доля | 11132 метра | Объем воды в 4-м слое почвы (100-289 см) Интегрированной системы прогнозирования ЕСМВФ. |
forecast_albedo | 11132 метра | Альбедо — это показатель отражательной способности поверхности Земли. Он представляет собой долю солнечного (коротковолнового) излучения, отражаемого поверхностью Земли во всем солнечном спектре, как прямого, так и рассеянного излучения. Значения находятся в диапазоне от 0 до 1. Как правило, снег и лед имеют высокую отражательную способность со значениями альбедо 0,8 и выше, суша имеет промежуточные значения от 0,1 до 0,4, а океан — низкие значения 0,1 или меньше. Излучение от Солнца (солнечное, или коротковолновое, излучение) частично отражается обратно в космос облаками и частицами в атмосфере (аэрозолями), а часть поглощается. Остальная часть падает на поверхность Земли, где часть отражается. Доля, отражаемая поверхностью Земли, зависит от альбедо. В интегрированной системе прогнозирования ECMWF (IFS) используется климатологическое фоновое альбедо (наблюдаемые значения, усредненные за несколько лет), модифицированное моделью для воды, льда и снега. Альбедо часто выражается в процентах (%). | |
surface_latent_heat_flux | Дж/м² | 11132 метра | Обмен скрытой теплотой с поверхностью происходит посредством турбулентной диффузии. Эта переменная накапливается с начала прогнозируемого времени до конца шага прогнозирования. По соглашению модели, нисходящие потоки считаются положительными. |
surface_net_solar_radiation | Дж/м² | 11132 метра | Количество солнечной радиации (также известной как коротковолновая радиация), достигающей поверхности Земли (как прямой, так и рассеянной), за вычетом количества, отраженного поверхностью Земли (которое определяется альбедо). Излучение от Солнца (солнечное, или коротковолновое, излучение) частично отражается обратно в космос облаками и частицами в атмосфере (аэрозолями), а часть поглощается. Остальная часть падает на поверхность Земли, где часть отражается. Разница между нисходящей и отраженной солнечной радиацией представляет собой чистую солнечную радиацию поверхности. Эта переменная накапливается с начала прогнозируемого времени до конца прогнозного шага. Единицы измерения — джоули на квадратный метр (Дж м⁻²). Для перевода в ватты на квадратный метр (Вт м⁻²) накопленные значения следует разделить на период накопления, выраженный в секундах. В соответствии с конвенцией ECMWF для вертикальных потоков, положительное значение указывается вниз. |
surface_net_thermal_radiation | Дж/м² | 11132 метра | Чистое тепловое излучение на поверхности. Накопленное поле от начала прогнозируемого времени до конца прогнозного шага. По соглашению модели, нисходящие потоки положительны. |
surface_sensible_heat_flux | Дж/м² | 11132 метра | Передача тепла между поверхностью Земли и атмосферой происходит за счет турбулентного движения воздуха (за исключением теплопередачи, вызванной конденсацией или испарением). Величина потока явного тепла определяется разностью температур между поверхностью и вышележащей атмосферой, скоростью ветра и шероховатостью поверхности. Например, холодный воздух над теплой поверхностью будет создавать поток явного тепла от суши (или океана) в атмосферу. Это одноуровневая переменная, которая накапливается с начала прогнозируемого времени до конца прогнозного шага. Единицы измерения — джоули на квадратный метр (Дж м⁻²). Для перевода в ватты на квадратный метр (Вт м⁻²) накопленные значения следует разделить на период накопления, выраженный в секундах. В соответствии с конвенцией ECMWF для вертикальных потоков, положительное значение направлено вниз. |
surface_solar_radiation_downwards | Дж/м² | 11132 метра | Количество солнечной радиации (также известной как коротковолновая радиация), достигающей поверхности Земли. Эта переменная включает в себя как прямую, так и рассеянную солнечную радиацию. Излучение от Солнца (солнечное, или коротковолновое, излучение) частично отражается обратно в космос облаками и частицами в атмосфере (аэрозолями), а часть поглощается. Остальная часть падает на поверхность Земли (представлена этой переменной). С достаточно хорошей степенью приближения эта переменная является модельным эквивалентом того, что измерялось бы пиранометром (прибором, используемым для измерения солнечной радиации) на поверхности. Однако следует проявлять осторожность при сравнении модельных переменных с наблюдениями, поскольку наблюдения часто являются локальными для определенной точки в пространстве и времени, а не представляют собой средние значения по ячейке модельной сетки и шагу моделирования по времени. Эта переменная накапливается с начала прогнозируемого времени до конца шага прогнозирования. Единицы измерения — джоули на квадратный метр (Дж м⁻²). Для перевода в ватты на квадратный метр (Вт м⁻²) накопленные значения следует разделить на период накопления, выраженный в секундах. Согласно конвенции ECMWF, вертикальные потоки имеют положительное направление вниз. |
surface_thermal_radiation_downwards | Дж/м² | 11132 метра | Количество теплового (также известного как длинноволновое или земное) излучения, испускаемого атмосферой и облаками и достигающего поверхности Земли. Поверхность Земли излучает тепловое излучение, часть которого поглощается атмосферой и облаками. Атмосфера и облака также излучают тепловое излучение во всех направлениях, часть которого достигает поверхности (представленной этой переменной). Эта переменная накапливается с начала прогнозируемого времени до конца прогнозного шага. Единицы измерения — джоули на квадратный метр (Дж м⁻²). Для перевода в ватты на квадратный метр (Вт м⁻²) накопленные значения следует разделить на период накопления, выраженный в секундах. В соответствии с соглашением ECMWF для вертикальных потоков положительное значение направлено вниз. |
evaporation_from_bare_soil | м водного эквивалента | 11132 метра | Количество испарения с голой почвы на поверхности земли. Эта переменная накапливается с начала прогнозируемого периода до конца прогнозируемого шага. |
evaporation_from_open_water_surfaces_excluding_oceans | м водного эквивалента | 11132 метра | Количество испарения с поверхностных водоемов, таких как озера и затопленные территории, за исключением океанов. Эта переменная накапливается с начала прогнозируемого периода до конца прогнозного шага. |
evaporation_from_the_top_of_canopy | м водного эквивалента | 11132 метра | Количество испарения из резервуара, перехватываемого растительным покровом в верхней части растительного покрова. Эта переменная накапливается с начала прогнозируемого периода до конца прогнозируемого шага. |
evaporation_from_vegetation_transpiration | м водного эквивалента | 11132 метра | Количество испарения в результате транспирации растительности. Это имеет то же значение, что и корневая экстракция, то есть количество воды, извлеченной из различных слоев почвы. Эта переменная накапливается с начала прогнозируемого периода до конца прогнозного шага. |
potential_evaporation | м | 11132 метра | Потенциальное испарение (ПЭ) в текущей модели ECMWF рассчитывается путем повторного вызова процедуры баланса поверхностной энергии с переменными растительности, установленными на «культуры/смешанное земледелие», и при условии отсутствия стресса от влажности почвы. Другими словами, испарение рассчитывается для сельскохозяйственных земель так, как если бы они были хорошо орошаемы, и при условии, что атмосфера не подвержена влиянию этих искусственных поверхностных условий. Последнее может быть не всегда реалистичным. Хотя ПЭ предназначено для оценки потребности в орошении, этот метод может давать нереалистичные результаты в засушливых условиях из-за слишком сильного испарения, вызванного сухим воздухом. Эта переменная накапливается с начала прогнозируемого времени до конца шага прогнозирования. |
runoff | м | 11132 метра | Часть воды, образующейся в результате дождя, таяния снега или из глубоких слоев почвы, остается в почве. В противном случае вода стекает либо по поверхности (поверхностный сток), либо под землей (подземный сток), и сумма этих двух потоков просто называется «стоком». Эта переменная представляет собой общее количество воды, накопленное с начала прогнозируемого времени до конца прогнозного шага. Единицы измерения стока — глубина в метрах. Это глубина, которую имела бы вода, если бы она была равномерно распределена по ячейке сетки. Следует проявлять осторожность при сравнении переменных модели с наблюдениями, поскольку наблюдения часто являются локальными для конкретной точки, а не усредненными по площади ячейки сетки. Наблюдения также часто проводятся в других единицах, например, мм/день, а не в накопленных метрах, как показано здесь. Сток — это показатель наличия воды в почве и может, например, использоваться в качестве индикатора засухи или наводнения. Более подробная информация о том, как рассчитывается сток, приведена в документации IFS Physical Processes. |
snow_evaporation | м водного эквивалента | 11132 метра | Испарение со снега, усредненное по ячейке сетки (для определения потока через снег разделите на долю снега). Эта переменная накапливается с начала прогнозируемого времени до конца шага прогнозирования. |
sub_surface_runoff | м | 11132 метра | Часть воды, образующейся в результате дождя, таяния снега или из глубоких слоев почвы, остается в почве. В противном случае вода стекает либо по поверхности (поверхностный сток), либо под землей (подземный сток), и сумма этих двух потоков просто называется «стоком». Эта переменная накапливается с начала прогнозируемого времени до конца шага прогнозирования. Единица измерения стока — глубина в метрах. Это глубина, которую имела бы вода, если бы она была равномерно распределена по ячейке сетки. Следует проявлять осторожность при сравнении переменных модели с наблюдениями, поскольку наблюдения часто являются локальными для конкретной точки, а не усредненными по площади ячейки сетки. Наблюдения также часто проводятся в других единицах, например, мм/день, а не в накопленных метрах, как показано здесь. Сток — это показатель наличия воды в почве и может, например, использоваться в качестве индикатора засухи или наводнения. Более подробная информация о том, как рассчитывается сток, приведена в документации IFS Physical Processes. |
surface_runoff | м | 11132 метра | Часть воды, образующейся в результате дождя, таяния снега или из глубоких слоев почвы, остается в почве. В противном случае вода стекает либо по поверхности (поверхностный сток), либо под землей (подземный сток), и сумма этих двух потоков просто называется «стоком». Эта переменная представляет собой общее количество воды, накопленное с начала прогнозируемого времени до конца прогнозного шага. Единицы измерения стока — глубина в метрах. Это глубина, которую имела бы вода, если бы она была равномерно распределена по ячейке сетки. Следует проявлять осторожность при сравнении переменных модели с наблюдениями, поскольку наблюдения часто являются локальными для конкретной точки, а не усредненными по площади ячейки сетки. Наблюдения также часто проводятся в других единицах, например, мм/день, а не в накопленных метрах, как показано здесь. Сток — это показатель наличия воды в почве и может, например, использоваться в качестве индикатора засухи или наводнения. Более подробная информация о том, как рассчитывается сток, приведена в документации IFS Physical Processes. |
total_evaporation | м водного эквивалента | 11132 метра | Накопленное количество воды, испарившейся с поверхности Земли, включая упрощенное представление транспирации (растительности), в виде пара в воздухе над ней. Эта переменная накапливается с начала прогноза до конца шага прогнозирования. В соответствии с общепринятой системой интегрированного прогнозирования ECMWF, нисходящие потоки считаются положительными. Следовательно, отрицательные значения указывают на испарение, а положительные — на конденсацию. |
u_component_of_wind_10m | РС | 11132 метра | Восточная составляющая ветра на высоте 10 м. Это горизонтальная скорость воздуха, движущегося на восток на высоте десяти метров над поверхностью Земли, в метрах в секунду. Следует проявлять осторожность при сравнении этой переменной с наблюдениями, поскольку данные о ветре изменяются в малых пространственных и временных масштабах и зависят от местного рельефа, растительности и зданий, которые в интегрированной системе прогнозирования ECMWF представлены лишь в среднем. Эта переменная может быть объединена с V-компонентой ветра на высоте 10 м, чтобы получить скорость и направление горизонтального ветра на высоте 10 м. |
v_component_of_wind_10m | РС | 11132 метра | Северная составляющая ветра на высоте 10 м. Это горизонтальная скорость воздуха, движущегося на север на высоте десяти метров над поверхностью Земли, в метрах в секунду. Следует проявлять осторожность при сравнении этой переменной с наблюдениями, поскольку данные о ветре изменяются в малых пространственных и временных масштабах и зависят от местного рельефа, растительности и зданий, которые в интегрированной системе прогнозирования ECMWF представлены лишь в среднем. Эта переменная может быть объединена с U-компонентой ветра на высоте 10 м, чтобы получить скорость и направление горизонтального ветра на высоте 10 м. |
surface_pressure | Па | 11132 метра | Давление (сила на единицу площади) атмосферы на поверхности суши, моря и внутренних водоемов. Это мера веса всего воздуха в вертикальном столбе над площадью поверхности Земли, представленной в фиксированной точке. Поверхностное давление часто используется в сочетании с температурой для расчета плотности воздуха. Сильные изменения давления с высотой затрудняют наблюдение за системами низкого и высокого давления над горными районами, поэтому для этой цели обычно используется среднее давление на уровне моря, а не поверхностное давление. Единицы измерения этой переменной — паскали (Па). Поверхностное давление часто измеряется в гектобарах (гПа), а иногда представляется в старых единицах — миллибарах (мб) (1 гПа = 1 мб = 100 Па). |
total_precipitation | м | 11132 метра | Накопленная жидкая и замерзшая вода, включая дождь и снег, выпадающая на поверхность Земли. Это сумма крупномасштабных осадков (осадков, образующихся в результате крупномасштабных погодных явлений, таких как ложбины низкого давления и холодные фронты) и конвективных осадков (образующихся в результате конвекции, которая происходит, когда воздух на нижних уровнях атмосферы теплее и менее плотный, чем воздух выше, и поэтому он поднимается). Переменные, характеризующие осадки, не включают туман, росу или осадки, испаряющиеся в атмосфере до того, как они достигнут поверхности Земли. Эта переменная накапливается с начала прогнозируемого времени до конца шага прогнозирования. Единицы измерения осадков — глубина в метрах. Это глубина, которую имела бы вода, если бы она была равномерно распределена по ячейке сетки. Следует проявлять осторожность при сравнении переменных модели с наблюдениями, поскольку наблюдения часто являются локальными для определенной точки в пространстве и времени, а не представляют собой средние значения по ячейке сетки модели и шагу моделирования. |
leaf_area_index_high_vegetation | Доля площади | 11132 метра | Половина общей площади зеленых листьев на единицу горизонтальной поверхности земли для высокорослого типа растительности. |
leaf_area_index_low_vegetation | Доля площади | 11132 метра | Половина общей площади зеленых листьев на единицу горизонтальной поверхности земли для низкорослых типов растительности. |
snowfall_hourly | м водного эквивалента | 11132 метра | Количество снегопадов, разложенное на почасовые значения, исходя из исходных кумулятивных показателей. |
snowmelt_hourly | м водного эквивалента | 11132 метра | Данные о таянии снега, полученные путем разложения исходных кумулятивных значений на почасовые значения, |
surface_latent_heat_flux_hourly | Дж/м² | 11132 метра | Поток скрытой теплоты на поверхности, дезагрегированный из исходных кумулятивных значений в почасовые значения. |
surface_net_solar_radiation_hourly | Дж/м² | 11132 метра | Чистая солнечная радиация на поверхности, разложенная из исходных кумулятивных значений на почасовые значения. |
surface_net_thermal_radiation_hourly | Дж/м² | 11132 метра | Поверхностное чистое тепловое излучение, разложенное из исходных кумулятивных значений на почасовые значения. |
surface_sensible_heat_flux_hourly | Дж/м² | 11132 метра | Поток явного тепла на поверхности, дезагрегированный из исходных кумулятивных значений в почасовые значения. |
surface_solar_radiation_downwards_hourly | Дж/м² | 11132 метра | Солнечное излучение поверхности вниз, разложенное из исходных кумулятивных значений на почасовые значения. |
surface_thermal_radiation_downwards_hourly | Дж/м² | 11132 метра | Тепловое излучение поверхности, направленное вниз, разложено из исходных кумулятивных значений на почасовые значения. |
evaporation_from_bare_soil_hourly | м водного эквивалента | 11132 метра | Испарение с голой почвы, разложенное из исходных кумулятивных значений на почасовые значения. |
evaporation_from_open_water_surfaces_excluding_oceans_hourly | м водного эквивалента | 11132 метра | Испарение с открытых водных поверхностей (за исключением океанов), детализированное из исходных кумулятивных значений в почасовые значения. |
evaporation_from_the_top_of_canopy_hourly | м водного эквивалента | 11132 метра | Испарение с вершины растительного покрова, разложенное из исходных кумулятивных значений на почасовые значения. |
evaporation_from_vegetation_transpiration_hourly | м водного эквивалента | 11132 метра | Испарение растительности, транспирация, разложенная из исходных кумулятивных значений на почасовые значения. |
potential_evaporation_hourly | м | 11132 метра | потенциальное испарение, разложенное из исходных кумулятивных значений на почасовые значения. |
runoff_hourly | м | 11132 метра | Объем стока, разложенный из исходных кумулятивных значений на почасовые значения. |
snow_evaporation_hourly | м водного эквивалента | 11132 метра | Испарение снега, разложенное из исходных кумулятивных значений на почасовые значения. |
sub_surface_runoff_hourly | м | 11132 метра | Подповерхностный сток, дезагрегированный из исходных кумулятивных значений в почасовые значения. |
surface_runoff_hourly | м | 11132 метра | Поверхностный сток, дезагрегированный из исходных кумулятивных значений в почасовые значения. |
total_evaporation_hourly | м водного эквивалента | 11132 метра | Общее испарение, разложенное из исходных кумулятивных значений на почасовые значения. |
total_precipitation_hourly | м | 11132 метра | Общее количество осадков, разложенное из исходных кумулятивных значений на почасовые значения. |
Свойства изображения
Свойства изображения
| Имя | Тип | Описание |
|---|---|---|
| час | ИНТ | Час дня |
Условия эксплуатации
Условия эксплуатации
Просим указывать источник использования ERA5-Land в соответствии с лицензионным соглашением Copernicus C3S/CAMS :
5.1.1. В случаях, когда Лицензиат передает или распространяет Продукты Copernicus среди общественности, он обязан уведомить получателей об источнике, используя следующее или любое аналогичное уведомление: «Сгенерировано с использованием информации Службы изменения климата Copernicus [Год]».
5.1.2. Если Лицензиат создает или предоставляет публикацию или распространение, содержащее адаптированные или модифицированные продукты Copernicus, Лицензиат обязан предоставить следующее или любое аналогичное уведомление: «Содержит модифицированную информацию службы Copernicus по изменению климата [Год]»;
В любой такой публикации или распространении, подпадающей под действие пунктов 5.1.1 и 5.1.2, должно быть указано, что ни Европейская комиссия, ни ЕЦМВФ не несут ответственности за любое использование содержащейся в ней информации или данных Copernicus.
Цитаты
Муньос Сабатер, Дж., (2019): Ежемесячные усредненные данные ERA5-Land с 1981 года по настоящее время. Хранилище климатических данных Copernicus Climate Change Service (C3S) (CDS). (<дата доступа>), doi:10.24381/cds.68d2bb30
Исследуйте мир с помощью Earth Engine.
Редактор кода (JavaScript)
var dataset = ee.ImageCollection('ECMWF/ERA5_LAND/HOURLY')
                .filter(ee.Filter.date('2020-07-01', '2020-07-02'));

var visualization = {
  bands: ['temperature_2m'],
  min: 250.0,
  max: 320.0,
  palette: [
    '000080', '0000d9', '4000ff', '8000ff', '0080ff', '00ffff',
    '00ff80', '80ff00', 'daff00', 'ffff00', 'fff500', 'ffda00',
    'ffb000', 'ffa400', 'ff4f00', 'ff2500', 'ff0a00', 'ff00ff',
  ]
};

Map.setCenter(22.2, 21.2, 0);

Map.addLayer(dataset, visualization, 'Air temperature [K] at 2m height');
import ee
import geemap.core as geemap
Colab (Python)
dataset = ee.ImageCollection('ECMWF/ERA5_LAND/HOURLY').filter(
    ee.Filter.date('2020-07-01', '2020-07-02')
)

visualization = {
    'bands': ['temperature_2m'],
    'min': 250.0,
    'max': 320.0,
    'palette': [
        '000080', '0000d9', '4000ff', '8000ff', '0080ff', '00ffff',
        '00ff80', '80ff00', 'daff00', 'ffff00', 'fff500', 'ffda00',
        'ffb000', 'ffa400', 'ff4f00', 'ff2500', 'ff0a00', 'ff00ff',
    ],
}

m = geemap.Map()
m.set_center(22.2, 21.2, 0)
m.add_layer(dataset, visualization, 'Air temperature [K] at 2m height')
m
- Доступность набора данных
- 1950-01-01T01:00:00Z–2026-09-01T23:00:00Z
- Производитель наборов данных
- Хранилище климатических данных Copernicus
- Каденция
- 1 час
- Теги
Описание
ERA5-Land — это набор данных реанализа, обеспечивающий согласованное представление об эволюции переменных, характеризующих сушу, на протяжении нескольких десятилетий с улучшенным разрешением по сравнению с ERA5. ERA5-Land был создан путем воспроизведения компонента суши из климатического реанализа ECMWF ERA5. Реанализ объединяет данные модели с наблюдениями со всего мира в глобально полный и согласованный набор данных, используя законы физики. Реанализ создает данные, охватывающие несколько десятилетий, обеспечивая точное описание климата прошлого. Этот набор данных включает все 50 переменных, доступных на CDS.
Данные ERA5-Land доступны в режиме реального времени за период с 1950 года по три месяца включительно.
Пожалуйста, ознакомьтесь с разделом «Известные проблемы» на сайте ERA5-Land . В частности, обратите внимание на то, что значения трех компонентов общего испарения поменяны местами следующим образом:
- Переменная «Испарение с голой почвы» (код параметра Mars 228101 (evabs)) имеет значения, соответствующие переменной «Испарение из растительности в результате транспирации» (параметр Mars 228103 (evavt)).
- Переменная «Испарение с открытых водных поверхностей, за исключением океанов» (код параметра Mars 228102 (evaow)) имеет значения, соответствующие переменной «Испарение с голой почвы» (код параметра Mars 228101 (evabs)).
- Переменная «Испарение из растительности» (код параметра Марса 228103 (evavt)) имеет значения, соответствующие переменной «Испарение с открытых водных поверхностей, за исключением океанов» (код параметра Марса 228102 (evaow)).
Обратите внимание, что используемая в ERA5-Land система учета накоплений отличается от системы для ERA5. Накопления обрабатываются так же, как и в ERA-Interim или ERA-Interim/Land, то есть они накапливаются с начала прогноза до конца шага прогнозирования. Это происходит в течение каждого дня и обнуляется в полночь. Дополнительную информацию см. на этой странице . Команда Earth Engine Data добавила 19 дополнительных диапазонов, по одному для каждого диапазона накопления, при этом почасовые значения вычисляются как разница между двумя последовательными шагами прогнозирования.
Группы
Группы
Размер пикселя: 11132 метра (все диапазоны)
| Имя | Единицы | Размер пикселя | Описание |
|---|---|---|---|
dewpoint_temperature_2m | К | 11132 метра | Temperature to which the air, at 2 meters above the surface of the Earth, would have to be cooled for saturation to occur. It is a measure of the humidity of the air. Combined with temperature and pressure, it can be used to calculate the relative humidity. 2m dew point temperature is calculated by interpolating between the lowest model level and the Earth's surface, taking account of the atmospheric conditions. |
temperature_2m | К | 11132 meters | Temperature of air at 2m above the surface of land, sea or in-land waters. 2m temperature is calculated by interpolating between the lowest model level and the Earth's surface, taking account of the atmospheric conditions. |
skin_temperature | К | 11132 meters | Temperature of the surface of the Earth. The skin temperature is the theoretical temperature that is required to satisfy the surface energy balance. It represents the temperature of the uppermost surface layer, which has no heat capacity and so can respond instantaneously to changes in surface fluxes. Skin temperature is calculated differently over land and sea. |
soil_temperature_level_1 | К | 11132 meters | Temperature of the soil in layer 1 (0 - 7 cm) of the ECMWF Integrated Forecasting System. The surface is at 0 cm. Soil temperature is set at the middle of each layer, and heat transfer is calculated at the interfaces between them. It is assumed that there is no heat transfer out of the bottom of the lowest layer. |
soil_temperature_level_2 | К | 11132 meters | Temperature of the soil in layer 2 (7-28 cm) of the ECMWF Integrated Forecasting System. |
soil_temperature_level_3 | К | 11132 meters | Temperature of the soil in layer 3 (28-100 cm) of the ECMWF Integrated Forecasting System. |
soil_temperature_level_4 | К | 11132 meters | Temperature of the soil in layer 4 (100-289 cm) of the ECMWF Integrated Forecasting System. |
lake_bottom_temperature | К | 11132 meters | Temperature of water at the bottom of inland water bodies (lakes, reservoirs, rivers) and coastal waters. ECMWF implemented a lake model in May 2015 to represent the water temperature and lake ice of all the world's major inland water bodies in the Integrated Forecasting System. The model keeps lake depth and surface area (or fractional cover) constant in time. |
lake_ice_depth | м | 11132 meters | The thickness of ice on inland water bodies (lakes, reservoirs and rivers) and coastal waters. The ECMWF Integrated Forecasting System (IFS) represents the formation and melting of ice on inland water bodies (lakes, reservoirs and rivers) and coastal water. A single ice layer is represented. This parameter is the thickness of that ice layer. |
lake_ice_temperature | К | 11132 meters | The temperature of the uppermost surface of ice on inland water bodies (lakes, reservoirs, rivers) and coastal waters. The ECMWF Integrated Forecasting System represents the formation and melting of ice on lakes. A single ice layer is represented. |
lake_mix_layer_depth | м | 11132 meters | The thickness of the upper most layer of an inland water body (lake, reservoirs, and rivers) or coastal waters that is well mixed and has a near constant temperature with depth (uniform distribution of temperature). The ECMWF Integrated Forecasting System represents inland water bodies with two layers in the vertical, the mixed layer above and the thermocline below. Thermoclines upper boundary is located at the mixed layer bottom, and the lower boundary at the lake bottom. Mixing within the mixed layer can occur when the density of the surface (and near-surface) water is greater than that of the water below. Mixing can also occur through the action of wind on the surface of the lake. |
lake_mix_layer_temperature | К | 11132 meters | The temperature of the upper most layer of inland water bodies (lakes, reservoirs and rivers) or coastal waters) that is well mixed. The ECMWF Integrated Forecasting System represents inland water bodies with two layers in the vertical, the mixed layer above and the thermocline below. Thermoclines upper boundary is located at the mixed layer bottom, and the lower boundary at the lake bottom. Mixing within the mixed layer can occur when the density of the surface (and near-surface) water is greater than that of the water below. Mixing can also occur through the action of wind on the surface of the lake. |
lake_shape_factor | 11132 meters | This parameter describes the way that temperature changes with depth in the thermocline layer of inland water bodies (lakes, reservoirs and rivers) and coastal waters. It is used to calculate the lake bottom temperature and other lake-related parameters. The ECMWF Integrated Forecasting System represents inland and coastal water bodies with two layers in the vertical, the mixed layer above and the thermocline below where temperature changes with depth. | |
lake_total_layer_temperature | К | 11132 meters | The mean temperature of total water column in inland water bodies (lakes, reservoirs and rivers) and coastal waters. The ECMWF Integrated Forecasting System represents inland water bodies with two layers in the vertical, the mixed layer above and the thermocline below where temperature changes with depth. This parameter is the mean over the two layers. |
snow_albedo | 11132 meters | It is defined as the fraction of solar (shortwave) radiation reflected by the snow, across the solar spectrum, for both direct and diffuse radiation. It is a measure of the reflectivity of the snow covered grid cells. Values vary between 0 and 1. Typically, snow and ice have high reflectivity with albedo values of 0.8 and above. | |
snow_cover | 11132 meters | It represents the fraction (0-1) of the cell / grid-box occupied by snow (similar to the cloud cover fields of ERA5). | |
snow_density | кг/м³ | 11132 meters | Mass of snow per cubic meter in the snow layer. The ECMWF Integrated Forecast System (IFS) model represents snow as a single additional layer over the uppermost soil level. The snow may cover all or part of the grid box. |
snow_depth | м | 11132 meters | Instantaneous grid-box average of the snow thickness on the ground (excluding snow on canopy). |
snow_depth_water_equivalent | m of water equivalent | 11132 meters | Depth of snow from the snow-covered area of a grid box. Its units are meters of water equivalent, so it is the depth the water would have if the snow melted and was spread evenly over the whole grid box. The ECMWF Integrated Forecast System represents snow as a single additional layer over the uppermost soil level. The snow may cover all or part of the grid box. |
snowfall | m of water equivalent | 11132 meters | Accumulated total snow that has fallen to the Earth's surface. It consists of snow due to the large-scale atmospheric flow (horizontal scales greater than around a few hundred meters) and convection where smaller scale areas (around 5km to a few hundred kilometers) of warm air rise. If snow has melted during the period over which this variable was accumulated, then it will be higher than the snow depth. This variable is the total amount of water accumulated from the beginning of the forecast time to the end of the forecast step. The units given measure the depth the water would have if the snow melted and was spread evenly over the grid box. Care should be taken when comparing model variables with observations, because observations are often local to a particular point in space and time, rather than representing averages over a model grid box and model time step. |
snowmelt | m of water equivalent | 11132 meters | Melting of snow averaged over the grid box (to find melt over snow, divide by snow fraction). This variable is accumulated from the beginning of the forecast time to the end of the forecast step. |
temperature_of_snow_layer | К | 11132 meters | This variable gives the temperature of the snow layer from the ground to the snow-air interface. The ECMWF Integrated Forecast System (IFS) model represents snow as a single additional layer over the uppermost soil level. The snow may cover all or part of the grid box. |
skin_reservoir_content | m of water equivalent | 11132 meters | Amount of water in the vegetation canopy and/or in a thin layer on the soil. It represents the amount of rain intercepted by foliage, and water from dew. The maximum amount of 'skin reservoir content' a grid box can hold depends on the type of vegetation, and may be zero. Water leaves the 'skin reservoir' by evaporation. |
volumetric_soil_water_layer_1 | Объемная доля | 11132 meters | Volume of water in soil layer 1 (0 - 7 cm) of the ECMWF Integrated Forecasting System. The surface is at 0 cm. The volumetric soil water is associated with the soil texture (or classification), soil depth, and the underlying groundwater level. |
volumetric_soil_water_layer_2 | Объемная доля | 11132 meters | Volume of water in soil layer 2 (7 -28 cm) of the ECMWF Integrated Forecasting System. |
volumetric_soil_water_layer_3 | Объемная доля | 11132 meters | Volume of water in soil layer 3 (28-100 cm) of the ECMWF Integrated Forecasting System. |
volumetric_soil_water_layer_4 | Объемная доля | 11132 meters | Volume of water in soil layer 4 (100-289 cm) of the ECMWF Integrated Forecasting System. |
forecast_albedo | 11132 meters | Is a measure of the reflectivity of the Earth's surface. It is the fraction of solar (shortwave) radiation reflected by Earth's surface, across the solar spectrum, for both direct and diffuse radiation. Values are between 0 and 1. Typically, snow and ice have high reflectivity with albedo values of 0.8 and above, land has intermediate values between about 0.1 and 0.4 and the ocean has low values of 0.1 or less. Radiation from the Sun (solar, or shortwave, radiation) is partly reflected back to space by clouds and particles in the atmosphere (aerosols) and some of it is absorbed. The rest is incident on the Earth's surface, where some of it is reflected. The portion that is reflected by the Earth's surface depends on the albedo. In the ECMWF Integrated Forecasting System (IFS), a climatological background albedo (observed values averaged over a period of several years) is used, modified by the model over water, ice and snow. Albedo is often shown as a percentage (%). | |
surface_latent_heat_flux | J/m^2 | 11132 meters | Exchange of latent heat with the surface through turbulent diffusion. This variables is accumulated from the beginning of the forecast time to the end of the forecast step. By model convention, downward fluxes are positive. |
surface_net_solar_radiation | J/m^2 | 11132 meters | Amount of solar radiation (also known as shortwave radiation) reaching the surface of the Earth (both direct and diffuse) minus the amount reflected by the Earth's surface (which is governed by the albedo). Radiation from the Sun (solar, or shortwave, radiation) is partly reflected back to space by clouds and particles in the atmosphere (aerosols) and some of it is absorbed. The rest is incident on the Earth's surface, where some of it is reflected. The difference between downward and reflected solar radiation is the surface net solar radiation. This variable is accumulated from the beginning of the forecast time to the end of the forecast step. The units are joules per square meter (J m-2). To convert to watts per square meter (W m-2), the accumulated values should be divided by the accumulation period expressed in seconds. The ECMWF convention for vertical fluxes is positive downwards. |
surface_net_thermal_radiation | J/m^2 | 11132 meters | Net thermal radiation at the surface. Accumulated field from the beginning of the forecast time to the end of the forecast step. By model convention downward fluxes are positive. |
surface_sensible_heat_flux | J/m^2 | 11132 meters | Transfer of heat between the Earth's surface and the atmosphere through the effects of turbulent air motion (but excluding any heat transfer resulting from condensation or evaporation). The magnitude of the sensible heat flux is governed by the difference in temperature between the surface and the overlying atmosphere, wind speed and the surface roughness. For example, cold air overlying a warm surface would produce a sensible heat flux from the land (or ocean) into the atmosphere. This is a single level variable and it is accumulated from the beginning of the forecast time to the end of the forecast step. The units are joules per square meter (J m-2). To convert to watts per square meter (W m-2), the accumulated values should be divided by the accumulation period expressed in seconds. The ECMWF convention for vertical fluxes is positive downwards. |
surface_solar_radiation_downwards | J/m^2 | 11132 meters | Amount of solar radiation (also known as shortwave radiation) reaching the surface of the Earth. This variable comprises both direct and diffuse solar radiation. Radiation from the Sun (solar, or shortwave, radiation) is partly reflected back to space by clouds and particles in the atmosphere (aerosols) and some of it is absorbed. The rest is incident on the Earth's surface (represented by this variable). To a reasonably good approximation, this variable is the model equivalent of what would be measured by a pyranometer (an instrument used for measuring solar radiation) at the surface. However, care should be taken when comparing model variables with observations, because observations are often local to a particular point in space and time, rather than representing averages over a model grid box and model time step. This variable is accumulated from the beginning of the forecast time to the end of the forecast step. The units are joules per square meter (J m-2). To convert to watts per square meter (W m-2), the accumulated values should be divided by the accumulation period expressed in seconds. The ECMWF convention for vertical fluxes is positive downwards. |
surface_thermal_radiation_downwards | J/m^2 | 11132 meters | Amount of thermal (also known as longwave or terrestrial) radiation emitted by the atmosphere and clouds that reaches the Earth's surface. The surface of the Earth emits thermal radiation, some of which is absorbed by the atmosphere and clouds. The atmosphere and clouds likewise emit thermal radiation in all directions, some of which reaches the surface (represented by this variable). This variable is accumulated from the beginning of the forecast time to the end of the forecast step. The units are joules per square meter (J m-2). To convert to watts per square meter (W m-2), the accumulated values should be divided by the accumulation period expressed in seconds. The ECMWF convention for vertical fluxes is positive downwards. |
evaporation_from_bare_soil | m of water equivalent | 11132 meters | The amount of evaporation from bare soil at the top of the land surface. This variable is accumulated from the beginning of the forecast time to the end of the forecast step. |
evaporation_from_open_water_surfaces_excluding_oceans | m of water equivalent | 11132 meters | Amount of evaporation from surface water storage like lakes and inundated areas but excluding oceans. This variable is accumulated from the beginning of the forecast time to the end of the forecast step. |
evaporation_from_the_top_of_canopy | m of water equivalent | 11132 meters | The amount of evaporation from the canopy interception reservoir at the top of the canopy. This variable is accumulated from the beginning of the forecast time to the end of the forecast step. |
evaporation_from_vegetation_transpiration | m of water equivalent | 11132 meters | Amount of evaporation from vegetation transpiration. This has the same meaning as root extraction ie the amount of water extracted from the different soil layers. This variable is accumulated from the beginning of the forecast time to the end of the forecast step. |
potential_evaporation | м | 11132 meters | Potential evaporation (pev) in the current ECMWF model is computed, by making a second call to the surface energy balance routine with the vegetation variables set to "crops/mixed farming" and assuming no stress from soil moisture. In other words, evaporation is computed for agricultural land as if it is well watered and assuming that the atmosphere is not affected by this artificial surface condition. The latter may not always be realistic. Although pev is meant to provide an estimate of irrigation requirements, the method can give unrealistic results in arid conditions due to too strong evaporation forced by dry air. This variable is accumulated from the beginning of the forecast time to the end of the forecast step. |
runoff | м | 11132 meters | Some water from rainfall, melting snow, or deep in the soil, stays stored in the soil. Otherwise, the water drains away, either over the surface (surface runoff), or under the ground (sub-surface runoff) and the sum of these two is simply called 'runoff'. This variable is the total amount of water accumulated from the beginning of the forecast time to the end of the forecast step. The units of runoff are depth in meters. This is the depth the water would have if it were spread evenly over the grid box. Care should be taken when comparing model variables with observations, because observations are often local to a particular point rather than averaged over a grid square area. Observations are also often taken in different units, such as mm/day, rather than the accumulated meters produced here. Runoff is a measure of the availability of water in the soil, and can, for example, be used as an indicator of drought or flood. More information about how runoff is calculated is given in the IFS Physical Processes documentation. |
snow_evaporation | m of water equivalent | 11132 meters | Evaporation from snow averaged over the grid box (to find flux over snow, divide by snow fraction). This variable is accumulated from the beginning of the forecast time to the end of the forecast step. |
sub_surface_runoff | м | 11132 meters | Some water from rainfall, melting snow, or deep in the soil, stays stored in the soil. Otherwise, the water drains away, either over the surface (surface runoff), or under the ground(sub-surface runoff) and the sum of these two is simply called 'runoff'. This variable is accumulated from the beginning of the forecast time to the end of the forecast step. The units of runoff are depth in meters. This is the depth the water would have if it were spread evenly over the grid box. Care should be taken when comparing model variables with observations, because observations are often local to a particular point rather than averaged over a grid square area. Observations are also often taken in different units, such as mm/day, rather than the accumulated meters produced here. Runoff is a measure of the availability of water in the soil, and can, for example, be used as an indicator of drought or flood. More information about how runoff is calculated is given in the IFS Physical Processes documentation. |
surface_runoff | м | 11132 meters | Some water from rainfall, melting snow, or deep in the soil, stays stored in the soil. Otherwise, the water drains away, either over the surface (surface runoff), or under the ground (sub-surface runoff) and the sum of these two is simply called 'runoff'. This variable is the total amount of water accumulated from the beginning of the forecast time to the end of the forecast step. The units of runoff are depth in meters. This is the depth the water would have if it were spread evenly over the grid box. Care should be taken when comparing model variables with observations, because observations are often local to a particular point rather than averaged over a grid square area. Observations are also often taken in different units, such as mm/day, rather than the accumulated meters produced here. Runoff is a measure of the availability of water in the soil, and can, for example, be used as an indicator of drought or flood. More information about how runoff is calculated is given in the IFS Physical Processes documentation. |
total_evaporation | m of water equivalent | 11132 meters | Accumulated amount of water that has evaporated from the Earth's surface, including a simplified representation of transpiration (from vegetation), into vapor in the air above. This variable is accumulated from the beginning of the forecast to the end of the forecast step. The ECMWF Integrated Forecasting System convention is that downward fluxes are positive. Therefore, negative values indicate evaporation and positive values indicate condensation. |
u_component_of_wind_10m | РС | 11132 meters | Eastward component of the 10m wind. It is the horizontal speed of air moving towards the east, at a height of ten meters above the surface of the Earth, in meters per second. Care should be taken when comparing this variable with observations, because wind observations vary on small space and time scales and are affected by the local terrain, vegetation and buildings that are represented only on average in the ECMWF Integrated Forecasting System. This variable can be combined with the V component of 10m wind to give the speed and direction of the horizontal 10m wind. |
v_component_of_wind_10m | РС | 11132 meters | Northward component of the 10m wind. It is the horizontal speed of air moving towards the north, at a height of ten meters above the surface of the Earth, in meters per second. Care should be taken when comparing this variable with observations, because wind observations vary on small space and time scales and are affected by the local terrain, vegetation and buildings that are represented only on average in the ECMWF Integrated Forecasting System. This variable can be combined with the U component of 10m wind to give the speed and direction of the horizontal 10m wind. |
surface_pressure | Па | 11132 meters | Pressure (force per unit area) of the atmosphere on the surface of land, sea and in-land water. It is a measure of the weight of all the air in a column vertically above the area of the Earth's surface represented at a fixed point. Surface pressure is often used in combination with temperature to calculate air density. The strong variation of pressure with altitude makes it difficult to see the low and high pressure systems over mountainous areas, so mean sea level pressure, rather than surface pressure, is normally used for this purpose. The units of this variable are Pascals (Pa). Surface pressure is often measured in hPa and sometimes is presented in the old units of millibars, mb (1 hPa = 1 mb = 100 Pa). |
total_precipitation | м | 11132 meters | Accumulated liquid and frozen water, including rain and snow, that falls to the Earth's surface. It is the sum of large-scale precipitation (that precipitation which is generated by large-scale weather patterns, such as troughs and cold fronts) and convective precipitation (generated by convection which occurs when air at lower levels in the atmosphere is warmer and less dense than the air above, so it rises). Precipitation variables do not include fog, dew or the precipitation that evaporates in the atmosphere before it lands at the surface of the Earth. This variable is accumulated from the beginning of the forecast time to the end of the forecast step. The units of precipitation are depth in meters. It is the depth the water would have if it were spread evenly over the grid box. Care should be taken when comparing model variables with observations, because observations are often local to a particular point in space and time, rather than representing averages over a model grid box and model time step. |
leaf_area_index_high_vegetation | Area fraction | 11132 meters | One-half of the total green leaf area per unit horizontal ground surface area for high vegetation type. |
leaf_area_index_low_vegetation | Area fraction | 11132 meters | One-half of the total green leaf area per unit horizontal ground surface area for low vegetation type. |
snowfall_hourly | m of water equivalent | 11132 meters | snowfall disaggregated from the original cumulative values into hourly values |
snowmelt_hourly | m of water equivalent | 11132 meters | snowmelt disaggregated from the original cumulative values into hourly values |
surface_latent_heat_flux_hourly | J/m^2 | 11132 meters | surface latent heat flux disaggregated from the original cumulative values into hourly values |
surface_net_solar_radiation_hourly | J/m^2 | 11132 meters | surface net solar radiation disaggregated from the original cumulative values into hourly values |
surface_net_thermal_radiation_hourly | J/m^2 | 11132 meters | surface net thermal radiation disaggregated from the original cumulative values into hourly values |
surface_sensible_heat_flux_hourly | J/m^2 | 11132 meters | surface sensible heat flux disaggregated from the original cumulative values into hourly values |
surface_solar_radiation_downwards_hourly | J/m^2 | 11132 meters | surface solar radiation downwards disaggregated from the original cumulative values into hourly values |
surface_thermal_radiation_downwards_hourly | J/m^2 | 11132 meters | surface thermal radiation downwards disaggregated from the original cumulative values into hourly values |
evaporation_from_bare_soil_hourly | m of water equivalent | 11132 meters | evaporation from bare soil disaggregated from the original cumulative values into hourly values |
evaporation_from_open_water_surfaces_excluding_oceans_hourly | m of water equivalent | 11132 meters | evaporation from open water surfaces excluding oceans disaggregated from the original cumulative values into hourly values |
evaporation_from_the_top_of_canopy_hourly | m of water equivalent | 11132 meters | evaporation from the top of canopy disaggregated from the original cumulative values into hourly values |
evaporation_from_vegetation_transpiration_hourly | m of water equivalent | 11132 meters | evaporation from vegetation transpiration disaggregated from the original cumulative values into hourly values |
potential_evaporation_hourly | м | 11132 meters | potential evaporation disaggregated from the original cumulative values into hourly values |
runoff_hourly | м | 11132 meters | runoff disaggregated from the original cumulative values into hourly values |
snow_evaporation_hourly | m of water equivalent | 11132 meters | snow evaporation disaggregated from the original cumulative values into hourly values |
sub_surface_runoff_hourly | м | 11132 meters | sub surface runoff disaggregated from the original cumulative values into hourly values |
surface_runoff_hourly | м | 11132 meters | surface runoff disaggregated from the original cumulative values into hourly values |
total_evaporation_hourly | m of water equivalent | 11132 meters | total evaporation disaggregated from the original cumulative values into hourly values |
total_precipitation_hourly | м | 11132 meters | total precipitation disaggregated from the original cumulative values into hourly values |
Свойства изображения
Свойства изображения
| Имя | Тип | Описание |
|---|---|---|
| час | ИНТ | Hour of the day |
Условия эксплуатации
Условия эксплуатации
Please acknowledge the use of ERA5-Land as stated in the Copernicus C3S/CAMS License agreement :
5.1.1 Where the Licensee communicates or distributes Copernicus Products to the public, the Licensee shall inform the recipients of the source by using the following or any similar notice: 'Generated using Copernicus Climate Change Service Information [Year]'.
5.1.2 Where the Licensee makes or contributes to a publication or distribution containing adapted or modified Copernicus Products, the Licensee shall provide the following or any similar notice: 'Contains modified Copernicus Climate Change Service Information [Year]';
Any such publication or distribution covered by clauses 5.1.1 and 5.1.2 shall state that neither the European Commission nor ECMWF is responsible for any use that may be made of the Copernicus Information or Data it contains.
Цитаты
Muñoz Sabater, J., (2019): ERA5-Land monthly averaged data from 1981 to present. Copernicus Climate Change Service (C3S) Climate Data Store (CDS). (<date of access>), doi:10.24381/cds.68d2bb30
Исследуйте мир с помощью Earth Engine.
Редактор кода (JavaScript)
var dataset = ee.ImageCollection('ECMWF/ERA5_LAND/HOURLY')
                .filter(ee.Filter.date('2020-07-01', '2020-07-02'));

var visualization = {
  bands: ['temperature_2m'],
  min: 250.0,
  max: 320.0,
  palette: [
    '000080', '0000d9', '4000ff', '8000ff', '0080ff', '00ffff',
    '00ff80', '80ff00', 'daff00', 'ffff00', 'fff500', 'ffda00',
    'ffb000', 'ffa400', 'ff4f00', 'ff2500', 'ff0a00', 'ff00ff',
  ]
};

Map.setCenter(22.2, 21.2, 0);

Map.addLayer(dataset, visualization, 'Air temperature [K] at 2m height');
import ee
import geemap.core as geemap
Colab (Python)
dataset = ee.ImageCollection('ECMWF/ERA5_LAND/HOURLY').filter(
    ee.Filter.date('2020-07-01', '2020-07-02')
)

visualization = {
    'bands': ['temperature_2m'],
    'min': 250.0,
    'max': 320.0,
    'palette': [
        '000080', '0000d9', '4000ff', '8000ff', '0080ff', '00ffff',
        '00ff80', '80ff00', 'daff00', 'ffff00', 'fff500', 'ffda00',
        'ffb000', 'ffa400', 'ff4f00', 'ff2500', 'ff0a00', 'ff00ff',
    ],
}

m = geemap.Map()
m.set_center(22.2, 21.2, 0)
m.add_layer(dataset, visualization, 'Air temperature [K] at 2m height')
m
- Доступность набора данных
- 1950-01-01T01:00:00Z–2026-09-01T23:00:00Z
- Производитель наборов данных
- Хранилище климатических данных Copernicus
- Каденция
- 1 час
- Теги
Описание
ERA5-Land is a reanalysis dataset providing a consistent view of the evolution of land variables over several decades at an enhanced resolution compared to ERA5. ERA5-Land has been produced by replaying the land component of the ECMWF ERA5 climate reanalysis. Reanalysis combines model data with observations from across the world into a globally complete and consistent dataset using the laws of physics. Reanalysis produces data that goes several decades back in time, providing an accurate description of the climate of the past. This dataset includes all 50 variables as available on CDS.
ERA5-Land data is available from 1950 to three months from real-time.
Please consult the ERA5-Land "Known Issues" section . In particular, note that three components of the total evapotranspiration have values swapped as follows:
- variable "Evaporation from bare soil" (mars parameter code 228101 (evabs)) has the values corresponding to the "Evaporation from vegetation transpiration" (mars parameter 228103 (evavt)),
- variable "Evaporation from open water surfaces excluding oceans (mars parameter code 228102 (evaow)) has the values corresponding to the "Evaporation from bare soil" (mars parameter code 228101 (evabs)),
- variable "Evaporation from vegetation transpiration" (mars parameter code 228103 (evavt)) has the values corresponding to the "Evaporation from open water surfaces excluding oceans" (mars parameter code 228102 (evaow)).
Please note that the convention for accumulations used in ERA5-Land differs with that for ERA5. The accumulations are treated the same as those in ERA-Interim or ERA-Interim/Land, ie, they are accumulated from the beginning of the forecast to the end of the forecast step. This happens within every day and gets reset on midnight. See this page for more information . The Earth Engine Data team added 19 additional bands, one for each of the accumulation bands, with the hourly values computed as the difference between two consecutive forecast steps.
Группы
Группы
Pixel size: 11132 meters (all bands)
| Имя | Единицы | Размер пикселя | Описание |
|---|---|---|---|
dewpoint_temperature_2m | К | 11132 meters | Temperature to which the air, at 2 meters above the surface of the Earth, would have to be cooled for saturation to occur. It is a measure of the humidity of the air. Combined with temperature and pressure, it can be used to calculate the relative humidity. 2m dew point temperature is calculated by interpolating between the lowest model level and the Earth's surface, taking account of the atmospheric conditions. |
temperature_2m | К | 11132 meters | Temperature of air at 2m above the surface of land, sea or in-land waters. 2m temperature is calculated by interpolating between the lowest model level and the Earth's surface, taking account of the atmospheric conditions. |
skin_temperature | К | 11132 meters | Temperature of the surface of the Earth. The skin temperature is the theoretical temperature that is required to satisfy the surface energy balance. It represents the temperature of the uppermost surface layer, which has no heat capacity and so can respond instantaneously to changes in surface fluxes. Skin temperature is calculated differently over land and sea. |
soil_temperature_level_1 | К | 11132 meters | Temperature of the soil in layer 1 (0 - 7 cm) of the ECMWF Integrated Forecasting System. The surface is at 0 cm. Soil temperature is set at the middle of each layer, and heat transfer is calculated at the interfaces between them. It is assumed that there is no heat transfer out of the bottom of the lowest layer. |
soil_temperature_level_2 | К | 11132 meters | Temperature of the soil in layer 2 (7-28 cm) of the ECMWF Integrated Forecasting System. |
soil_temperature_level_3 | К | 11132 meters | Temperature of the soil in layer 3 (28-100 cm) of the ECMWF Integrated Forecasting System. |
soil_temperature_level_4 | К | 11132 meters | Temperature of the soil in layer 4 (100-289 cm) of the ECMWF Integrated Forecasting System. |
lake_bottom_temperature | К | 11132 meters | Temperature of water at the bottom of inland water bodies (lakes, reservoirs, rivers) and coastal waters. ECMWF implemented a lake model in May 2015 to represent the water temperature and lake ice of all the world's major inland water bodies in the Integrated Forecasting System. The model keeps lake depth and surface area (or fractional cover) constant in time. |
lake_ice_depth | м | 11132 meters | The thickness of ice on inland water bodies (lakes, reservoirs and rivers) and coastal waters. The ECMWF Integrated Forecasting System (IFS) represents the formation and melting of ice on inland water bodies (lakes, reservoirs and rivers) and coastal water. A single ice layer is represented. This parameter is the thickness of that ice layer. |
lake_ice_temperature | К | 11132 meters | The temperature of the uppermost surface of ice on inland water bodies (lakes, reservoirs, rivers) and coastal waters. The ECMWF Integrated Forecasting System represents the formation and melting of ice on lakes. A single ice layer is represented. |
lake_mix_layer_depth | м | 11132 meters | The thickness of the upper most layer of an inland water body (lake, reservoirs, and rivers) or coastal waters that is well mixed and has a near constant temperature with depth (uniform distribution of temperature). The ECMWF Integrated Forecasting System represents inland water bodies with two layers in the vertical, the mixed layer above and the thermocline below. Thermoclines upper boundary is located at the mixed layer bottom, and the lower boundary at the lake bottom. Mixing within the mixed layer can occur when the density of the surface (and near-surface) water is greater than that of the water below. Mixing can also occur through the action of wind on the surface of the lake. |
lake_mix_layer_temperature | К | 11132 meters | The temperature of the upper most layer of inland water bodies (lakes, reservoirs and rivers) or coastal waters) that is well mixed. The ECMWF Integrated Forecasting System represents inland water bodies with two layers in the vertical, the mixed layer above and the thermocline below. Thermoclines upper boundary is located at the mixed layer bottom, and the lower boundary at the lake bottom. Mixing within the mixed layer can occur when the density of the surface (and near-surface) water is greater than that of the water below. Mixing can also occur through the action of wind on the surface of the lake. |
lake_shape_factor | 11132 meters | This parameter describes the way that temperature changes with depth in the thermocline layer of inland water bodies (lakes, reservoirs and rivers) and coastal waters. It is used to calculate the lake bottom temperature and other lake-related parameters. The ECMWF Integrated Forecasting System represents inland and coastal water bodies with two layers in the vertical, the mixed layer above and the thermocline below where temperature changes with depth. | |
lake_total_layer_temperature | К | 11132 meters | The mean temperature of total water column in inland water bodies (lakes, reservoirs and rivers) and coastal waters. The ECMWF Integrated Forecasting System represents inland water bodies with two layers in the vertical, the mixed layer above and the thermocline below where temperature changes with depth. This parameter is the mean over the two layers. |
snow_albedo | 11132 meters | It is defined as the fraction of solar (shortwave) radiation reflected by the snow, across the solar spectrum, for both direct and diffuse radiation. It is a measure of the reflectivity of the snow covered grid cells. Values vary between 0 and 1. Typically, snow and ice have high reflectivity with albedo values of 0.8 and above. | |
snow_cover | 11132 meters | It represents the fraction (0-1) of the cell / grid-box occupied by snow (similar to the cloud cover fields of ERA5). | |
snow_density | кг/м³ | 11132 meters | Mass of snow per cubic meter in the snow layer. The ECMWF Integrated Forecast System (IFS) model represents snow as a single additional layer over the uppermost soil level. The snow may cover all or part of the grid box. |
snow_depth | м | 11132 meters | Instantaneous grid-box average of the snow thickness on the ground (excluding snow on canopy). |
snow_depth_water_equivalent | m of water equivalent | 11132 meters | Depth of snow from the snow-covered area of a grid box. Its units are meters of water equivalent, so it is the depth the water would have if the snow melted and was spread evenly over the whole grid box. The ECMWF Integrated Forecast System represents snow as a single additional layer over the uppermost soil level. The snow may cover all or part of the grid box. |
snowfall | m of water equivalent | 11132 meters | Accumulated total snow that has fallen to the Earth's surface. It consists of snow due to the large-scale atmospheric flow (horizontal scales greater than around a few hundred meters) and convection where smaller scale areas (around 5km to a few hundred kilometers) of warm air rise. If snow has melted during the period over which this variable was accumulated, then it will be higher than the snow depth. This variable is the total amount of water accumulated from the beginning of the forecast time to the end of the forecast step. The units given measure the depth the water would have if the snow melted and was spread evenly over the grid box. Care should be taken when comparing model variables with observations, because observations are often local to a particular point in space and time, rather than representing averages over a model grid box and model time step. |
snowmelt | m of water equivalent | 11132 meters | Melting of snow averaged over the grid box (to find melt over snow, divide by snow fraction). This variable is accumulated from the beginning of the forecast time to the end of the forecast step. |
temperature_of_snow_layer | К | 11132 meters | This variable gives the temperature of the snow layer from the ground to the snow-air interface. The ECMWF Integrated Forecast System (IFS) model represents snow as a single additional layer over the uppermost soil level. The snow may cover all or part of the grid box. |
skin_reservoir_content | m of water equivalent | 11132 meters | Amount of water in the vegetation canopy and/or in a thin layer on the soil. It represents the amount of rain intercepted by foliage, and water from dew. The maximum amount of 'skin reservoir content' a grid box can hold depends on the type of vegetation, and may be zero. Water leaves the 'skin reservoir' by evaporation. |
volumetric_soil_water_layer_1 | Объемная доля | 11132 meters | Volume of water in soil layer 1 (0 - 7 cm) of the ECMWF Integrated Forecasting System. The surface is at 0 cm. The volumetric soil water is associated with the soil texture (or classification), soil depth, and the underlying groundwater level. |
volumetric_soil_water_layer_2 | Объемная доля | 11132 meters | Volume of water in soil layer 2 (7 -28 cm) of the ECMWF Integrated Forecasting System. |
volumetric_soil_water_layer_3 | Объемная доля | 11132 meters | Volume of water in soil layer 3 (28-100 cm) of the ECMWF Integrated Forecasting System. |
volumetric_soil_water_layer_4 | Объемная доля | 11132 meters | Volume of water in soil layer 4 (100-289 cm) of the ECMWF Integrated Forecasting System. |
forecast_albedo | 11132 meters | Is a measure of the reflectivity of the Earth's surface. It is the fraction of solar (shortwave) radiation reflected by Earth's surface, across the solar spectrum, for both direct and diffuse radiation. Values are between 0 and 1. Typically, snow and ice have high reflectivity with albedo values of 0.8 and above, land has intermediate values between about 0.1 and 0.4 and the ocean has low values of 0.1 or less. Radiation from the Sun (solar, or shortwave, radiation) is partly reflected back to space by clouds and particles in the atmosphere (aerosols) and some of it is absorbed. The rest is incident on the Earth's surface, where some of it is reflected. The portion that is reflected by the Earth's surface depends on the albedo. In the ECMWF Integrated Forecasting System (IFS), a climatological background albedo (observed values averaged over a period of several years) is used, modified by the model over water, ice and snow. Albedo is often shown as a percentage (%). | |
surface_latent_heat_flux | J/m^2 | 11132 meters | Exchange of latent heat with the surface through turbulent diffusion. This variables is accumulated from the beginning of the forecast time to the end of the forecast step. By model convention, downward fluxes are positive. |
surface_net_solar_radiation | J/m^2 | 11132 meters | Amount of solar radiation (also known as shortwave radiation) reaching the surface of the Earth (both direct and diffuse) minus the amount reflected by the Earth's surface (which is governed by the albedo). Radiation from the Sun (solar, or shortwave, radiation) is partly reflected back to space by clouds and particles in the atmosphere (aerosols) and some of it is absorbed. The rest is incident on the Earth's surface, where some of it is reflected. The difference between downward and reflected solar radiation is the surface net solar radiation. This variable is accumulated from the beginning of the forecast time to the end of the forecast step. The units are joules per square meter (J m-2). To convert to watts per square meter (W m-2), the accumulated values should be divided by the accumulation period expressed in seconds. The ECMWF convention for vertical fluxes is positive downwards. |
surface_net_thermal_radiation | J/m^2 | 11132 meters | Net thermal radiation at the surface. Accumulated field from the beginning of the forecast time to the end of the forecast step. By model convention downward fluxes are positive. |
surface_sensible_heat_flux | J/m^2 | 11132 meters | Transfer of heat between the Earth's surface and the atmosphere through the effects of turbulent air motion (but excluding any heat transfer resulting from condensation or evaporation). The magnitude of the sensible heat flux is governed by the difference in temperature between the surface and the overlying atmosphere, wind speed and the surface roughness. For example, cold air overlying a warm surface would produce a sensible heat flux from the land (or ocean) into the atmosphere. This is a single level variable and it is accumulated from the beginning of the forecast time to the end of the forecast step. The units are joules per square meter (J m-2). To convert to watts per square meter (W m-2), the accumulated values should be divided by the accumulation period expressed in seconds. The ECMWF convention for vertical fluxes is positive downwards. |
surface_solar_radiation_downwards | J/m^2 | 11132 meters | Amount of solar radiation (also known as shortwave radiation) reaching the surface of the Earth. This variable comprises both direct and diffuse solar radiation. Radiation from the Sun (solar, or shortwave, radiation) is partly reflected back to space by clouds and particles in the atmosphere (aerosols) and some of it is absorbed. The rest is incident on the Earth's surface (represented by this variable). To a reasonably good approximation, this variable is the model equivalent of what would be measured by a pyranometer (an instrument used for measuring solar radiation) at the surface. However, care should be taken when comparing model variables with observations, because observations are often local to a particular point in space and time, rather than representing averages over a model grid box and model time step. This variable is accumulated from the beginning of the forecast time to the end of the forecast step. The units are joules per square meter (J m-2). To convert to watts per square meter (W m-2), the accumulated values should be divided by the accumulation period expressed in seconds. The ECMWF convention for vertical fluxes is positive downwards. |
surface_thermal_radiation_downwards | J/m^2 | 11132 meters | Amount of thermal (also known as longwave or terrestrial) radiation emitted by the atmosphere and clouds that reaches the Earth's surface. The surface of the Earth emits thermal radiation, some of which is absorbed by the atmosphere and clouds. The atmosphere and clouds likewise emit thermal radiation in all directions, some of which reaches the surface (represented by this variable). This variable is accumulated from the beginning of the forecast time to the end of the forecast step. The units are joules per square meter (J m-2). To convert to watts per square meter (W m-2), the accumulated values should be divided by the accumulation period expressed in seconds. The ECMWF convention for vertical fluxes is positive downwards. |
evaporation_from_bare_soil | m of water equivalent | 11132 meters | The amount of evaporation from bare soil at the top of the land surface. This variable is accumulated from the beginning of the forecast time to the end of the forecast step. |
evaporation_from_open_water_surfaces_excluding_oceans | m of water equivalent | 11132 meters | Amount of evaporation from surface water storage like lakes and inundated areas but excluding oceans. This variable is accumulated from the beginning of the forecast time to the end of the forecast step. |
evaporation_from_the_top_of_canopy | m of water equivalent | 11132 meters | The amount of evaporation from the canopy interception reservoir at the top of the canopy. This variable is accumulated from the beginning of the forecast time to the end of the forecast step. |
evaporation_from_vegetation_transpiration | m of water equivalent | 11132 meters | Amount of evaporation from vegetation transpiration. This has the same meaning as root extraction ie the amount of water extracted from the different soil layers. This variable is accumulated from the beginning of the forecast time to the end of the forecast step. |
potential_evaporation | м | 11132 meters | Potential evaporation (pev) in the current ECMWF model is computed, by making a second call to the surface energy balance routine with the vegetation variables set to "crops/mixed farming" and assuming no stress from soil moisture. In other words, evaporation is computed for agricultural land as if it is well watered and assuming that the atmosphere is not affected by this artificial surface condition. The latter may not always be realistic. Although pev is meant to provide an estimate of irrigation requirements, the method can give unrealistic results in arid conditions due to too strong evaporation forced by dry air. This variable is accumulated from the beginning of the forecast time to the end of the forecast step. |
runoff | м | 11132 meters | Some water from rainfall, melting snow, or deep in the soil, stays stored in the soil. Otherwise, the water drains away, either over the surface (surface runoff), or under the ground (sub-surface runoff) and the sum of these two is simply called 'runoff'. This variable is the total amount of water accumulated from the beginning of the forecast time to the end of the forecast step. The units of runoff are depth in meters. This is the depth the water would have if it were spread evenly over the grid box. Care should be taken when comparing model variables with observations, because observations are often local to a particular point rather than averaged over a grid square area. Observations are also often taken in different units, such as mm/day, rather than the accumulated meters produced here. Runoff is a measure of the availability of water in the soil, and can, for example, be used as an indicator of drought or flood. More information about how runoff is calculated is given in the IFS Physical Processes documentation. |
snow_evaporation | m of water equivalent | 11132 meters | Evaporation from snow averaged over the grid box (to find flux over snow, divide by snow fraction). This variable is accumulated from the beginning of the forecast time to the end of the forecast step. |
sub_surface_runoff | м | 11132 meters | Some water from rainfall, melting snow, or deep in the soil, stays stored in the soil. Otherwise, the water drains away, either over the surface (surface runoff), or under the ground(sub-surface runoff) and the sum of these two is simply called 'runoff'. This variable is accumulated from the beginning of the forecast time to the end of the forecast step. The units of runoff are depth in meters. This is the depth the water would have if it were spread evenly over the grid box. Care should be taken when comparing model variables with observations, because observations are often local to a particular point rather than averaged over a grid square area. Observations are also often taken in different units, such as mm/day, rather than the accumulated meters produced here. Runoff is a measure of the availability of water in the soil, and can, for example, be used as an indicator of drought or flood. More information about how runoff is calculated is given in the IFS Physical Processes documentation. |
surface_runoff | м | 11132 meters | Some water from rainfall, melting snow, or deep in the soil, stays stored in the soil. Otherwise, the water drains away, either over the surface (surface runoff), or under the ground (sub-surface runoff) and the sum of these two is simply called 'runoff'. This variable is the total amount of water accumulated from the beginning of the forecast time to the end of the forecast step. The units of runoff are depth in meters. This is the depth the water would have if it were spread evenly over the grid box. Care should be taken when comparing model variables with observations, because observations are often local to a particular point rather than averaged over a grid square area. Observations are also often taken in different units, such as mm/day, rather than the accumulated meters produced here. Runoff is a measure of the availability of water in the soil, and can, for example, be used as an indicator of drought or flood. More information about how runoff is calculated is given in the IFS Physical Processes documentation. |
total_evaporation | m of water equivalent | 11132 meters | Accumulated amount of water that has evaporated from the Earth's surface, including a simplified representation of transpiration (from vegetation), into vapor in the air above. This variable is accumulated from the beginning of the forecast to the end of the forecast step. The ECMWF Integrated Forecasting System convention is that downward fluxes are positive. Therefore, negative values indicate evaporation and positive values indicate condensation. |
u_component_of_wind_10m | РС | 11132 meters | Eastward component of the 10m wind. It is the horizontal speed of air moving towards the east, at a height of ten meters above the surface of the Earth, in meters per second. Care should be taken when comparing this variable with observations, because wind observations vary on small space and time scales and are affected by the local terrain, vegetation and buildings that are represented only on average in the ECMWF Integrated Forecasting System. This variable can be combined with the V component of 10m wind to give the speed and direction of the horizontal 10m wind. |
v_component_of_wind_10m | РС | 11132 meters | Northward component of the 10m wind. It is the horizontal speed of air moving towards the north, at a height of ten meters above the surface of the Earth, in meters per second. Care should be taken when comparing this variable with observations, because wind observations vary on small space and time scales and are affected by the local terrain, vegetation and buildings that are represented only on average in the ECMWF Integrated Forecasting System. This variable can be combined with the U component of 10m wind to give the speed and direction of the horizontal 10m wind. |
surface_pressure | Па | 11132 meters | Pressure (force per unit area) of the atmosphere on the surface of land, sea and in-land water. It is a measure of the weight of all the air in a column vertically above the area of the Earth's surface represented at a fixed point. Surface pressure is often used in combination with temperature to calculate air density. The strong variation of pressure with altitude makes it difficult to see the low and high pressure systems over mountainous areas, so mean sea level pressure, rather than surface pressure, is normally used for this purpose. The units of this variable are Pascals (Pa). Surface pressure is often measured in hPa and sometimes is presented in the old units of millibars, mb (1 hPa = 1 mb = 100 Pa). |
total_precipitation | м | 11132 meters | Accumulated liquid and frozen water, including rain and snow, that falls to the Earth's surface. It is the sum of large-scale precipitation (that precipitation which is generated by large-scale weather patterns, such as troughs and cold fronts) and convective precipitation (generated by convection which occurs when air at lower levels in the atmosphere is warmer and less dense than the air above, so it rises). Precipitation variables do not include fog, dew or the precipitation that evaporates in the atmosphere before it lands at the surface of the Earth. This variable is accumulated from the beginning of the forecast time to the end of the forecast step. The units of precipitation are depth in meters. It is the depth the water would have if it were spread evenly over the grid box. Care should be taken when comparing model variables with observations, because observations are often local to a particular point in space and time, rather than representing averages over a model grid box and model time step. |
leaf_area_index_high_vegetation | Area fraction | 11132 meters | One-half of the total green leaf area per unit horizontal ground surface area for high vegetation type. |
leaf_area_index_low_vegetation | Area fraction | 11132 meters | One-half of the total green leaf area per unit horizontal ground surface area for low vegetation type. |
snowfall_hourly | m of water equivalent | 11132 meters | snowfall disaggregated from the original cumulative values into hourly values |
snowmelt_hourly | m of water equivalent | 11132 meters | snowmelt disaggregated from the original cumulative values into hourly values |
surface_latent_heat_flux_hourly | J/m^2 | 11132 meters | surface latent heat flux disaggregated from the original cumulative values into hourly values |
surface_net_solar_radiation_hourly | J/m^2 | 11132 meters | surface net solar radiation disaggregated from the original cumulative values into hourly values |
surface_net_thermal_radiation_hourly | J/m^2 | 11132 meters | surface net thermal radiation disaggregated from the original cumulative values into hourly values |
surface_sensible_heat_flux_hourly | J/m^2 | 11132 meters | surface sensible heat flux disaggregated from the original cumulative values into hourly values |
surface_solar_radiation_downwards_hourly | J/m^2 | 11132 meters | surface solar radiation downwards disaggregated from the original cumulative values into hourly values |
surface_thermal_radiation_downwards_hourly | J/m^2 | 11132 meters | surface thermal radiation downwards disaggregated from the original cumulative values into hourly values |
evaporation_from_bare_soil_hourly | m of water equivalent | 11132 meters | evaporation from bare soil disaggregated from the original cumulative values into hourly values |
evaporation_from_open_water_surfaces_excluding_oceans_hourly | m of water equivalent | 11132 meters | evaporation from open water surfaces excluding oceans disaggregated from the original cumulative values into hourly values |
evaporation_from_the_top_of_canopy_hourly | m of water equivalent | 11132 meters | evaporation from the top of canopy disaggregated from the original cumulative values into hourly values |
evaporation_from_vegetation_transpiration_hourly | m of water equivalent | 11132 meters | evaporation from vegetation transpiration disaggregated from the original cumulative values into hourly values |
potential_evaporation_hourly | м | 11132 meters | potential evaporation disaggregated from the original cumulative values into hourly values |
runoff_hourly | м | 11132 meters | runoff disaggregated from the original cumulative values into hourly values |
snow_evaporation_hourly | m of water equivalent | 11132 meters | snow evaporation disaggregated from the original cumulative values into hourly values |
sub_surface_runoff_hourly | м | 11132 meters | sub surface runoff disaggregated from the original cumulative values into hourly values |
surface_runoff_hourly | м | 11132 meters | surface runoff disaggregated from the original cumulative values into hourly values |
total_evaporation_hourly | m of water equivalent | 11132 meters | total evaporation disaggregated from the original cumulative values into hourly values |
total_precipitation_hourly | м | 11132 meters | total precipitation disaggregated from the original cumulative values into hourly values |
Свойства изображения
Свойства изображения
| Имя | Тип | Описание |
|---|---|---|
| час | ИНТ | Hour of the day |
Условия эксплуатации
Условия эксплуатации
Please acknowledge the use of ERA5-Land as stated in the Copernicus C3S/CAMS License agreement :
5.1.1 Where the Licensee communicates or distributes Copernicus Products to the public, the Licensee shall inform the recipients of the source by using the following or any similar notice: 'Generated using Copernicus Climate Change Service Information [Year]'.
5.1.2 Where the Licensee makes or contributes to a publication or distribution containing adapted or modified Copernicus Products, the Licensee shall provide the following or any similar notice: 'Contains modified Copernicus Climate Change Service Information [Year]';
Any such publication or distribution covered by clauses 5.1.1 and 5.1.2 shall state that neither the European Commission nor ECMWF is responsible for any use that may be made of the Copernicus Information or Data it contains.
Цитаты
Muñoz Sabater, J., (2019): ERA5-Land monthly averaged data from 1981 to present. Copernicus Climate Change Service (C3S) Climate Data Store (CDS). (<date of access>), doi:10.24381/cds.68d2bb30
Исследуйте мир с помощью Earth Engine.
Редактор кода (JavaScript)
var dataset = ee.ImageCollection('ECMWF/ERA5_LAND/HOURLY')
                .filter(ee.Filter.date('2020-07-01', '2020-07-02'));

var visualization = {
  bands: ['temperature_2m'],
  min: 250.0,
  max: 320.0,
  palette: [
    '000080', '0000d9', '4000ff', '8000ff', '0080ff', '00ffff',
    '00ff80', '80ff00', 'daff00', 'ffff00', 'fff500', 'ffda00',
    'ffb000', 'ffa400', 'ff4f00', 'ff2500', 'ff0a00', 'ff00ff',
  ]
};

Map.setCenter(22.2, 21.2, 0);

Map.addLayer(dataset, visualization, 'Air temperature [K] at 2m height');
import ee
import geemap.core as geemap
Colab (Python)
dataset = ee.ImageCollection('ECMWF/ERA5_LAND/HOURLY').filter(
    ee.Filter.date('2020-07-01', '2020-07-02')
)

visualization = {
    'bands': ['temperature_2m'],
    'min': 250.0,
    'max': 320.0,
    'palette': [
        '000080', '0000d9', '4000ff', '8000ff', '0080ff', '00ffff',
        '00ff80', '80ff00', 'daff00', 'ffff00', 'fff500', 'ffda00',
        'ffb000', 'ffa400', 'ff4f00', 'ff2500', 'ff0a00', 'ff00ff',
    ],
}

m = geemap.Map()
m.set_center(22.2, 21.2, 0)
m.add_layer(dataset, visualization, 'Air temperature [K] at 2m height')
m
- Доступность набора данных
- 1950-01-01T01:00:00Z–2026-09-01T23:00:00Z
- Производитель наборов данных
- Хранилище климатических данных Copernicus
- Каденция
- 1 час
- Теги
Описание
ERA5-Land is a reanalysis dataset providing a consistent view of the evolution of land variables over several decades at an enhanced resolution compared to ERA5. ERA5-Land has been produced by replaying the land component of the ECMWF ERA5 climate reanalysis. Reanalysis combines model data with observations from across the world into a globally complete and consistent dataset using the laws of physics. Reanalysis produces data that goes several decades back in time, providing an accurate description of the climate of the past. This dataset includes all 50 variables as available on CDS.
ERA5-Land data is available from 1950 to three months from real-time.
Please consult the ERA5-Land "Known Issues" section . In particular, note that three components of the total evapotranspiration have values swapped as follows:
- variable "Evaporation from bare soil" (mars parameter code 228101 (evabs)) has the values corresponding to the "Evaporation from vegetation transpiration" (mars parameter 228103 (evavt)),
- variable "Evaporation from open water surfaces excluding oceans (mars parameter code 228102 (evaow)) has the values corresponding to the "Evaporation from bare soil" (mars parameter code 228101 (evabs)),
- variable "Evaporation from vegetation transpiration" (mars parameter code 228103 (evavt)) has the values corresponding to the "Evaporation from open water surfaces excluding oceans" (mars parameter code 228102 (evaow)).
Please note that the convention for accumulations used in ERA5-Land differs with that for ERA5. The accumulations are treated the same as those in ERA-Interim or ERA-Interim/Land, ie, they are accumulated from the beginning of the forecast to the end of the forecast step. This happens within every day and gets reset on midnight. See this page for more information . The Earth Engine Data team added 19 additional bands, one for each of the accumulation bands, with the hourly values computed as the difference between two consecutive forecast steps.
Группы
Группы
Pixel size: 11132 meters (all bands)
| Имя | Единицы | Размер пикселя | Описание |
|---|---|---|---|
dewpoint_temperature_2m | К | 11132 meters | Temperature to which the air, at 2 meters above the surface of the Earth, would have to be cooled for saturation to occur. It is a measure of the humidity of the air. Combined with temperature and pressure, it can be used to calculate the relative humidity. 2m dew point temperature is calculated by interpolating between the lowest model level and the Earth's surface, taking account of the atmospheric conditions. |
temperature_2m | К | 11132 meters | Temperature of air at 2m above the surface of land, sea or in-land waters. 2m temperature is calculated by interpolating between the lowest model level and the Earth's surface, taking account of the atmospheric conditions. |
skin_temperature | К | 11132 meters | Temperature of the surface of the Earth. The skin temperature is the theoretical temperature that is required to satisfy the surface energy balance. It represents the temperature of the uppermost surface layer, which has no heat capacity and so can respond instantaneously to changes in surface fluxes. Skin temperature is calculated differently over land and sea. |
soil_temperature_level_1 | К | 11132 meters | Temperature of the soil in layer 1 (0 - 7 cm) of the ECMWF Integrated Forecasting System. The surface is at 0 cm. Soil temperature is set at the middle of each layer, and heat transfer is calculated at the interfaces between them. It is assumed that there is no heat transfer out of the bottom of the lowest layer. |
soil_temperature_level_2 | К | 11132 meters | Temperature of the soil in layer 2 (7-28 cm) of the ECMWF Integrated Forecasting System. |
soil_temperature_level_3 | К | 11132 meters | Temperature of the soil in layer 3 (28-100 cm) of the ECMWF Integrated Forecasting System. |
soil_temperature_level_4 | К | 11132 meters | Temperature of the soil in layer 4 (100-289 cm) of the ECMWF Integrated Forecasting System. |
lake_bottom_temperature | К | 11132 meters | Temperature of water at the bottom of inland water bodies (lakes, reservoirs, rivers) and coastal waters. ECMWF implemented a lake model in May 2015 to represent the water temperature and lake ice of all the world's major inland water bodies in the Integrated Forecasting System. The model keeps lake depth and surface area (or fractional cover) constant in time. |
lake_ice_depth | м | 11132 meters | The thickness of ice on inland water bodies (lakes, reservoirs and rivers) and coastal waters. The ECMWF Integrated Forecasting System (IFS) represents the formation and melting of ice on inland water bodies (lakes, reservoirs and rivers) and coastal water. A single ice layer is represented. This parameter is the thickness of that ice layer. |
lake_ice_temperature | К | 11132 meters | The temperature of the uppermost surface of ice on inland water bodies (lakes, reservoirs, rivers) and coastal waters. The ECMWF Integrated Forecasting System represents the formation and melting of ice on lakes. A single ice layer is represented. |
lake_mix_layer_depth | м | 11132 meters | The thickness of the upper most layer of an inland water body (lake, reservoirs, and rivers) or coastal waters that is well mixed and has a near constant temperature with depth (uniform distribution of temperature). The ECMWF Integrated Forecasting System represents inland water bodies with two layers in the vertical, the mixed layer above and the thermocline below. Thermoclines upper boundary is located at the mixed layer bottom, and the lower boundary at the lake bottom. Mixing within the mixed layer can occur when the density of the surface (and near-surface) water is greater than that of the water below. Mixing can also occur through the action of wind on the surface of the lake. |
lake_mix_layer_temperature | К | 11132 meters | The temperature of the upper most layer of inland water bodies (lakes, reservoirs and rivers) or coastal waters) that is well mixed. The ECMWF Integrated Forecasting System represents inland water bodies with two layers in the vertical, the mixed layer above and the thermocline below. Thermoclines upper boundary is located at the mixed layer bottom, and the lower boundary at the lake bottom. Mixing within the mixed layer can occur when the density of the surface (and near-surface) water is greater than that of the water below. Mixing can also occur through the action of wind on the surface of the lake. |
lake_shape_factor | 11132 meters | This parameter describes the way that temperature changes with depth in the thermocline layer of inland water bodies (lakes, reservoirs and rivers) and coastal waters. It is used to calculate the lake bottom temperature and other lake-related parameters. The ECMWF Integrated Forecasting System represents inland and coastal water bodies with two layers in the vertical, the mixed layer above and the thermocline below where temperature changes with depth. | |
lake_total_layer_temperature | К | 11132 meters | The mean temperature of total water column in inland water bodies (lakes, reservoirs and rivers) and coastal waters. The ECMWF Integrated Forecasting System represents inland water bodies with two layers in the vertical, the mixed layer above and the thermocline below where temperature changes with depth. This parameter is the mean over the two layers. |
snow_albedo | 11132 meters | It is defined as the fraction of solar (shortwave) radiation reflected by the snow, across the solar spectrum, for both direct and diffuse radiation. It is a measure of the reflectivity of the snow covered grid cells. Values vary between 0 and 1. Typically, snow and ice have high reflectivity with albedo values of 0.8 and above. | |
snow_cover | 11132 meters | It represents the fraction (0-1) of the cell / grid-box occupied by snow (similar to the cloud cover fields of ERA5). | |
snow_density | кг/м³ | 11132 meters | Mass of snow per cubic meter in the snow layer. The ECMWF Integrated Forecast System (IFS) model represents snow as a single additional layer over the uppermost soil level. The snow may cover all or part of the grid box. |
snow_depth | м | 11132 meters | Instantaneous grid-box average of the snow thickness on the ground (excluding snow on canopy). |
snow_depth_water_equivalent | m of water equivalent | 11132 meters | Depth of snow from the snow-covered area of a grid box. Its units are meters of water equivalent, so it is the depth the water would have if the snow melted and was spread evenly over the whole grid box. The ECMWF Integrated Forecast System represents snow as a single additional layer over the uppermost soil level. The snow may cover all or part of the grid box. |
snowfall | m of water equivalent | 11132 meters | Accumulated total snow that has fallen to the Earth's surface. It consists of snow due to the large-scale atmospheric flow (horizontal scales greater than around a few hundred meters) and convection where smaller scale areas (around 5km to a few hundred kilometers) of warm air rise. If snow has melted during the period over which this variable was accumulated, then it will be higher than the snow depth. This variable is the total amount of water accumulated from the beginning of the forecast time to the end of the forecast step. The units given measure the depth the water would have if the snow melted and was spread evenly over the grid box. Care should be taken when comparing model variables with observations, because observations are often local to a particular point in space and time, rather than representing averages over a model grid box and model time step. |
snowmelt | m of water equivalent | 11132 meters | Melting of snow averaged over the grid box (to find melt over snow, divide by snow fraction). This variable is accumulated from the beginning of the forecast time to the end of the forecast step. |
temperature_of_snow_layer | К | 11132 meters | This variable gives the temperature of the snow layer from the ground to the snow-air interface. The ECMWF Integrated Forecast System (IFS) model represents snow as a single additional layer over the uppermost soil level. The snow may cover all or part of the grid box. |
skin_reservoir_content | m of water equivalent | 11132 meters | Amount of water in the vegetation canopy and/or in a thin layer on the soil. It represents the amount of rain intercepted by foliage, and water from dew. The maximum amount of 'skin reservoir content' a grid box can hold depends on the type of vegetation, and may be zero. Water leaves the 'skin reservoir' by evaporation. |
volumetric_soil_water_layer_1 | Объемная доля | 11132 meters | Volume of water in soil layer 1 (0 - 7 cm) of the ECMWF Integrated Forecasting System. The surface is at 0 cm. The volumetric soil water is associated with the soil texture (or classification), soil depth, and the underlying groundwater level. |
volumetric_soil_water_layer_2 | Объемная доля | 11132 meters | Volume of water in soil layer 2 (7 -28 cm) of the ECMWF Integrated Forecasting System. |
volumetric_soil_water_layer_3 | Объемная доля | 11132 meters | Volume of water in soil layer 3 (28-100 cm) of the ECMWF Integrated Forecasting System. |
volumetric_soil_water_layer_4 | Объемная доля | 11132 meters | Volume of water in soil layer 4 (100-289 cm) of the ECMWF Integrated Forecasting System. |
forecast_albedo | 11132 meters | Is a measure of the reflectivity of the Earth's surface. It is the fraction of solar (shortwave) radiation reflected by Earth's surface, across the solar spectrum, for both direct and diffuse radiation. Values are between 0 and 1. Typically, snow and ice have high reflectivity with albedo values of 0.8 and above, land has intermediate values between about 0.1 and 0.4 and the ocean has low values of 0.1 or less. Radiation from the Sun (solar, or shortwave, radiation) is partly reflected back to space by clouds and particles in the atmosphere (aerosols) and some of it is absorbed. The rest is incident on the Earth's surface, where some of it is reflected. The portion that is reflected by the Earth's surface depends on the albedo. In the ECMWF Integrated Forecasting System (IFS), a climatological background albedo (observed values averaged over a period of several years) is used, modified by the model over water, ice and snow. Albedo is often shown as a percentage (%). | |
surface_latent_heat_flux | J/m^2 | 11132 meters | Exchange of latent heat with the surface through turbulent diffusion. This variables is accumulated from the beginning of the forecast time to the end of the forecast step. By model convention, downward fluxes are positive. |
surface_net_solar_radiation | J/m^2 | 11132 meters | Amount of solar radiation (also known as shortwave radiation) reaching the surface of the Earth (both direct and diffuse) minus the amount reflected by the Earth's surface (which is governed by the albedo). Radiation from the Sun (solar, or shortwave, radiation) is partly reflected back to space by clouds and particles in the atmosphere (aerosols) and some of it is absorbed. The rest is incident on the Earth's surface, where some of it is reflected. The difference between downward and reflected solar radiation is the surface net solar radiation. This variable is accumulated from the beginning of the forecast time to the end of the forecast step. The units are joules per square meter (J m-2). To convert to watts per square meter (W m-2), the accumulated values should be divided by the accumulation period expressed in seconds. The ECMWF convention for vertical fluxes is positive downwards. |
surface_net_thermal_radiation | J/m^2 | 11132 meters | Net thermal radiation at the surface. Accumulated field from the beginning of the forecast time to the end of the forecast step. By model convention downward fluxes are positive. |
surface_sensible_heat_flux | J/m^2 | 11132 meters | Transfer of heat between the Earth's surface and the atmosphere through the effects of turbulent air motion (but excluding any heat transfer resulting from condensation or evaporation). The magnitude of the sensible heat flux is governed by the difference in temperature between the surface and the overlying atmosphere, wind speed and the surface roughness. For example, cold air overlying a warm surface would produce a sensible heat flux from the land (or ocean) into the atmosphere. This is a single level variable and it is accumulated from the beginning of the forecast time to the end of the forecast step. The units are joules per square meter (J m-2). To convert to watts per square meter (W m-2), the accumulated values should be divided by the accumulation period expressed in seconds. The ECMWF convention for vertical fluxes is positive downwards. |
surface_solar_radiation_downwards | J/m^2 | 11132 meters | Amount of solar radiation (also known as shortwave radiation) reaching the surface of the Earth. This variable comprises both direct and diffuse solar radiation. Radiation from the Sun (solar, or shortwave, radiation) is partly reflected back to space by clouds and particles in the atmosphere (aerosols) and some of it is absorbed. The rest is incident on the Earth's surface (represented by this variable). To a reasonably good approximation, this variable is the model equivalent of what would be measured by a pyranometer (an instrument used for measuring solar radiation) at the surface. However, care should be taken when comparing model variables with observations, because observations are often local to a particular point in space and time, rather than representing averages over a model grid box and model time step. This variable is accumulated from the beginning of the forecast time to the end of the forecast step. The units are joules per square meter (J m-2). To convert to watts per square meter (W m-2), the accumulated values should be divided by the accumulation period expressed in seconds. The ECMWF convention for vertical fluxes is positive downwards. |
surface_thermal_radiation_downwards | J/m^2 | 11132 meters | Amount of thermal (also known as longwave or terrestrial) radiation emitted by the atmosphere and clouds that reaches the Earth's surface. The surface of the Earth emits thermal radiation, some of which is absorbed by the atmosphere and clouds. The atmosphere and clouds likewise emit thermal radiation in all directions, some of which reaches the surface (represented by this variable). This variable is accumulated from the beginning of the forecast time to the end of the forecast step. The units are joules per square meter (J m-2). To convert to watts per square meter (W m-2), the accumulated values should be divided by the accumulation period expressed in seconds. The ECMWF convention for vertical fluxes is positive downwards. |
evaporation_from_bare_soil | m of water equivalent | 11132 meters | The amount of evaporation from bare soil at the top of the land surface. This variable is accumulated from the beginning of the forecast time to the end of the forecast step. |
evaporation_from_open_water_surfaces_excluding_oceans | m of water equivalent | 11132 meters | Amount of evaporation from surface water storage like lakes and inundated areas but excluding oceans. This variable is accumulated from the beginning of the forecast time to the end of the forecast step. |
evaporation_from_the_top_of_canopy | m of water equivalent | 11132 meters | The amount of evaporation from the canopy interception reservoir at the top of the canopy. This variable is accumulated from the beginning of the forecast time to the end of the forecast step. |
evaporation_from_vegetation_transpiration | m of water equivalent | 11132 meters | Amount of evaporation from vegetation transpiration. This has the same meaning as root extraction ie the amount of water extracted from the different soil layers. This variable is accumulated from the beginning of the forecast time to the end of the forecast step. |
potential_evaporation | м | 11132 meters | Potential evaporation (pev) in the current ECMWF model is computed, by making a second call to the surface energy balance routine with the vegetation variables set to "crops/mixed farming" and assuming no stress from soil moisture. In other words, evaporation is computed for agricultural land as if it is well watered and assuming that the atmosphere is not affected by this artificial surface condition. The latter may not always be realistic. Although pev is meant to provide an estimate of irrigation requirements, the method can give unrealistic results in arid conditions due to too strong evaporation forced by dry air. This variable is accumulated from the beginning of the forecast time to the end of the forecast step. |
runoff | м | 11132 meters | Some water from rainfall, melting snow, or deep in the soil, stays stored in the soil. Otherwise, the water drains away, either over the surface (surface runoff), or under the ground (sub-surface runoff) and the sum of these two is simply called 'runoff'. This variable is the total amount of water accumulated from the beginning of the forecast time to the end of the forecast step. The units of runoff are depth in meters. This is the depth the water would have if it were spread evenly over the grid box. Care should be taken when comparing model variables with observations, because observations are often local to a particular point rather than averaged over a grid square area. Observations are also often taken in different units, such as mm/day, rather than the accumulated meters produced here. Runoff is a measure of the availability of water in the soil, and can, for example, be used as an indicator of drought or flood. More information about how runoff is calculated is given in the IFS Physical Processes documentation. |
snow_evaporation | m of water equivalent | 11132 meters | Evaporation from snow averaged over the grid box (to find flux over snow, divide by snow fraction). This variable is accumulated from the beginning of the forecast time to the end of the forecast step. |
sub_surface_runoff | м | 11132 meters | Some water from rainfall, melting snow, or deep in the soil, stays stored in the soil. Otherwise, the water drains away, either over the surface (surface runoff), or under the ground(sub-surface runoff) and the sum of these two is simply called 'runoff'. This variable is accumulated from the beginning of the forecast time to the end of the forecast step. The units of runoff are depth in meters. This is the depth the water would have if it were spread evenly over the grid box. Care should be taken when comparing model variables with observations, because observations are often local to a particular point rather than averaged over a grid square area. Observations are also often taken in different units, such as mm/day, rather than the accumulated meters produced here. Runoff is a measure of the availability of water in the soil, and can, for example, be used as an indicator of drought or flood. More information about how runoff is calculated is given in the IFS Physical Processes documentation. |
surface_runoff | м | 11132 meters | Some water from rainfall, melting snow, or deep in the soil, stays stored in the soil. Otherwise, the water drains away, either over the surface (surface runoff), or under the ground (sub-surface runoff) and the sum of these two is simply called 'runoff'. This variable is the total amount of water accumulated from the beginning of the forecast time to the end of the forecast step. The units of runoff are depth in meters. This is the depth the water would have if it were spread evenly over the grid box. Care should be taken when comparing model variables with observations, because observations are often local to a particular point rather than averaged over a grid square area. Observations are also often taken in different units, such as mm/day, rather than the accumulated meters produced here. Runoff is a measure of the availability of water in the soil, and can, for example, be used as an indicator of drought or flood. More information about how runoff is calculated is given in the IFS Physical Processes documentation. |
total_evaporation | m of water equivalent | 11132 meters | Accumulated amount of water that has evaporated from the Earth's surface, including a simplified representation of transpiration (from vegetation), into vapor in the air above. This variable is accumulated from the beginning of the forecast to the end of the forecast step. The ECMWF Integrated Forecasting System convention is that downward fluxes are positive. Therefore, negative values indicate evaporation and positive values indicate condensation. |
u_component_of_wind_10m | РС | 11132 meters | Eastward component of the 10m wind. It is the horizontal speed of air moving towards the east, at a height of ten meters above the surface of the Earth, in meters per second. Care should be taken when comparing this variable with observations, because wind observations vary on small space and time scales and are affected by the local terrain, vegetation and buildings that are represented only on average in the ECMWF Integrated Forecasting System. This variable can be combined with the V component of 10m wind to give the speed and direction of the horizontal 10m wind. |
v_component_of_wind_10m | РС | 11132 meters | Northward component of the 10m wind. It is the horizontal speed of air moving towards the north, at a height of ten meters above the surface of the Earth, in meters per second. Care should be taken when comparing this variable with observations, because wind observations vary on small space and time scales and are affected by the local terrain, vegetation and buildings that are represented only on average in the ECMWF Integrated Forecasting System. This variable can be combined with the U component of 10m wind to give the speed and direction of the horizontal 10m wind. |
surface_pressure | Па | 11132 meters | Pressure (force per unit area) of the atmosphere on the surface of land, sea and in-land water. It is a measure of the weight of all the air in a column vertically above the area of the Earth's surface represented at a fixed point. Surface pressure is often used in combination with temperature to calculate air density. The strong variation of pressure with altitude makes it difficult to see the low and high pressure systems over mountainous areas, so mean sea level pressure, rather than surface pressure, is normally used for this purpose. The units of this variable are Pascals (Pa). Surface pressure is often measured in hPa and sometimes is presented in the old units of millibars, mb (1 hPa = 1 mb = 100 Pa). |
total_precipitation | м | 11132 meters | Accumulated liquid and frozen water, including rain and snow, that falls to the Earth's surface. It is the sum of large-scale precipitation (that precipitation which is generated by large-scale weather patterns, such as troughs and cold fronts) and convective precipitation (generated by convection which occurs when air at lower levels in the atmosphere is warmer and less dense than the air above, so it rises). Precipitation variables do not include fog, dew or the precipitation that evaporates in the atmosphere before it lands at the surface of the Earth. This variable is accumulated from the beginning of the forecast time to the end of the forecast step. The units of precipitation are depth in meters. It is the depth the water would have if it were spread evenly over the grid box. Care should be taken when comparing model variables with observations, because observations are often local to a particular point in space and time, rather than representing averages over a model grid box and model time step. |
leaf_area_index_high_vegetation | Area fraction | 11132 meters | One-half of the total green leaf area per unit horizontal ground surface area for high vegetation type. |
leaf_area_index_low_vegetation | Area fraction | 11132 meters | One-half of the total green leaf area per unit horizontal ground surface area for low vegetation type. |
snowfall_hourly | m of water equivalent | 11132 meters | snowfall disaggregated from the original cumulative values into hourly values |
snowmelt_hourly | m of water equivalent | 11132 meters | snowmelt disaggregated from the original cumulative values into hourly values |
surface_latent_heat_flux_hourly | J/m^2 | 11132 meters | surface latent heat flux disaggregated from the original cumulative values into hourly values |
surface_net_solar_radiation_hourly | J/m^2 | 11132 meters | surface net solar radiation disaggregated from the original cumulative values into hourly values |
surface_net_thermal_radiation_hourly | J/m^2 | 11132 meters | surface net thermal radiation disaggregated from the original cumulative values into hourly values |
surface_sensible_heat_flux_hourly | J/m^2 | 11132 meters | surface sensible heat flux disaggregated from the original cumulative values into hourly values |
surface_solar_radiation_downwards_hourly | J/m^2 | 11132 meters | surface solar radiation downwards disaggregated from the original cumulative values into hourly values |
surface_thermal_radiation_downwards_hourly | J/m^2 | 11132 meters | surface thermal radiation downwards disaggregated from the original cumulative values into hourly values |
evaporation_from_bare_soil_hourly | m of water equivalent | 11132 meters | evaporation from bare soil disaggregated from the original cumulative values into hourly values |
evaporation_from_open_water_surfaces_excluding_oceans_hourly | m of water equivalent | 11132 meters | evaporation from open water surfaces excluding oceans disaggregated from the original cumulative values into hourly values |
evaporation_from_the_top_of_canopy_hourly | m of water equivalent | 11132 meters | evaporation from the top of canopy disaggregated from the original cumulative values into hourly values |
evaporation_from_vegetation_transpiration_hourly | m of water equivalent | 11132 meters | evaporation from vegetation transpiration disaggregated from the original cumulative values into hourly values |
potential_evaporation_hourly | м | 11132 meters | potential evaporation disaggregated from the original cumulative values into hourly values |
runoff_hourly | м | 11132 meters | runoff disaggregated from the original cumulative values into hourly values |
snow_evaporation_hourly | m of water equivalent | 11132 meters | snow evaporation disaggregated from the original cumulative values into hourly values |
sub_surface_runoff_hourly | м | 11132 meters | sub surface runoff disaggregated from the original cumulative values into hourly values |
surface_runoff_hourly | м | 11132 meters | surface runoff disaggregated from the original cumulative values into hourly values |
total_evaporation_hourly | m of water equivalent | 11132 meters | total evaporation disaggregated from the original cumulative values into hourly values |
total_precipitation_hourly | м | 11132 meters | total precipitation disaggregated from the original cumulative values into hourly values |
Свойства изображения
Свойства изображения
| Имя | Тип | Описание |
|---|---|---|
| час | ИНТ | Hour of the day |
Условия эксплуатации
Условия эксплуатации
Please acknowledge the use of ERA5-Land as stated in the Copernicus C3S/CAMS License agreement :
5.1.1 Where the Licensee communicates or distributes Copernicus Products to the public, the Licensee shall inform the recipients of the source by using the following or any similar notice: 'Generated using Copernicus Climate Change Service Information [Year]'.
5.1.2 Where the Licensee makes or contributes to a publication or distribution containing adapted or modified Copernicus Products, the Licensee shall provide the following or any similar notice: 'Contains modified Copernicus Climate Change Service Information [Year]';
Any such publication or distribution covered by clauses 5.1.1 and 5.1.2 shall state that neither the European Commission nor ECMWF is responsible for any use that may be made of the Copernicus Information or Data it contains.
Цитаты
Muñoz Sabater, J., (2019): ERA5-Land monthly averaged data from 1981 to present. Copernicus Climate Change Service (C3S) Climate Data Store (CDS). (<date of access>), doi:10.24381/cds.68d2bb30
Исследуйте мир с помощью Earth Engine.
Редактор кода (JavaScript)
var dataset = ee.ImageCollection('ECMWF/ERA5_LAND/HOURLY')
                .filter(ee.Filter.date('2020-07-01', '2020-07-02'));

var visualization = {
  bands: ['temperature_2m'],
  min: 250.0,
  max: 320.0,
  palette: [
    '000080', '0000d9', '4000ff', '8000ff', '0080ff', '00ffff',
    '00ff80', '80ff00', 'daff00', 'ffff00', 'fff500', 'ffda00',
    'ffb000', 'ffa400', 'ff4f00', 'ff2500', 'ff0a00', 'ff00ff',
  ]
};

Map.setCenter(22.2, 21.2, 0);

Map.addLayer(dataset, visualization, 'Air temperature [K] at 2m height');
import ee
import geemap.core as geemap
Colab (Python)
dataset = ee.ImageCollection('ECMWF/ERA5_LAND/HOURLY').filter(
    ee.Filter.date('2020-07-01', '2020-07-02')
)

visualization = {
    'bands': ['temperature_2m'],
    'min': 250.0,
    'max': 320.0,
    'palette': [
        '000080', '0000d9', '4000ff', '8000ff', '0080ff', '00ffff',
        '00ff80', '80ff00', 'daff00', 'ffff00', 'fff500', 'ffda00',
        'ffb000', 'ffa400', 'ff4f00', 'ff2500', 'ff0a00', 'ff00ff',
    ],
}

m = geemap.Map()
m.set_center(22.2, 21.2, 0)
m.add_layer(dataset, visualization, 'Air temperature [K] at 2m height')
m