
- ডেটাসেটের প্রাপ্যতা
- 1950-01-02T00:00:00Z–2026-09-04T00:00:00Z
- ডেটাসেট প্রযোজক
- দৈনিক সমষ্টি: গুগল এবং কোপারনিকাস ক্লাইমেট ডেটা স্টোর
- ক্যাডেন্স
- ১ মাস
- ট্যাগ
বর্ণনা
ERA5-Land হলো একটি পুনঃবিশ্লেষণ ডেটাসেট যা ERA5-এর তুলনায় উন্নত রেজোলিউশনে কয়েক দশক ধরে ভূমির চলকগুলোর বিবর্তনের একটি সামঞ্জস্যপূর্ণ চিত্র প্রদান করে। ECMWF ERA5 জলবায়ু পুনঃবিশ্লেষণের ভূমি উপাদানটিকে পুনরায় চালনা করে ERA5-Land তৈরি করা হয়েছে। পুনঃবিশ্লেষণ পদার্থবিজ্ঞানের সূত্র ব্যবহার করে মডেল ডেটার সাথে বিশ্বজুড়ে প্রাপ্ত পর্যবেক্ষণকে একত্রিত করে একটি বিশ্বব্যাপী সম্পূর্ণ এবং সামঞ্জস্যপূর্ণ ডেটাসেট তৈরি করে। পুনঃবিশ্লেষণ এমন ডেটা তৈরি করে যা কয়েক দশক আগের সময় পর্যন্ত বিস্তৃত, যা অতীতের জলবায়ুর একটি সঠিক বিবরণ প্রদান করে। এই ডেটাসেটটিতে CDS-এ উপলব্ধ সমস্ত ৫০টি চলক অন্তর্ভুক্ত রয়েছে।
ERA5-Land ডেটা ১৯৫০ সাল থেকে রিয়েল-টাইমের তিন মাস পর্যন্ত পাওয়া যায়।
অনুগ্রহ করে ERA5-Land-এর "Known Issues" অংশটি দেখুন। বিশেষ করে, লক্ষ্য করুন যে মোট বাষ্পীভবনের তিনটি উপাদানের মান নিম্নরূপভাবে অদলবদল করা হয়েছে:
- 'অনাবৃত মাটি থেকে বাষ্পীভবন' (মার্স প্যারামিটার কোড 228101 (evabs)) চলকটির মান, 'উদ্ভিদের প্রস্বেদন থেকে বাষ্পীভবন' (মার্স প্যারামিটার 228103 (evavt)) চলকটির মানের অনুরূপ।
- "মহাসাগর ব্যতীত উন্মুক্ত জলাশয় থেকে বাষ্পীভবন" (মঙ্গল গ্রহের প্যারামিটার কোড 228102 (evaow)) চলকটির মান, "অনাবৃত মাটি থেকে বাষ্পীভবন" (মঙ্গল গ্রহের প্যারামিটার কোড 228101 (evabs)) চলকটির মানের অনুরূপ।
- "উদ্ভিদের প্রস্বেদন থেকে বাষ্পীভবন" (মঙ্গল গ্রহের প্যারামিটার কোড 228103 (evavt)) চলকটির মান, "মহাসাগর ব্যতীত উন্মুক্ত জলাশয় থেকে বাষ্পীভবন" (মঙ্গল গ্রহের প্যারামিটার কোড 228102 (evaow)) চলকটির মানের অনুরূপ।
এই অ্যাসেটটি হলো ECMWF ERA5 ল্যান্ড-এর ঘণ্টাভিত্তিক অ্যাসেটগুলোর একটি দৈনিক সমষ্টি, যাতে ফ্লো এবং নন-ফ্লো উভয় ব্যান্ডই অন্তর্ভুক্ত। ফ্লো ব্যান্ডগুলো তৈরি করা হয় পরবর্তী দিনের প্রথম ঘণ্টার ডেটা সংগ্রহ করে, যেখানে পূর্ববর্তী দিনের মোট যোগফল থাকে, এবং অন্যদিকে নন-ফ্লো ব্যান্ডগুলো তৈরি করা হয় সেই দিনের সমস্ত ঘণ্টাভিত্তিক ডেটার গড় করে। ফ্লো ব্যান্ডগুলোকে "_sum" আইডেন্টিফায়ার দিয়ে চিহ্নিত করা হয়, যা কোপারনিকাস ক্লাইমেট ডেটা স্টোর দ্বারা উৎপাদিত দৈনিক ডেটা থেকে ভিন্ন একটি পদ্ধতি, যেখানে ফ্লো ব্যান্ডগুলোরও গড় করা হয়।
যেসব অ্যাপ্লিকেশনের ডেটাতে সহজে ও দ্রুত অ্যাক্সেসের প্রয়োজন হয়, সেগুলোর সুবিধার্থে দৈনিক মোট পরিমাণ আগে থেকেই গণনা করা হয়েছে।
বৃষ্টিপাত এবং অন্যান্য (সঞ্চিত) প্রবাহের স্তরগুলোর মান মাঝে মাঝে ঋণাত্মক হতে পারে, যা ভৌতভাবে অযৌক্তিক। আবার অন্য সময়ে এদের মান অত্যধিক বেশিও হতে পারে।
এই সমস্যাটি GRIB ফরম্যাটের ডেটা সংরক্ষণের পদ্ধতির কারণে হয়ে থাকে: এটি ডেটাকে সরল করে বা ছোট, কম সুনির্দিষ্ট সংখ্যায় "প্যাক" করে, যা ত্রুটির কারণ হতে পারে। ডেটার মধ্যে অনেক তারতম্য থাকলে এই ত্রুটিগুলো আরও গুরুতর হয়ে ওঠে।
এই কারণে, দৈনিক মোট বৃষ্টিপাতের পরিমাণ গণনা করার জন্য যখন আমরা পুরো দিনের তথ্য দেখি, তখন কখনও কখনও এক সময়ে রেকর্ড করা সর্বোচ্চ বৃষ্টিপাতের পরিমাণকে পুরো দিনের পরিমাপ করা মোট বৃষ্টিপাতের চেয়ে বেশি বলে মনে হতে পারে।
আরও জানতে, অনুগ্রহ করে দেখুন: "কেন মাঝে মাঝে সামান্য ঋণাত্মক বৃষ্টিপাত জমা হয়"
ব্যান্ড
ব্যান্ড
পিক্সেল সাইজ: ১১১৩২ মিটার (সকল ব্যান্ড)
| নাম | ইউনিট | পিক্সেল আকার | বর্ণনা |
|---|---|---|---|
dewpoint_temperature_2m | কে | ১১১৩২ মিটার | ভূপৃষ্ঠ থেকে ২ মিটার উপরে থাকা বাতাসকে যে তাপমাত্রায় শীতল করলে সম্পৃক্ত অবস্থা তৈরি হয়, তাকেই শিশিরবিন্দু তাপমাত্রা বলে। এটি বায়ুর আর্দ্রতার একটি পরিমাপ। তাপমাত্রা ও চাপের সাথে মিলিতভাবে এটি ব্যবহার করে আপেক্ষিক আর্দ্রতা গণনা করা যায়। বায়ুমণ্ডলীয় পরিস্থিতি বিবেচনায় নিয়ে, মডেলের সর্বনিম্ন স্তর এবং ভূপৃষ্ঠের মধ্যে ইন্টারপোলেশনের মাধ্যমে ২ মিটার শিশিরবিন্দু তাপমাত্রা গণনা করা হয়। |
temperature_2m | কে | ১১১৩২ মিটার | স্থলভাগ, সমুদ্র বা অভ্যন্তরীণ জলাশয়ের পৃষ্ঠ থেকে ২ মিটার উপরে বায়ুর তাপমাত্রা। বায়ুমণ্ডলীয় পরিস্থিতি বিবেচনায় নিয়ে, মডেলের সর্বনিম্ন স্তর এবং পৃথিবীর পৃষ্ঠের মধ্যে ইন্টারপোলেশনের মাধ্যমে ২ মিটার তাপমাত্রা গণনা করা হয়। |
skin_temperature | কে | ১১১৩২ মিটার | পৃথিবীর পৃষ্ঠের তাপমাত্রা। পৃষ্ঠীয় তাপমাত্রা হলো সেই তাত্ত্বিক তাপমাত্রা যা পৃষ্ঠীয় শক্তির ভারসাম্য বজায় রাখার জন্য প্রয়োজন। এটি ভূপৃষ্ঠের সর্ব্বোচ্চ স্তরের তাপমাত্রাকে বোঝায়, যার কোনো তাপ ধারণ ক্ষমতা নেই এবং তাই এটি পৃষ্ঠীয় প্রবাহের পরিবর্তনে তাৎক্ষণিকভাবে সাড়া দিতে পারে। স্থলভাগ এবং সমুদ্রের উপর পৃষ্ঠীয় তাপমাত্রা ভিন্নভাবে গণনা করা হয়। |
soil_temperature_level_1 | কে | ১১১৩২ মিটার | ECMWF ইন্টিগ্রেটেড ফোরকাস্টিং সিস্টেমের স্তর ১ (০ - ৭ সেমি)-এর মাটির তাপমাত্রা। ভূপৃষ্ঠ ০ সেমি-তে অবস্থিত। মাটির তাপমাত্রা প্রতিটি স্তরের মাঝখানে নির্ধারণ করা হয় এবং তাদের মধ্যবর্তী সংযোগস্থলে তাপ স্থানান্তর গণনা করা হয়। এটি ধরে নেওয়া হয় যে সর্বনিম্ন স্তরের তলদেশ থেকে কোনো তাপ স্থানান্তর হয় না। |
soil_temperature_level_2 | কে | ১১১৩২ মিটার | ECMWF সমন্বিত পূর্বাভাস সিস্টেমের ২ নং স্তরের (৭-২৮ সেমি) মাটির তাপমাত্রা। |
soil_temperature_level_3 | কে | ১১১৩২ মিটার | ECMWF সমন্বিত পূর্বাভাস সিস্টেমের ৩ নং স্তরের (২৮-১০০ সেমি) মাটির তাপমাত্রা। |
soil_temperature_level_4 | কে | ১১১৩২ মিটার | ECMWF সমন্বিত পূর্বাভাস সিস্টেমের স্তর ৪ (১০০-২৮৯ সেমি)-এর মাটির তাপমাত্রা। |
lake_bottom_temperature | কে | ১১১৩২ মিটার | অভ্যন্তরীণ জলাশয় (হ্রদ, জলাধার, নদী) এবং উপকূলীয় জলের তলদেশের তাপমাত্রা। ইন্টিগ্রেটেড ফোরকাস্টিং সিস্টেমে বিশ্বের সমস্ত প্রধান অভ্যন্তরীণ জলাশয়ের জলের তাপমাত্রা এবং হ্রদের বরফকে উপস্থাপন করার জন্য ECMWF ২০১৫ সালের মে মাসে একটি হ্রদ মডেল চালু করে। এই মডেলটি সময়ের সাথে সাথে হ্রদের গভীরতা এবং পৃষ্ঠের ক্ষেত্রফল (বা আংশিক আচ্ছাদন) স্থির রাখে। |
lake_ice_depth | এম | ১১১৩২ মিটার | অভ্যন্তরীণ জলাশয় (হ্রদ, জলাধার ও নদী) এবং উপকূলীয় জলের উপর বরফের পুরুত্ব। ইসিএমডব্লিউএফ ইন্টিগ্রেটেড ফোরকাস্টিং সিস্টেম (আইএফএস) অভ্যন্তরীণ জলাশয় (হ্রদ, জলাধার ও নদী) এবং উপকূলীয় জলের উপর বরফ গঠন ও গলনকে উপস্থাপন করে। এখানে একটি একক বরফের স্তরকে দেখানো হয়। এই প্যারামিটারটি হলো সেই বরফের স্তরের পুরুত্ব। |
lake_ice_temperature | কে | ১১১৩২ মিটার | অভ্যন্তরীণ জলাশয় (হ্রদ, জলাধার, নদী) এবং উপকূলীয় জলের বরফের উপরিভাগের তাপমাত্রা। ECMWF ইন্টিগ্রেটেড ফোরকাস্টিং সিস্টেম হ্রদের উপর বরফ গঠন এবং গলন উপস্থাপন করে। এখানে একটি একক বরফের স্তর দেখানো হয়। |
lake_mix_layer_depth | এম | ১১১৩২ মিটার | অভ্যন্তরীণ জলাশয় (হ্রদ, জলাধার এবং নদী) বা উপকূলীয় জলের সবচেয়ে উপরের স্তরের পুরুত্ব, যা ভালোভাবে মিশ্রিত এবং যার তাপমাত্রা গভীরতার সাথে প্রায় স্থির থাকে (তাপমাত্রার অভিন্ন বন্টন)। ECMWF ইন্টিগ্রেটেড ফোরকাস্টিং সিস্টেম অভ্যন্তরীণ জলাশয়গুলোকে উল্লম্বভাবে দুটি স্তর দ্বারা উপস্থাপন করে: উপরে মিশ্র স্তর এবং নিচে থার্মোক্লাইন। থার্মোক্লাইনের উপরের সীমানা মিশ্র স্তরের তলদেশে এবং নিচের সীমানা হ্রদের তলদেশে অবস্থিত। মিশ্র স্তরের মধ্যে মিশ্রণ ঘটতে পারে যখন পৃষ্ঠের (এবং পৃষ্ঠের কাছাকাছি) জলের ঘনত্ব নিচের জলের ঘনত্বের চেয়ে বেশি হয়। হ্রদের পৃষ্ঠে বাতাসের ক্রিয়ার মাধ্যমেও মিশ্রণ ঘটতে পারে। |
lake_mix_layer_temperature | কে | ১১১৩২ মিটার | অভ্যন্তরীণ জলাশয় (হ্রদ, জলাধার এবং নদী) বা উপকূলীয় জলের সবচেয়ে উপরের স্তরের তাপমাত্রা, যা ভালোভাবে মিশ্রিত থাকে। ECMWF ইন্টিগ্রেটেড ফোরকাস্টিং সিস্টেম অভ্যন্তরীণ জলাশয়গুলোকে উল্লম্বভাবে দুটি স্তরে উপস্থাপন করে: উপরে মিশ্র স্তর এবং নিচে থার্মোক্লাইন। থার্মোক্লাইনের উপরের সীমানা মিশ্র স্তরের তলদেশে এবং নিচের সীমানা হ্রদের তলদেশে অবস্থিত। মিশ্র স্তরের মধ্যে মিশ্রণ ঘটতে পারে যখন পৃষ্ঠের (এবং পৃষ্ঠের কাছাকাছি) জলের ঘনত্ব নিচের জলের ঘনত্বের চেয়ে বেশি হয়। হ্রদের পৃষ্ঠে বাতাসের ক্রিয়ার মাধ্যমেও মিশ্রণ ঘটতে পারে। |
lake_shape_factor | ১১১৩২ মিটার | এই প্যারামিটারটি অভ্যন্তরীণ জলাশয় (হ্রদ, জলাধার এবং নদী) এবং উপকূলীয় জলের থার্মোক্লাইন স্তরে গভীরতার সাথে তাপমাত্রার পরিবর্তন পদ্ধতি বর্ণনা করে। এটি হ্রদের তলদেশের তাপমাত্রা এবং হ্রদ-সম্পর্কিত অন্যান্য প্যারামিটার গণনা করতে ব্যবহৃত হয়। ECMWF ইন্টিগ্রেটেড ফোরকাস্টিং সিস্টেম অভ্যন্তরীণ এবং উপকূলীয় জলাশয়গুলিকে উল্লম্বভাবে দুটি স্তরের মাধ্যমে উপস্থাপন করে: উপরে মিশ্র স্তর এবং নীচে থার্মোক্লাইন, যেখানে গভীরতার সাথে তাপমাত্রার পরিবর্তন ঘটে। | |
lake_total_layer_temperature | কে | ১১১৩২ মিটার | অভ্যন্তরীণ জলাশয় (হ্রদ, জলাধার ও নদী) এবং উপকূলীয় জলের মোট জলস্তম্ভের গড় তাপমাত্রা। ECMWF ইন্টিগ্রেটেড ফোরকাস্টিং সিস্টেম অভ্যন্তরীণ জলাশয়গুলোকে উল্লম্বভাবে দুটি স্তরে উপস্থাপন করে: উপরে মিশ্র স্তর এবং নিচে থার্মোক্লাইন, যেখানে গভীরতার সাথে তাপমাত্রার পরিবর্তন ঘটে। এই প্যারামিটারটি হলো দুটি স্তরের গড়। |
snow_albedo | ১১১৩২ মিটার | একে সৌর বর্ণালীর মধ্যে, প্রত্যক্ষ এবং বিক্ষিপ্ত উভয় প্রকার বিকিরণের ক্ষেত্রে, বরফ দ্বারা প্রতিফলিত সৌর (স্বল্পতরঙ্গ) বিকিরণের ভগ্নাংশ হিসাবে সংজ্ঞায়িত করা হয়। এটি বরফে আচ্ছাদিত গ্রিড সেলগুলির প্রতিফলন ক্ষমতার একটি পরিমাপ। এর মান ০ থেকে ১-এর মধ্যে পরিবর্তিত হয়। সাধারণত, ০.৮ বা তার বেশি অ্যালবেডো মানের ক্ষেত্রে বরফ ও তুষারের প্রতিফলন ক্ষমতা বেশি থাকে। | |
snow_cover | ১১১৩২ মিটার | এটি সেল / গ্রিড-বক্সের যে অংশ বরফ দ্বারা আবৃত, তার ভগ্নাংশ (০-১) নির্দেশ করে (যা ERA5-এর মেঘাচ্ছন্নতার ক্ষেত্রের অনুরূপ)। | |
snow_density | কেজি/মি^৩ | ১১১৩২ মিটার | তুষার স্তরে প্রতি ঘনমিটারে তুষারের ভর। ECMWF ইন্টিগ্রেটেড ফোরকাস্ট সিস্টেম (IFS) মডেলটি তুষারকে মাটির সর্ববৃহৎ স্তরের উপরে একটি একক অতিরিক্ত স্তর হিসেবে দেখায়। তুষার গ্রিড বক্সের সম্পূর্ণ বা আংশিক অংশকে আবৃত করতে পারে। |
snow_depth | এম | ১১১৩২ মিটার | ভূমিতে থাকা বরফের পুরুত্বের তাৎক্ষণিক গ্রিড-বক্স গড় (গাছের পাতার উপরের বরফ বাদে)। |
snow_depth_water_equivalent | জলের সমতুল্য মিটার | ১১১৩২ মিটার | একটি গ্রিড বক্সের তুষারাবৃত এলাকা থেকে পরিমাপকৃত তুষারের গভীরতা। এর একক হলো মিটার ওয়াটার ইকুইভ্যালেন্ট (জল সমতুল্য), অর্থাৎ, তুষার গলে গিয়ে পুরো গ্রিড বক্স জুড়ে সমানভাবে ছড়িয়ে পড়লে জলের যে গভীরতা হতো, এটি সেই গভীরতা। ECMWF ইন্টিগ্রেটেড ফোরকাস্ট সিস্টেম তুষারকে মাটির সর্ব্বোচ্চ স্তরের উপরে একটি একক অতিরিক্ত স্তর হিসেবে দেখায়। তুষার গ্রিড বক্সের সম্পূর্ণ বা আংশিক অংশকে আবৃত করতে পারে। |
snowfall_sum | জলের সমতুল্য মিটার | ১১১৩২ মিটার | পৃথিবীর পৃষ্ঠে পতিত মোট সঞ্চিত তুষার। এটি বৃহৎ-মাপের বায়ুমণ্ডলীয় প্রবাহ (অনুভূমিক মাপ প্রায় কয়েকশ মিটারের বেশি) এবং পরিচলনের কারণে সৃষ্ট তুষার নিয়ে গঠিত, যেখানে উষ্ণ বায়ুর ক্ষুদ্রতর মাপের এলাকা (প্রায় ৫ কিমি থেকে কয়েকশ কিলোমিটার) উপরে ওঠে। যে সময়কালে এই চলকটি সঞ্চিত হয়েছে, সেই সময়ের মধ্যে যদি তুষার গলে যায়, তবে এর পরিমাণ তুষারের গভীরতার চেয়ে বেশি হবে। এই চলকটি হলো পূর্বাভাসের সময় শুরু থেকে পূর্বাভাসের ধাপ শেষ পর্যন্ত সঞ্চিত মোট জলের পরিমাণ। প্রদত্ত এককগুলো পরিমাপ করে যে, তুষার গলে গ্রিড বক্সের উপর সমানভাবে ছড়িয়ে পড়লে জলের গভীরতা কত হতো। মডেলের চলকগুলোর সাথে পর্যবেক্ষণের তুলনা করার সময় সতর্কতা অবলম্বন করা উচিত, কারণ পর্যবেক্ষণগুলো প্রায়শই একটি মডেল গ্রিড বক্স এবং মডেল টাইম স্টেপের গড় প্রতিনিধিত্ব না করে, স্থান ও সময়ের একটি নির্দিষ্ট বিন্দুর স্থানীয় হয়ে থাকে। |
snowmelt_sum | জলের সমতুল্য মিটার | ১১১৩২ মিটার | গ্রিড বক্স জুড়ে তুষার গলনের গড় (তুষারের উপর গলন বের করতে, তুষার ভগ্নাংশ দিয়ে ভাগ করুন)। এই চলকটি পূর্বাভাসের সময় শুরু থেকে পূর্বাভাস ধাপের শেষ পর্যন্ত সঞ্চিত হয়। |
temperature_of_snow_layer | কে | ১১১৩২ মিটার | এই চলকটি ভূমি থেকে তুষার-বায়ু সংযোগস্থল পর্যন্ত তুষার স্তরের তাপমাত্রা নির্দেশ করে। ECMWF ইন্টিগ্রেটেড ফোরকাস্ট সিস্টেম (IFS) মডেলটি তুষারকে মাটির সর্ববৃহৎ স্তরের উপর একটি একক অতিরিক্ত স্তর হিসেবে উপস্থাপন করে। তুষার গ্রিড বক্সের সম্পূর্ণ বা আংশিক অংশকে আবৃত করতে পারে। |
skin_reservoir_content | জলের সমতুল্য মিটার | ১১১৩২ মিটার | উদ্ভিদের পাতার আচ্ছাদনে এবং/অথবা মাটির উপর একটি পাতলা স্তরে থাকা জলের পরিমাণ। এটি উদ্ভিদের পাতা দ্বারা আটকে থাকা বৃষ্টির জল এবং শিশির থেকে আসা জলের পরিমাণকে বোঝায়। একটি গ্রিড বক্সে সর্বোচ্চ কী পরিমাণ 'ত্বকীয় জলাধার' থাকতে পারে তা উদ্ভিদের ধরনের উপর নির্ভর করে এবং এর পরিমাণ শূন্যও হতে পারে। বাষ্পীভবনের মাধ্যমে জল এই 'ত্বকীয় জলাধার' থেকে বেরিয়ে যায়। |
volumetric_soil_water_layer_1 | আয়তন ভগ্নাংশ | ১১১৩২ মিটার | ECMWF সমন্বিত পূর্বাভাস সিস্টেমের মাটির স্তর ১ (০ - ৭ সেমি)-এ থাকা পানির পরিমাণ। ভূপৃষ্ঠ ০ সেমি-তে অবস্থিত। মাটির পানির আয়তন মাটির বুনন (বা শ্রেণিবিভাগ), মাটির গভীরতা এবং এর নিচের ভূগর্ভস্থ পানির স্তরের সাথে সম্পর্কিত। |
volumetric_soil_water_layer_2 | আয়তন ভগ্নাংশ | ১১১৩২ মিটার | ECMWF সমন্বিত পূর্বাভাস সিস্টেমের মাটির স্তর ২ (৭-২৮ সেমি)-এ পানির পরিমাণ। |
volumetric_soil_water_layer_3 | আয়তন ভগ্নাংশ | ১১১৩২ মিটার | ECMWF সমন্বিত পূর্বাভাস সিস্টেমের মাটির ৩ নং স্তর (২৮-১০০ সেমি)-এ থাকা পানির পরিমাণ। |
volumetric_soil_water_layer_4 | আয়তন ভগ্নাংশ | ১১১৩২ মিটার | ECMWF সমন্বিত পূর্বাভাস সিস্টেমের মাটির স্তর ৪ (১০০-২৮৯ সেমি)-এ পানির পরিমাণ। |
forecast_albedo | ১১১৩২ মিটার | এটি পৃথিবীর পৃষ্ঠের প্রতিফলন ক্ষমতার একটি পরিমাপ। এটি হলো সৌর বর্ণালীর মধ্যে, সরাসরি এবং বিক্ষিপ্ত উভয় প্রকার বিকিরণের ক্ষেত্রে, পৃথিবীর পৃষ্ঠ দ্বারা প্রতিফলিত সৌর (স্বল্পতরঙ্গ) বিকিরণের ভগ্নাংশ। এর মান ০ থেকে ১-এর মধ্যে থাকে। সাধারণত, বরফ ও তুষারের প্রতিফলন ক্ষমতা বেশি থাকে, যাদের অ্যালবেডোর মান ০.৮ বা তার বেশি; ভূমির ক্ষেত্রে এর মান প্রায় ০.১ থেকে ০.৪-এর মধ্যে এবং মহাসাগরের ক্ষেত্রে এর মান ০.১ বা তার কম। সূর্য থেকে আসা বিকিরণ (সৌর বা স্বল্পতরঙ্গ বিকিরণ) আংশিকভাবে মেঘ এবং বায়ুমণ্ডলের কণা (এরোসল) দ্বারা মহাকাশে প্রতিফলিত হয় এবং এর কিছু অংশ শোষিত হয়। বাকি অংশ পৃথিবীর পৃষ্ঠে আপতিত হয়, যেখানে এর কিছু অংশ প্রতিফলিত হয়। পৃথিবীর পৃষ্ঠ দ্বারা প্রতিফলিত অংশের পরিমাণ অ্যালবেডোর উপর নির্ভর করে। ECMWF ইন্টিগ্রেটেড ফোরকাস্টিং সিস্টেম (IFS)-এ একটি জলবায়ুগত পটভূমি অ্যালবেডো (কয়েক বছরের গড় পর্যবেক্ষণকৃত মান) ব্যবহার করা হয়, যা মডেল দ্বারা জল, বরফ এবং তুষারের উপর পরিবর্তিত হয়। অ্যালবেডো প্রায়শই শতাংশ (%) হিসাবে দেখানো হয়। | |
surface_latent_heat_flux_sum | J/m^2 | ১১১৩২ মিটার | অশান্ত ব্যাপনের মাধ্যমে পৃষ্ঠের সাথে সুপ্ত তাপের বিনিময়। এই চলকটি পূর্বাভাসের সময় শুরু থেকে পূর্বাভাস ধাপের শেষ পর্যন্ত সঞ্চিত হয়। মডেলের প্রচলিত নিয়ম অনুসারে, নিম্নগামী প্রবাহ ধনাত্মক। |
surface_net_solar_radiation_sum | J/m^2 | ১১১৩২ মিটার | পৃথিবীর পৃষ্ঠে পৌঁছানো সৌর বিকিরণের (যা শর্টওয়েভ বিকিরণ নামেও পরিচিত) পরিমাণ (সরাসরি এবং বিক্ষিপ্ত উভয়ই) থেকে পৃথিবীর পৃষ্ঠ দ্বারা প্রতিফলিত বিকিরণের পরিমাণ (যা অ্যালবেডো দ্বারা নিয়ন্ত্রিত হয়) বিয়োগ করলে যা পাওয়া যায়, তাকেই ভূপৃষ্ঠের নিট সৌর বিকিরণ বলা হয়। সূর্য থেকে আসা বিকিরণ (সৌর বা শর্টওয়েভ বিকিরণ) আংশিকভাবে মেঘ এবং বায়ুমণ্ডলের কণা (এরোসল) দ্বারা মহাকাশে প্রতিফলিত হয় এবং এর কিছু অংশ শোষিত হয়। বাকি অংশ পৃথিবীর পৃষ্ঠে আপতিত হয়, যেখানে এর কিছু অংশ প্রতিফলিত হয়। নিম্নগামী এবং প্রতিফলিত সৌর বিকিরণের পার্থক্যই হলো ভূপৃষ্ঠের মোট সৌর বিকিরণ। এই চলকটি পূর্বাভাসের সময় শুরু থেকে পূর্বাভাস ধাপের শেষ পর্যন্ত সঞ্চিত হয়। এর একক হলো জুল প্রতি বর্গমিটার (J m-2)। ওয়াট প্রতি বর্গমিটারে (W m-2) রূপান্তর করতে, সঞ্চিত মানগুলোকে সেকেন্ডে প্রকাশিত সঞ্চয়ন সময়কাল দ্বারা ভাগ করতে হবে। উল্লম্ব ফ্লাক্সের জন্য ECMWF-এর প্রচলিত নিয়ম অনুযায়ী, নিচের দিকে ফ্লাক্স ধনাত্মক ধরা হয়। |
surface_net_thermal_radiation_sum | J/m^2 | ১১১৩২ মিটার | পৃষ্ঠে মোট তাপীয় বিকিরণ। পূর্বাভাসের সময় শুরু থেকে পূর্বাভাস ধাপের শেষ পর্যন্ত সঞ্চিত ক্ষেত্র। মডেলের প্রচলিত নিয়ম অনুযায়ী নিম্নগামী ফ্লাক্স ধনাত্মক। |
surface_sensible_heat_flux_sum | J/m^2 | ১১১৩২ মিটার | অশান্ত বায়ুপ্রবাহের প্রভাবে পৃথিবীর পৃষ্ঠ এবং বায়ুমণ্ডলের মধ্যে তাপের স্থানান্তর (তবে ঘনীভবন বা বাষ্পীভবনের ফলে সৃষ্ট কোনো তাপ স্থানান্তর এর অন্তর্ভুক্ত নয়)। বোধগম্য তাপ প্রবাহের মাত্রা পৃষ্ঠ এবং তার উপরের বায়ুমণ্ডলের তাপমাত্রার পার্থক্য, বাতাসের গতি এবং পৃষ্ঠের অমসৃণতা দ্বারা নিয়ন্ত্রিত হয়। উদাহরণস্বরূপ, একটি উষ্ণ পৃষ্ঠের উপর শীতল বায়ু থাকলে তা স্থলভাগ (বা মহাসাগর) থেকে বায়ুমণ্ডলে একটি বোধগম্য তাপ প্রবাহ তৈরি করবে। এটি একটি একক স্তরের চলক এবং এটি পূর্বাভাসের সময় শুরু থেকে পূর্বাভাস ধাপের শেষ পর্যন্ত সঞ্চিত হয়। এর একক হলো জুল প্রতি বর্গমিটার (J m-2)। ওয়াট প্রতি বর্গমিটারে (W m-2) রূপান্তর করতে, সঞ্চিত মানগুলিকে সেকেন্ডে প্রকাশিত সঞ্চয়ন সময়কাল দ্বারা ভাগ করতে হবে। উল্লম্ব প্রবাহের জন্য ECMWF-এর প্রচলিত নিয়ম অনুযায়ী, নিচের দিকে প্রবাহ ধনাত্মক। |
surface_solar_radiation_downwards_sum | J/m^2 | ১১১৩২ মিটার | পৃথিবীর পৃষ্ঠে পৌঁছানো সৌর বিকিরণের (যা শর্টওয়েভ বিকিরণ নামেও পরিচিত) পরিমাণ। এই চলকটি সরাসরি এবং বিক্ষিপ্ত উভয় প্রকার সৌর বিকিরণ নিয়ে গঠিত। সূর্য থেকে আসা বিকিরণ (সৌর বা শর্টওয়েভ বিকিরণ) বায়ুমণ্ডলের মেঘ এবং কণা (এরোসল) দ্বারা আংশিকভাবে মহাকাশে প্রতিফলিত হয় এবং এর কিছু অংশ শোষিত হয়। বাকি অংশ পৃথিবীর পৃষ্ঠে আপতিত হয় (যা এই চলক দ্বারা উপস্থাপিত)। মোটামুটি ভালো আনুমানিক হিসাবে, এই চলকটি হলো ভূপৃষ্ঠে একটি পাইরানোমিটার (সৌর বিকিরণ পরিমাপের জন্য ব্যবহৃত একটি যন্ত্র) দ্বারা পরিমাপ করা মানের মডেল সমতুল্য। তবে, মডেলের চলকগুলোর সাথে পর্যবেক্ষণের তুলনা করার সময় সতর্কতা অবলম্বন করা উচিত, কারণ পর্যবেক্ষণগুলো প্রায়শই একটি মডেল গ্রিড বক্স এবং মডেল টাইম স্টেপের গড় উপস্থাপন না করে, স্থান ও সময়ের একটি নির্দিষ্ট বিন্দুর স্থানীয় হয়ে থাকে। এই চলকটি পূর্বাভাসের সময় শুরু থেকে পূর্বাভাসের ধাপ শেষ পর্যন্ত সঞ্চিত হয়। এর একক হলো জুল প্রতি বর্গমিটার (J m-2)। ওয়াট প্রতি বর্গমিটারে (W m-2) রূপান্তর করতে, সঞ্চিত মানগুলোকে সেকেন্ডে প্রকাশিত সঞ্চয়ন সময়কাল দ্বারা ভাগ করতে হবে। উল্লম্ব ফ্লাক্সের ক্ষেত্রে ECMWF প্রথা অনুযায়ী নিম্নমুখী ফ্লাক্স ধনাত্মক। |
surface_thermal_radiation_downwards_sum | J/m^2 | ১১১৩২ মিটার | বায়ুমণ্ডল এবং মেঘ থেকে নির্গত তাপীয় (যা দীর্ঘতরঙ্গ বা ভূ-পৃষ্ঠীয় বিকিরণ নামেও পরিচিত) বিকিরণের যে পরিমাণ পৃথিবীর পৃষ্ঠে পৌঁছায়। পৃথিবীর পৃষ্ঠ থেকে তাপীয় বিকিরণ নির্গত হয়, যার কিছু অংশ বায়ুমণ্ডল এবং মেঘ দ্বারা শোষিত হয়। একইভাবে বায়ুমণ্ডল এবং মেঘ সব দিকে তাপীয় বিকিরণ নির্গত করে, যার কিছু অংশ পৃষ্ঠে পৌঁছায় (যা এই চলক দ্বারা প্রকাশ করা হয়)। এই চলকটি পূর্বাভাসের সময় শুরু থেকে পূর্বাভাসের ধাপ শেষ পর্যন্ত সঞ্চিত হয়। এর একক হলো জুল প্রতি বর্গমিটার (J m-2)। ওয়াট প্রতি বর্গমিটারে (W m-2) রূপান্তর করতে, সঞ্চিত মানগুলোকে সেকেন্ডে প্রকাশিত সঞ্চয়ন সময়কাল দিয়ে ভাগ করতে হবে। উল্লম্ব ফ্লাক্সের জন্য ECMWF-এর প্রচলিত নিয়ম অনুযায়ী, নিচের দিক ধনাত্মক। |
evaporation_from_bare_soil_sum | জলের সমতুল্য মিটার | ১১১৩২ মিটার | ভূমির উপরিভাগের অনাবৃত মাটি থেকে বাষ্পীভবনের পরিমাণ। এই চলকটি পূর্বাভাসের সময় শুরু থেকে পূর্বাভাস ধাপের শেষ পর্যন্ত সঞ্চিত হয়। |
evaporation_from_open_water_surfaces_excluding_oceans_sum | জলের সমতুল্য মিটার | ১১১৩২ মিটার | হ্রদ এবং প্লাবিত এলাকার মতো ভূপৃষ্ঠের জলাধার থেকে বাষ্পীভবনের পরিমাণ, তবে মহাসাগর এর অন্তর্ভুক্ত নয়। এই চলকটি পূর্বাভাসের সময় শুরু থেকে পূর্বাভাস ধাপের শেষ পর্যন্ত সঞ্চিত হয়। |
evaporation_from_the_top_of_canopy_sum | জলের সমতুল্য মিটার | ১১১৩২ মিটার | ক্যানোপির শীর্ষে অবস্থিত ক্যানোপি ইন্টারসেপশন রিজার্ভার থেকে বাষ্পীভবনের পরিমাণ। এই চলকটি পূর্বাভাসের সময় শুরু থেকে পূর্বাভাস ধাপের শেষ পর্যন্ত সঞ্চিত হয়। |
evaporation_from_vegetation_transpiration_sum | জলের সমতুল্য মিটার | ১১১৩২ মিটার | উদ্ভিদের প্রস্বেদন থেকে বাষ্পীভবনের পরিমাণ। এর অর্থ মূল দ্বারা জল নিষ্কাশনের মতোই, অর্থাৎ মাটির বিভিন্ন স্তর থেকে শোষিত জলের পরিমাণ। এই চলকটি পূর্বাভাসের সময় শুরু থেকে পূর্বাভাস ধাপের শেষ পর্যন্ত সঞ্চিত হয়। |
potential_evaporation_sum | এম | ১১১৩২ মিটার | বর্তমান ECMWF মডেলে সম্ভাব্য বাষ্পীভবন (pev) গণনা করা হয়, যেখানে উদ্ভিদের চলকগুলোকে "শস্য/মিশ্র চাষ" হিসেবে সেট করে এবং মাটির আর্দ্রতার কোনো চাপ নেই ধরে নিয়ে ভূপৃষ্ঠের শক্তি ভারসাম্য রুটিনে দ্বিতীয়বার কল করা হয়। অন্য কথায়, কৃষি জমির জন্য বাষ্পীভবন গণনা করা হয় যেন তাতে পর্যাপ্ত জলসেচ করা হয়েছে এবং ধরে নেওয়া হয় যে এই কৃত্রিম ভূপৃষ্ঠের অবস্থা দ্বারা বায়ুমণ্ডল প্রভাবিত হয় না। শেষেরটি সবসময় বাস্তবসম্মত নাও হতে পারে। যদিও pev-এর উদ্দেশ্য হলো সেচের প্রয়োজনীয়তার একটি আনুমানিক ধারণা দেওয়া, শুষ্ক বায়ুর কারণে সৃষ্ট অত্যধিক বাষ্পীভবনের ফলে শুষ্ক পরিস্থিতিতে এই পদ্ধতিটি অবাস্তব ফলাফল দিতে পারে। এই চলকটি পূর্বাভাসের সময় শুরু থেকে পূর্বাভাস ধাপের শেষ পর্যন্ত সঞ্চিত হয়। |
runoff_sum | এম | ১১১৩২ মিটার | বৃষ্টিপাত, গলিত বরফ বা মাটির গভীর থেকে আসা কিছু জল মাটিতেই সঞ্চিত থাকে। অন্যথায়, জল হয় ভূপৃষ্ঠের উপর দিয়ে (ভূ-পৃষ্ঠীয় প্রবাহ) অথবা মাটির নিচ দিয়ে (ভূ-পৃষ্ঠীয় প্রবাহ) নিষ্কাশিত হয়ে যায় এবং এই দুটির যোগফলকে সহজভাবে 'প্রবাহ' বলা হয়। এই চলকটি হলো পূর্বাভাসের সময় শুরু থেকে পূর্বাভাস ধাপের শেষ পর্যন্ত সঞ্চিত জলের মোট পরিমাণ। প্রবাহের একক হলো মিটারে গভীরতা। গ্রিড বক্সের উপর জল সমানভাবে ছড়িয়ে পড়লে তার যে গভীরতা হতো, এটি সেই গভীরতা। মডেলের চলকগুলোর সাথে পর্যবেক্ষণের তুলনা করার সময় সতর্কতা অবলম্বন করা উচিত, কারণ পর্যবেক্ষণগুলো প্রায়শই একটি গ্রিড বর্গক্ষেত্রের গড় না হয়ে কোনো নির্দিষ্ট বিন্দুর স্থানীয় হয়ে থাকে। পর্যবেক্ষণগুলো প্রায়শই এখানে উৎপাদিত সঞ্চিত মিটারের পরিবর্তে ভিন্ন এককে, যেমন মিমি/দিন, নেওয়া হয়। প্রবাহ হলো মাটিতে জলের প্রাপ্যতার একটি পরিমাপ এবং এটি, উদাহরণস্বরূপ, খরা বা বন্যার সূচক হিসাবে ব্যবহার করা যেতে পারে। প্রবাহ কীভাবে গণনা করা হয় সে সম্পর্কে আরও তথ্য IFS ফিজিক্যাল প্রসেসেস ডকুমেন্টেশনে দেওয়া আছে। |
snow_evaporation_sum | জলের সমতুল্য মিটার | ১১১৩২ মিটার | গ্রিড বক্স জুড়ে তুষার থেকে গড় বাষ্পীভবন (তুষারের উপর প্রবাহ বের করতে, তুষারের ভগ্নাংশ দিয়ে ভাগ করুন)। এই চলকটি পূর্বাভাসের সময় শুরু থেকে পূর্বাভাস ধাপের শেষ পর্যন্ত সঞ্চিত হয়। |
sub_surface_runoff_sum | এম | ১১১৩২ মিটার | বৃষ্টিপাত, গলিত বরফ বা মাটির গভীর থেকে আসা কিছু জল মাটিতেই সঞ্চিত থাকে। অন্যথায়, জল হয় ভূপৃষ্ঠের উপর দিয়ে (ভূ-পৃষ্ঠীয় প্রবাহ) অথবা মাটির নিচ দিয়ে (ভূ-পৃষ্ঠীয় প্রবাহ) নিষ্কাশিত হয়ে যায় এবং এই দুটির যোগফলকে সহজভাবে 'প্রবাহ' বলা হয়। এই চলকটি পূর্বাভাসের সময়কালের শুরু থেকে পূর্বাভাস ধাপের শেষ পর্যন্ত সঞ্চিত হয়। প্রবাহের একক হলো গভীরতা, যা মিটারে পরিমাপ করা হয়। গ্রিড বক্সের উপর জল যদি সমানভাবে ছড়িয়ে দেওয়া হতো, তবে তার গভীরতা এটাই হতো। মডেলের চলকগুলোর সাথে পর্যবেক্ষণের তুলনা করার সময় সতর্কতা অবলম্বন করা উচিত, কারণ পর্যবেক্ষণগুলো প্রায়শই একটি গ্রিড বর্গক্ষেত্রের গড় না হয়ে কোনো নির্দিষ্ট বিন্দুর স্থানীয় হয়ে থাকে। পর্যবেক্ষণগুলো প্রায়শই এখানে উৎপাদিত সঞ্চিত মিটারের পরিবর্তে ভিন্ন এককে, যেমন মিমি/দিন, নেওয়া হয়। প্রবাহ হলো মাটিতে জলের প্রাপ্যতার একটি পরিমাপ এবং এটি, উদাহরণস্বরূপ, খরা বা বন্যার সূচক হিসাবে ব্যবহার করা যেতে পারে। প্রবাহ কীভাবে গণনা করা হয় সে সম্পর্কে আরও তথ্য IFS ফিজিক্যাল প্রসেসেস ডকুমেন্টেশনে দেওয়া আছে। |
surface_runoff_sum | এম | ১১১৩২ মিটার | বৃষ্টিপাত, গলিত বরফ বা মাটির গভীর থেকে আসা কিছু জল মাটিতেই সঞ্চিত থাকে। অন্যথায়, জল হয় ভূপৃষ্ঠের উপর দিয়ে (ভূ-পৃষ্ঠীয় প্রবাহ) অথবা মাটির নিচ দিয়ে (ভূ-পৃষ্ঠীয় প্রবাহ) নিষ্কাশিত হয়ে যায় এবং এই দুটির যোগফলকে সহজভাবে 'প্রবাহ' বলা হয়। এই চলকটি হলো পূর্বাভাসের সময় শুরু থেকে পূর্বাভাস ধাপের শেষ পর্যন্ত সঞ্চিত জলের মোট পরিমাণ। প্রবাহের একক হলো মিটারে গভীরতা। গ্রিড বক্সের উপর জল সমানভাবে ছড়িয়ে পড়লে তার যে গভীরতা হতো, এটি সেই গভীরতা। মডেলের চলকগুলোর সাথে পর্যবেক্ষণের তুলনা করার সময় সতর্কতা অবলম্বন করা উচিত, কারণ পর্যবেক্ষণগুলো প্রায়শই একটি গ্রিড বর্গক্ষেত্রের গড় না হয়ে কোনো নির্দিষ্ট বিন্দুর স্থানীয় হয়ে থাকে। পর্যবেক্ষণগুলো প্রায়শই এখানে উৎপাদিত সঞ্চিত মিটারের পরিবর্তে ভিন্ন এককে, যেমন মিমি/দিন, নেওয়া হয়। প্রবাহ হলো মাটিতে জলের প্রাপ্যতার একটি পরিমাপ এবং এটি, উদাহরণস্বরূপ, খরা বা বন্যার সূচক হিসাবে ব্যবহার করা যেতে পারে। প্রবাহ কীভাবে গণনা করা হয় সে সম্পর্কে আরও তথ্য IFS ফিজিক্যাল প্রসেসেস ডকুমেন্টেশনে দেওয়া আছে। |
total_evaporation_sum | জলের সমতুল্য মিটার | ১১১৩২ মিটার | ভূপৃষ্ঠ থেকে বাষ্পীভূত হয়ে উপরের বাতাসে থাকা জলের মোট পরিমাণ, যার মধ্যে উদ্ভিদের প্রস্বেদনের একটি সরলীকৃত উপস্থাপনাও অন্তর্ভুক্ত। এই চলকটি পূর্বাভাসের শুরু থেকে শেষ পর্যন্ত গণনা করা হয়। ECMWF ইন্টিগ্রেটেড ফোরকাস্টিং সিস্টেমের প্রচলিত নিয়ম অনুযায়ী, নিম্নগামী প্রবাহকে ধনাত্মক ধরা হয়। সুতরাং, ঋণাত্মক মান বাষ্পীভবন এবং ধনাত্মক মান ঘনীভবন নির্দেশ করে। |
u_component_of_wind_10m | মি/সে | ১১১৩২ মিটার | ১০ মিটার বায়ুপ্রবাহের পূর্বমুখী উপাংশ। এটি হলো ভূপৃষ্ঠ থেকে দশ মিটার উচ্চতায় পূর্ব দিকে প্রবাহিত বায়ুর আনুভূমিক গতি, যা মিটার প্রতি সেকেন্ডে পরিমাপ করা হয়। এই চলকটিকে পর্যবেক্ষণের সাথে তুলনা করার সময় সতর্কতা অবলম্বন করা উচিত, কারণ বায়ুপ্রবাহের পর্যবেক্ষণগুলো ক্ষুদ্র স্থান ও সময়ের পরিসরে পরিবর্তিত হয় এবং স্থানীয় ভূখণ্ড, গাছপালা ও ভবন দ্বারা প্রভাবিত হয়, যা ECMWF ইন্টিগ্রেটেড ফোরকাস্টিং সিস্টেমে শুধুমাত্র গড় হিসাবে দেখানো হয়। এই চলকটিকে ১০ মিটার বায়ুপ্রবাহের V উপাংশের সাথে একত্রিত করে আনুভূমিক ১০ মিটার বায়ুপ্রবাহের গতি ও দিক নির্ণয় করা যায়। |
v_component_of_wind_10m | মি/সে | ১১১৩২ মিটার | ১০ মিটার বায়ুপ্রবাহের উত্তরমুখী উপাংশ। এটি হলো ভূপৃষ্ঠ থেকে দশ মিটার উচ্চতায় উত্তর দিকে প্রবাহিত বায়ুর আনুভূমিক গতি, যা মিটার প্রতি সেকেন্ডে পরিমাপ করা হয়। এই চলকটিকে পর্যবেক্ষণের সাথে তুলনা করার সময় সতর্কতা অবলম্বন করা উচিত, কারণ বায়ুপ্রবাহের পর্যবেক্ষণগুলো ক্ষুদ্র স্থান ও সময়ের পরিসরে পরিবর্তিত হয় এবং স্থানীয় ভূখণ্ড, গাছপালা ও ভবন দ্বারা প্রভাবিত হয়, যা ECMWF ইন্টিগ্রেটেড ফোরকাস্টিং সিস্টেমে শুধুমাত্র গড় হিসাবে দেখানো হয়। এই চলকটিকে ১০ মিটার বায়ুপ্রবাহের U উপাংশের সাথে একত্রিত করে আনুভূমিক ১০ মিটার বায়ুপ্রবাহের গতি ও দিক নির্ণয় করা যায়। |
surface_pressure | পা | ১১১৩২ মিটার | স্থলভাগ, সমুদ্র এবং অভ্যন্তরীণ জলাশয়ের পৃষ্ঠে বায়ুমণ্ডলের চাপ (প্রতি একক ক্ষেত্রফলে প্রযুক্ত বল)। এটি একটি নির্দিষ্ট বিন্দুতে অবস্থিত পৃথিবীর পৃষ্ঠের ক্ষেত্রফলের ঠিক উপরে উল্লম্বভাবে অবস্থিত একটি স্তম্ভে থাকা সমস্ত বায়ুর ওজনের পরিমাপ। বায়ুর ঘনত্ব গণনা করার জন্য ভূপৃষ্ঠের চাপ প্রায়শই তাপমাত্রার সাথে একত্রে ব্যবহৃত হয়। উচ্চতার সাথে চাপের তীব্র পরিবর্তনের কারণে পার্বত্য অঞ্চলের উপর নিম্নচাপ ও উচ্চচাপ ব্যবস্থা দেখা কঠিন হয়ে পড়ে, তাই এই উদ্দেশ্যে সাধারণত ভূপৃষ্ঠের চাপের পরিবর্তে গড় সমুদ্রপৃষ্ঠের চাপ ব্যবহার করা হয়। এই চলকের একক হলো প্যাসকেল (Pa)। ভূপৃষ্ঠের চাপ প্রায়শই হেক্টোপ্যাসকেল (hPa) এককে পরিমাপ করা হয় এবং কখনও কখনও মিলিবার (mb) নামক পুরোনো এককে প্রকাশ করা হয় (১ hPa = ১ mb = ১০০ Pa)। |
total_precipitation_sum | এম | ১১১৩২ মিটার | সঞ্চিত তরল এবং হিমায়িত জল, যার মধ্যে বৃষ্টি এবং তুষার অন্তর্ভুক্ত, যা পৃথিবীর পৃষ্ঠে পতিত হয়। এটি বৃহৎ-মাপের বৃষ্টিপাত (যে বৃষ্টিপাত বৃহৎ-মাপের আবহাওয়ার ধরণ, যেমন নিম্নচাপ এবং শীতল বায়ুপ্রবাহ দ্বারা উৎপন্ন হয়) এবং পরিচলন বৃষ্টিপাতের (যা পরিচলনের মাধ্যমে উৎপন্ন হয়, যখন বায়ুমণ্ডলের নিম্ন স্তরের বায়ু উপরের বায়ুর চেয়ে উষ্ণতর ও কম ঘন হওয়ায় উপরে ওঠে) সমষ্টি। বৃষ্টিপাতের চলকগুলোর মধ্যে কুয়াশা, শিশির বা সেই বৃষ্টিপাত অন্তর্ভুক্ত নয় যা পৃথিবীর পৃষ্ঠে পড়ার আগেই বায়ুমণ্ডলে বাষ্পীভূত হয়ে যায়। এই চলকটি পূর্বাভাসের সময়ের শুরু থেকে পূর্বাভাসের ধাপের শেষ পর্যন্ত সঞ্চিত হয়। বৃষ্টিপাতের একক হলো মিটারে গভীরতা। এটি সেই গভীরতা যা জল গ্রিড বক্সের উপর সমানভাবে ছড়িয়ে পড়লে হতো। মডেলের চলকগুলোর সাথে পর্যবেক্ষণের তুলনা করার সময় সতর্কতা অবলম্বন করা উচিত, কারণ পর্যবেক্ষণগুলো প্রায়শই একটি মডেল গ্রিড বক্স এবং মডেল টাইম স্টেপের গড় প্রতিনিধিত্ব না করে, স্থান ও সময়ের একটি নির্দিষ্ট বিন্দুর স্থানীয় হয়ে থাকে। |
leaf_area_index_high_vegetation | ক্ষেত্রফল ভগ্নাংশ | ১১১৩২ মিটার | উচ্চ উদ্ভিদ প্রজাতির ক্ষেত্রে, প্রতি একক আনুভূমিক ভূমি পৃষ্ঠতলে মোট সবুজ পাতার ক্ষেত্রফলের অর্ধেক। |
leaf_area_index_low_vegetation | ক্ষেত্রফল ভগ্নাংশ | ১১১৩২ মিটার | নিম্ন প্রজাতির উদ্ভিদের ক্ষেত্রে, প্রতি একক আনুভূমিক ভূমি পৃষ্ঠতলে মোট সবুজ পাতার ক্ষেত্রফলের অর্ধেক। |
dewpoint_temperature_2m_min | কে | ১১১৩২ মিটার | দৈনিক সর্বনিম্ন শিশিরবিন্দু_তাপমাত্রা_২মি মান |
dewpoint_temperature_2m_max | কে | ১১১৩২ মিটার | দৈনিক সর্বোচ্চ শিশিরবিন্দু_তাপমাত্রা_২মি মান |
temperature_2m_min | কে | ১১১৩২ মিটার | দৈনিক সর্বনিম্ন তাপমাত্রা_২মি মান |
temperature_2m_max | কে | ১১১৩২ মিটার | দৈনিক সর্বোচ্চ তাপমাত্রা_২মি মান |
skin_temperature_min | কে | ১১১৩২ মিটার | দৈনিক সর্বনিম্ন ত্বকের তাপমাত্রার মান |
skin_temperature_max | কে | ১১১৩২ মিটার | দৈনিক সর্বোচ্চ ত্বকের তাপমাত্রার মান |
soil_temperature_level_1_min | কে | ১১১৩২ মিটার | দৈনিক সর্বনিম্ন মাটির তাপমাত্রা স্তর ১ মান |
soil_temperature_level_1_max | কে | ১১১৩২ মিটার | দৈনিক সর্বোচ্চ মাটির তাপমাত্রা স্তর ১ এর মান |
soil_temperature_level_2_min | কে | ১১১৩২ মিটার | দৈনিক সর্বনিম্ন মাটির তাপমাত্রা স্তর ২ মান |
soil_temperature_level_2_max | কে | ১১১৩২ মিটার | দৈনিক সর্বোচ্চ মাটির তাপমাত্রা স্তর ২ মান |
soil_temperature_level_3_min | কে | ১১১৩২ মিটার | দৈনিক সর্বনিম্ন মাটির তাপমাত্রা স্তর ৩ মান |
soil_temperature_level_3_max | কে | ১১১৩২ মিটার | দৈনিক সর্বোচ্চ মাটির তাপমাত্রা স্তর ৩ মান |
soil_temperature_level_4_min | কে | ১১১৩২ মিটার | দৈনিক সর্বনিম্ন মাটির তাপমাত্রা স্তর ৪ মান |
soil_temperature_level_4_max | কে | ১১১৩২ মিটার | দৈনিক সর্বোচ্চ মাটির তাপমাত্রা স্তর ৪ এর মান |
lake_bottom_temperature_min | কে | ১১১৩২ মিটার | দৈনিক সর্বনিম্ন হ্রদের তলদেশের তাপমাত্রার মান |
lake_bottom_temperature_max | কে | ১১১৩২ মিটার | দৈনিক সর্বোচ্চ হ্রদের তলদেশের তাপমাত্রার মান |
lake_ice_depth_min | এম | ১১১৩২ মিটার | দৈনিক সর্বনিম্ন হ্রদের বরফের গভীরতার মান |
lake_ice_depth_max | এম | ১১১৩২ মিটার | দৈনিক সর্বোচ্চ হ্রদের বরফের গভীরতার মান |
lake_ice_temperature_min | কে | ১১১৩২ মিটার | দৈনিক সর্বনিম্ন হ্রদের বরফের তাপমাত্রার মান |
lake_ice_temperature_max | কে | ১১১৩২ মিটার | দৈনিক সর্বোচ্চ হ্রদের বরফের তাপমাত্রার মান |
lake_mix_layer_depth_min | এম | ১১১৩২ মিটার | দৈনিক সর্বনিম্ন হ্রদের মিশ্র স্তরের গভীরতার মান |
lake_mix_layer_depth_max | এম | ১১১৩২ মিটার | দৈনিক সর্বোচ্চ হ্রদের মিশ্র স্তরের গভীরতার মান |
lake_mix_layer_temperature_min | কে | ১১১৩২ মিটার | দৈনিক সর্বনিম্ন হ্রদের মিশ্র স্তরের তাপমাত্রার মান |
lake_mix_layer_temperature_max | কে | ১১১৩২ মিটার | দৈনিক সর্বোচ্চ হ্রদের মিশ্র স্তরের তাপমাত্রার মান |
lake_shape_factor_min | ১১১৩২ মিটার | দৈনিক সর্বনিম্ন হ্রদের আকৃতি ফ্যাক্টর মান | |
lake_shape_factor_max | ১১১৩২ মিটার | দৈনিক সর্বোচ্চ হ্রদের আকৃতি ফ্যাক্টর মান | |
lake_total_layer_temperature_min | কে | ১১১৩২ মিটার | দৈনিক সর্বনিম্ন হ্রদের মোট স্তরের তাপমাত্রার মান |
lake_total_layer_temperature_max | কে | ১১১৩২ মিটার | দৈনিক সর্বোচ্চ হ্রদের মোট স্তরের তাপমাত্রার মান |
snow_albedo_min | ১১১৩২ মিটার | দৈনিক সর্বনিম্ন তুষার_অ্যালবেডো মান | |
snow_albedo_max | ১১১৩২ মিটার | দৈনিক সর্বোচ্চ তুষার_অ্যালবেডো মান | |
snow_cover_min | ১১১৩২ মিটার | দৈনিক সর্বনিম্ন তুষার_আচ্ছাদনের মান | |
snow_cover_max | ১১১৩২ মিটার | দৈনিক সর্বোচ্চ তুষার_আচ্ছাদনের মান | |
snow_density_min | কেজি/মি^৩ | ১১১৩২ মিটার | দৈনিক সর্বনিম্ন তুষার ঘনত্বের মান |
snow_density_max | কেজি/মি^৩ | ১১১৩২ মিটার | দৈনিক সর্বোচ্চ তুষার_ঘনত্বের মান |
snow_depth_min | এম | ১১১৩২ মিটার | দৈনিক সর্বনিম্ন তুষার_গভীরতার মান |
snow_depth_max | এম | ১১১৩২ মিটার | দৈনিক সর্বোচ্চ তুষার_গভীরতার মান |
snow_depth_water_equivalent_min | জলের সমতুল্য মিটার | ১১১৩২ মিটার | দৈনিক সর্বনিম্ন তুষার_গভীরতা_জল_সমতুল্য মান |
snow_depth_water_equivalent_max | জলের সমতুল্য মিটার | ১১১৩২ মিটার | দৈনিক সর্বোচ্চ তুষার_গভীরতা_জল_সমতুল্য মান |
snowfall_min | জলের সমতুল্য মিটার | ১১১৩২ মিটার | দৈনিক সর্বনিম্ন তুষারপাতের মান |
snowfall_max | জলের সমতুল্য মিটার | ১১১৩২ মিটার | দৈনিক সর্বোচ্চ তুষারপাতের মান |
snowmelt_min | জলের সমতুল্য মিটার | ১১১৩২ মিটার | দৈনিক সর্বনিম্ন তুষার গলন মান |
snowmelt_max | জলের সমতুল্য মিটার | ১১১৩২ মিটার | দৈনিক সর্বোচ্চ তুষার গলনের মান |
temperature_of_snow_layer_min | কে | ১১১৩২ মিটার | তুষার স্তরের দৈনিক সর্বনিম্ন তাপমাত্রার মান |
temperature_of_snow_layer_max | কে | ১১১৩২ মিটার | দৈনিক সর্বোচ্চ তুষার স্তরের তাপমাত্রার মান |
skin_reservoir_content_min | জলের সমতুল্য মিটার | ১১১৩২ মিটার | দৈনিক সর্বনিম্ন ত্বকের জলাধারের উপাদানের মান |
skin_reservoir_content_max | জলের সমতুল্য মিটার | ১১১৩২ মিটার | দৈনিক সর্বোচ্চ ত্বকের জলাধারের উপাদানের মান |
volumetric_soil_water_layer_1_min | আয়তন ভগ্নাংশ | ১১১৩২ মিটার | দৈনিক সর্বনিম্ন আয়তনিক_মাটির_জলের_স্তর_১ মান |
volumetric_soil_water_layer_1_max | আয়তন ভগ্নাংশ | ১১১৩২ মিটার | দৈনিক সর্বোচ্চ আয়তনিক_মাটির_জলের_স্তর_১ মান |
volumetric_soil_water_layer_2_min | আয়তন ভগ্নাংশ | ১১১৩২ মিটার | দৈনিক সর্বনিম্ন আয়তনিক_মাটির_জলের_স্তর_২ মান |
volumetric_soil_water_layer_2_max | আয়তন ভগ্নাংশ | ১১১৩২ মিটার | দৈনিক সর্বোচ্চ আয়তনিক_মাটির_জলের_স্তর_২ মান |
volumetric_soil_water_layer_3_min | আয়তন ভগ্নাংশ | ১১১৩২ মিটার | দৈনিক সর্বনিম্ন আয়তনিক_মাটির_জলের_স্তর_৩ মান |
volumetric_soil_water_layer_3_max | আয়তন ভগ্নাংশ | ১১১৩২ মিটার | দৈনিক সর্বোচ্চ আয়তনিক_মাটির_জলের_স্তর_৩ মান |
volumetric_soil_water_layer_4_min | আয়তন ভগ্নাংশ | ১১১৩২ মিটার | দৈনিক সর্বনিম্ন আয়তনিক_মাটির_জলের_স্তর_৪ মান |
volumetric_soil_water_layer_4_max | আয়তন ভগ্নাংশ | ১১১৩২ মিটার | দৈনিক সর্বোচ্চ আয়তনিক_মাটির_জলের_স্তর_৪ মান |
forecast_albedo_min | ১১১৩২ মিটার | দৈনিক সর্বনিম্ন পূর্বাভাস_অ্যালবেডো মান | |
forecast_albedo_max | ১১১৩২ মিটার | দৈনিক সর্বোচ্চ পূর্বাভাস_অ্যালবেডো মান | |
surface_latent_heat_flux_min | J/m^2 | ১১১৩২ মিটার | দৈনিক সর্বনিম্ন পৃষ্ঠের সুপ্ত তাপ প্রবাহের মান |
surface_latent_heat_flux_max | J/m^2 | ১১১৩২ মিটার | দৈনিক সর্বোচ্চ পৃষ্ঠের সুপ্ত তাপ প্রবাহের মান |
surface_net_solar_radiation_min | J/m^2 | ১১১৩২ মিটার | দৈনিক সর্বনিম্ন ভূপৃষ্ঠের নিট সৌর বিকিরণ মান |
surface_net_solar_radiation_max | J/m^2 | ১১১৩২ মিটার | দৈনিক সর্বোচ্চ ভূপৃষ্ঠের নিট সৌর বিকিরণ মান |
surface_net_thermal_radiation_min | J/m^2 | ১১১৩২ মিটার | দৈনিক সর্বনিম্ন পৃষ্ঠ_নেট_তাপীয়_বিকিরণ মান |
surface_net_thermal_radiation_max | J/m^2 | ১১১৩২ মিটার | দৈনিক সর্বোচ্চ পৃষ্ঠ_নেট_তাপীয়_বিকিরণ মান |
surface_sensible_heat_flux_min | J/m^2 | ১১১৩২ মিটার | দৈনিক সর্বনিম্ন ভূপৃষ্ঠের সংবেদনশীল তাপ প্রবাহের মান |
surface_sensible_heat_flux_max | J/m^2 | ১১১৩২ মিটার | দৈনিক সর্বোচ্চ ভূপৃষ্ঠের সংবেদনশীল তাপ প্রবাহের মান |
surface_solar_radiation_downwards_min | J/m^2 | ১১১৩২ মিটার | দৈনিক সর্বনিম্ন ভূপৃষ্ঠের সৌর বিকিরণের নিম্নমুখী মান |
surface_solar_radiation_downwards_max | J/m^2 | ১১১৩২ মিটার | দৈনিক সর্বোচ্চ ভূপৃষ্ঠের সৌর বিকিরণের নিম্নমুখী মান |
surface_thermal_radiation_downwards_min | J/m^2 | ১১১৩২ মিটার | দৈনিক সর্বনিম্ন পৃষ্ঠ_তাপীয়_বিকিরণ_নিম্নমুখী মান |
surface_thermal_radiation_downwards_max | J/m^2 | ১১১৩২ মিটার | দৈনিক সর্বোচ্চ পৃষ্ঠ_তাপীয়_বিকিরণ_নিম্নমুখী মান |
evaporation_from_bare_soil_min | জলের সমতুল্য মিটার | ১১১৩২ মিটার | অনাবৃত মাটি থেকে দৈনিক সর্বনিম্ন বাষ্পীভবনের মান |
evaporation_from_bare_soil_max | জলের সমতুল্য মিটার | ১১১৩২ মিটার | অনাবৃত মাটি থেকে দৈনিক সর্বোচ্চ বাষ্পীভবনের মান |
evaporation_from_open_water_surfaces_excluding_oceans_min | জলের সমতুল্য মিটার | ১১১৩২ মিটার | মহাসাগর ব্যতীত উন্মুক্ত জলাশয়ের পৃষ্ঠতল থেকে দৈনিক সর্বনিম্ন বাষ্পীভবনের মান |
evaporation_from_open_water_surfaces_excluding_oceans_max | জলের সমতুল্য মিটার | ১১১৩২ মিটার | মহাসাগর ব্যতীত উন্মুক্ত জলাশয়ের পৃষ্ঠতল থেকে দৈনিক সর্বোচ্চ বাষ্পীভবনের মান |
evaporation_from_the_top_of_canopy_min | জলের সমতুল্য মিটার | ১১১৩২ মিটার | ক্যানোপির শীর্ষ থেকে দৈনিক সর্বনিম্ন বাষ্পীভবনের মান |
evaporation_from_the_top_of_canopy_max | জলের সমতুল্য মিটার | ১১১৩২ মিটার | ক্যানোপির শীর্ষ থেকে দৈনিক সর্বোচ্চ বাষ্পীভবনের মান |
evaporation_from_vegetation_transpiration_min | জলের সমতুল্য মিটার | ১১১৩২ মিটার | দৈনিক সর্বনিম্ন বাষ্পীভবন_উদ্ভিদ_প্রস্বেদন মান |
evaporation_from_vegetation_transpiration_max | জলের সমতুল্য মিটার | ১১১৩২ মিটার | উদ্ভিদ প্রস্বেদন থেকে দৈনিক সর্বোচ্চ বাষ্পীভবনের মান |
potential_evaporation_min | এম | ১১১৩২ মিটার | দৈনিক সর্বনিম্ন সম্ভাব্য বাষ্পীভবন মান |
potential_evaporation_max | এম | ১১১৩২ মিটার | দৈনিক সর্বোচ্চ সম্ভাব্য বাষ্পীভবন মান |
runoff_min | এম | ১১১৩২ মিটার | দৈনিক সর্বনিম্ন প্রবাহ মান |
runoff_max | এম | ১১১৩২ মিটার | দৈনিক সর্বোচ্চ প্রবাহের মান |
snow_evaporation_min | জলের সমতুল্য মিটার | ১১১৩২ মিটার | দৈনিক সর্বনিম্ন তুষার বাষ্পীভবন মান |
snow_evaporation_max | জলের সমতুল্য মিটার | ১১১৩২ মিটার | দৈনিক সর্বোচ্চ তুষার বাষ্পীভবন মান |
sub_surface_runoff_min | এম | ১১১৩২ মিটার | দৈনিক সর্বনিম্ন ভূগর্ভস্থ জলপ্রবাহের মান |
sub_surface_runoff_max | এম | ১১১৩২ মিটার | দৈনিক সর্বোচ্চ ভূগর্ভস্থ প্রবাহের মান |
surface_runoff_min | এম | ১১১৩২ মিটার | দৈনিক সর্বনিম্ন ভূপৃষ্ঠের প্রবাহের মান |
surface_runoff_max | এম | ১১১৩২ মিটার | দৈনিক সর্বোচ্চ ভূপৃষ্ঠ_প্রবাহের মান |
total_evaporation_min | জলের সমতুল্য মিটার | ১১১৩২ মিটার | দৈনিক সর্বনিম্ন মোট বাষ্পীভবন মান |
total_evaporation_max | জলের সমতুল্য মিটার | ১১১৩২ মিটার | দৈনিক সর্বোচ্চ মোট বাষ্পীভবন মান |
u_component_of_wind_10m_min | মি/সে | ১১১৩২ মিটার | দৈনিক সর্বনিম্ন u_component_of_wind_10m মান |
u_component_of_wind_10m_max | মি/সে | ১১১৩২ মিটার | দৈনিক সর্বোচ্চ u_component_of_wind_10m মান |
v_component_of_wind_10m_min | মি/সে | ১১১৩২ মিটার | দৈনিক সর্বনিম্ন v_component_of_wind_10m মান |
v_component_of_wind_10m_max | মি/সে | ১১১৩২ মিটার | দৈনিক সর্বোচ্চ v_component_of_wind_10m মান |
surface_pressure_min | পা | ১১১৩২ মিটার | দৈনিক সর্বনিম্ন ভূপৃষ্ঠের চাপের মান |
surface_pressure_max | পা | ১১১৩২ মিটার | দৈনিক সর্বোচ্চ ভূপৃষ্ঠের চাপের মান |
total_precipitation_min | এম | ১১১৩২ মিটার | দৈনিক সর্বনিম্ন মোট বৃষ্টিপাতের মান |
total_precipitation_max | এম | ১১১৩২ মিটার | দৈনিক সর্বোচ্চ মোট বৃষ্টিপাতের মান |
leaf_area_index_high_vegetation_min | ক্ষেত্রফল ভগ্নাংশ | ১১১৩২ মিটার | দৈনিক সর্বনিম্ন leaf_area_index_high_vegetation মান |
leaf_area_index_high_vegetation_max | ক্ষেত্রফল ভগ্নাংশ | ১১১৩২ মিটার | দৈনিক সর্বোচ্চ leaf_area_index_high_vegetation মান |
leaf_area_index_low_vegetation_min | ক্ষেত্রফল ভগ্নাংশ | ১১১৩২ মিটার | দৈনিক সর্বনিম্ন leaf_area_index_low_vegetation মান |
leaf_area_index_low_vegetation_max | ক্ষেত্রফল ভগ্নাংশ | ১১১৩২ মিটার | দৈনিক সর্বোচ্চ leaf_area_index_low_vegetation মান |
ছবির বৈশিষ্ট্য
ছবির বৈশিষ্ট্য
| নাম | প্রকার | বর্ণনা |
|---|---|---|
| দিন | INT | ক্যালেন্ডার দিন |
| মাস | INT | ক্যালেন্ডার মাস |
| বছর | INT | ক্যালেন্ডার বছর |
ব্যবহারের শর্তাবলী
ব্যবহারের শর্তাবলী
অনুগ্রহ করে কোপারনিকাস সি৩এস/সিএএমএস লাইসেন্স চুক্তিতে উল্লিখিত শর্তানুযায়ী ERA5-Land ব্যবহারের স্বীকৃতি প্রদান করুন:
5.1.1 Where the Licensee communicates or distributes Copernicus Products to the public, the Licensee shall inform the recipients of the source by using the following or any similar notice: 'Generated using Copernicus Climate Change Service Information [Year]'.
5.1.2 Where the Licensee makes or contributes to a publication or distribution containing adapted or modified Copernicus Products, the Licensee shall provide the following or any similar notice: 'Contains modified Copernicus Climate Change Service Information [Year]';
Any such publication or distribution covered by clauses 5.1.1 and 5.1.2 shall state that neither the European Commission nor ECMWF is responsible for any use that may be made of the Copernicus Information or Data it contains.
উদ্ধৃতি
Muñoz Sabater, J., (2019): ERA5-Land monthly averaged data from 1981 to present. Copernicus Climate Change Service (C3S) Climate Data Store (CDS). (<date of access>), doi:10.24381/cds.68d2bb30
আর্থ ইঞ্জিন দিয়ে অন্বেষণ করুন
কোড এডিটর (জাভাস্ক্রিপ্ট)
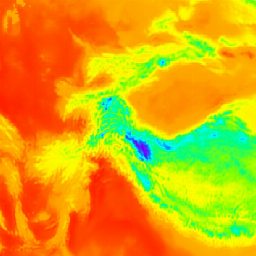
var dataset = ee.ImageCollection('ECMWF/ERA5_LAND/DAILY_AGGR').first();

var visualization = {
  bands: ['temperature_2m'],
  min: 250,
  max: 320,
  palette: [
    '000080', '0000d9', '4000ff', '8000ff', '0080ff', '00ffff',
    '00ff80', '80ff00', 'daff00', 'ffff00', 'fff500', 'ffda00',
    'ffb000', 'ffa400', 'ff4f00', 'ff2500', 'ff0a00', 'ff00ff',
  ]
};
Map.setCenter(70, 45, 3);
Map.addLayer(
    dataset, visualization, 'Air temperature (K) at 2m height', true, 0.8);
- ডেটাসেটের প্রাপ্যতা
- 1950-01-02T00:00:00Z–2026-09-04T00:00:00Z
- ডেটাসেট প্রযোজক
- Daily Aggregates: Google and Copernicus Climate Data Store
- ক্যাডেন্স
- ১ মাস
- ট্যাগ
বর্ণনা
ERA5-Land is a reanalysis dataset providing a consistent view of the evolution of land variables over several decades at an enhanced resolution compared to ERA5. ERA5-Land has been produced by replaying the land component of the ECMWF ERA5 climate reanalysis. Reanalysis combines model data with observations from across the world into a globally complete and consistent dataset using the laws of physics. Reanalysis produces data that goes several decades back in time, providing an accurate description of the climate of the past. This dataset includes all 50 variables as available on CDS.
ERA5-Land data is available from 1950 to three months from real-time.
Please consult the ERA5-Land "Known Issues" section . In particular, note that three components of the total evapotranspiration have values swapped as follows:
- variable "Evaporation from bare soil" (mars parameter code 228101 (evabs)) has the values corresponding to the "Evaporation from vegetation transpiration" (mars parameter 228103 (evavt)),
- variable "Evaporation from open water surfaces excluding oceans (mars parameter code 228102 (evaow)) has the values corresponding to the "Evaporation from bare soil" (mars parameter code 228101 (evabs)),
- variable "Evaporation from vegetation transpiration" (mars parameter code 228103 (evavt)) has the values corresponding to the "Evaporation from open water surfaces excluding oceans" (mars parameter code 228102 (evaow)).
The asset is a daily aggregate of ECMWF ERA5 Land hourly assets which includes both flow and non-flow bands. Flow bands are formed by collecting the first hour's data of the following day which holds aggregated sum of previous day and while the non-flow bands are created by averaging all hourly data of the day. The flow bands are labeled with the "_sum" identifier, which approach is different from the daily data produced by Copernicus Climate Data Store, where flow bands are averaged too.
Daily aggregates have been pre-calculated to facilitate many applications requiring easy and fast access to the data.
Precipitation and other flow (accumulated) bands might occasionally have negative values, which doesn't make physical sense. At other times their values might be excessively high.
This problem is due to how the GRIB format saves data: it simplifies or "packs" the data into smaller, less precise numbers, which can introduce errors. These errors get worse when the data varies a lot.
Because of this, when we look at the data for a whole day to compute daily totals, sometimes the highest amount of rainfall recorded at one time can seem larger than the total rainfall measured for the entire day.
To learn more, Please see: "Why are there sometimes small negative precipitation accumulations"
ব্যান্ড
ব্যান্ড
পিক্সেল সাইজ: ১১১৩২ মিটার (সকল ব্যান্ড)
| নাম | ইউনিট | পিক্সেল আকার | বর্ণনা |
|---|---|---|---|
dewpoint_temperature_2m | কে | 11132 meters | Temperature to which the air, at 2 meters above the surface of the Earth, would have to be cooled for saturation to occur. It is a measure of the humidity of the air. Combined with temperature and pressure, it can be used to calculate the relative humidity. 2m dew point temperature is calculated by interpolating between the lowest model level and the Earth's surface, taking account of the atmospheric conditions. |
temperature_2m | কে | 11132 meters | Temperature of air at 2m above the surface of land, sea or in-land waters. 2m temperature is calculated by interpolating between the lowest model level and the Earth's surface, taking account of the atmospheric conditions. |
skin_temperature | কে | 11132 meters | Temperature of the surface of the Earth. The skin temperature is the theoretical temperature that is required to satisfy the surface energy balance. It represents the temperature of the uppermost surface layer, which has no heat capacity and so can respond instantaneously to changes in surface fluxes. Skin temperature is calculated differently over land and sea. |
soil_temperature_level_1 | কে | 11132 meters | Temperature of the soil in layer 1 (0 - 7 cm) of the ECMWF Integrated Forecasting System. The surface is at 0 cm. Soil temperature is set at the middle of each layer, and heat transfer is calculated at the interfaces between them. It is assumed that there is no heat transfer out of the bottom of the lowest layer. |
soil_temperature_level_2 | কে | 11132 meters | Temperature of the soil in layer 2 (7-28 cm) of the ECMWF Integrated Forecasting System. |
soil_temperature_level_3 | কে | 11132 meters | Temperature of the soil in layer 3 (28-100 cm) of the ECMWF Integrated Forecasting System. |
soil_temperature_level_4 | কে | 11132 meters | Temperature of the soil in layer 4 (100-289 cm) of the ECMWF Integrated Forecasting System. |
lake_bottom_temperature | কে | 11132 meters | Temperature of water at the bottom of inland water bodies (lakes, reservoirs, rivers) and coastal waters. ECMWF implemented a lake model in May 2015 to represent the water temperature and lake ice of all the world's major inland water bodies in the Integrated Forecasting System. The model keeps lake depth and surface area (or fractional cover) constant in time. |
lake_ice_depth | এম | 11132 meters | The thickness of ice on inland water bodies (lakes, reservoirs and rivers) and coastal waters. The ECMWF Integrated Forecasting System (IFS) represents the formation and melting of ice on inland water bodies (lakes, reservoirs and rivers) and coastal water. A single ice layer is represented. This parameter is the thickness of that ice layer. |
lake_ice_temperature | কে | 11132 meters | The temperature of the uppermost surface of ice on inland water bodies (lakes, reservoirs, rivers) and coastal waters. The ECMWF Integrated Forecasting System represents the formation and melting of ice on lakes. A single ice layer is represented. |
lake_mix_layer_depth | এম | 11132 meters | The thickness of the upper most layer of an inland water body (lake, reservoirs, and rivers) or coastal waters that is well mixed and has a near constant temperature with depth (uniform distribution of temperature). The ECMWF Integrated Forecasting System represents inland water bodies with two layers in the vertical, the mixed layer above and the thermocline below. Thermoclines upper boundary is located at the mixed layer bottom, and the lower boundary at the lake bottom. Mixing within the mixed layer can occur when the density of the surface (and near-surface) water is greater than that of the water below. Mixing can also occur through the action of wind on the surface of the lake. |
lake_mix_layer_temperature | কে | 11132 meters | The temperature of the upper most layer of inland water bodies (lakes, reservoirs and rivers) or coastal waters) that is well mixed. The ECMWF Integrated Forecasting System represents inland water bodies with two layers in the vertical, the mixed layer above and the thermocline below. Thermoclines upper boundary is located at the mixed layer bottom, and the lower boundary at the lake bottom. Mixing within the mixed layer can occur when the density of the surface (and near-surface) water is greater than that of the water below. Mixing can also occur through the action of wind on the surface of the lake. |
lake_shape_factor | 11132 meters | This parameter describes the way that temperature changes with depth in the thermocline layer of inland water bodies (lakes, reservoirs and rivers) and coastal waters. It is used to calculate the lake bottom temperature and other lake-related parameters. The ECMWF Integrated Forecasting System represents inland and coastal water bodies with two layers in the vertical, the mixed layer above and the thermocline below where temperature changes with depth. | |
lake_total_layer_temperature | কে | 11132 meters | The mean temperature of total water column in inland water bodies (lakes, reservoirs and rivers) and coastal waters. The ECMWF Integrated Forecasting System represents inland water bodies with two layers in the vertical, the mixed layer above and the thermocline below where temperature changes with depth. This parameter is the mean over the two layers. |
snow_albedo | 11132 meters | It is defined as the fraction of solar (shortwave) radiation reflected by the snow, across the solar spectrum, for both direct and diffuse radiation. It is a measure of the reflectivity of the snow covered grid cells. Values vary between 0 and 1. Typically, snow and ice have high reflectivity with albedo values of 0.8 and above. | |
snow_cover | 11132 meters | It represents the fraction (0-1) of the cell / grid-box occupied by snow (similar to the cloud cover fields of ERA5). | |
snow_density | kg/m^3 | 11132 meters | Mass of snow per cubic meter in the snow layer. The ECMWF Integrated Forecast System (IFS) model represents snow as a single additional layer over the uppermost soil level. The snow may cover all or part of the grid box. |
snow_depth | এম | 11132 meters | Instantaneous grid-box average of the snow thickness on the ground (excluding snow on canopy). |
snow_depth_water_equivalent | m of water equivalent | 11132 meters | Depth of snow from the snow-covered area of a grid box. Its units are meters of water equivalent, so it is the depth the water would have if the snow melted and was spread evenly over the whole grid box. The ECMWF Integrated Forecast System represents snow as a single additional layer over the uppermost soil level. The snow may cover all or part of the grid box. |
snowfall_sum | m of water equivalent | 11132 meters | Accumulated total snow that has fallen to the Earth's surface. It consists of snow due to the large-scale atmospheric flow (horizontal scales greater than around a few hundred meters) and convection where smaller scale areas (around 5km to a few hundred kilometers) of warm air rise. If snow has melted during the period over which this variable was accumulated, then it will be higher than the snow depth. This variable is the total amount of water accumulated from the beginning of the forecast time to the end of the forecast step. The units given measure the depth the water would have if the snow melted and was spread evenly over the grid box. Care should be taken when comparing model variables with observations, because observations are often local to a particular point in space and time, rather than representing averages over a model grid box and model time step. |
snowmelt_sum | m of water equivalent | 11132 meters | Melting of snow averaged over the grid box (to find melt over snow, divide by snow fraction). This variable is accumulated from the beginning of the forecast time to the end of the forecast step. |
temperature_of_snow_layer | কে | 11132 meters | This variable gives the temperature of the snow layer from the ground to the snow-air interface. The ECMWF Integrated Forecast System (IFS) model represents snow as a single additional layer over the uppermost soil level. The snow may cover all or part of the grid box. |
skin_reservoir_content | m of water equivalent | 11132 meters | Amount of water in the vegetation canopy and/or in a thin layer on the soil. It represents the amount of rain intercepted by foliage, and water from dew. The maximum amount of 'skin reservoir content' a grid box can hold depends on the type of vegetation, and may be zero. Water leaves the 'skin reservoir' by evaporation. |
volumetric_soil_water_layer_1 | Volume fraction | 11132 meters | Volume of water in soil layer 1 (0 - 7 cm) of the ECMWF Integrated Forecasting System. The surface is at 0 cm. The volumetric soil water is associated with the soil texture (or classification), soil depth, and the underlying groundwater level. |
volumetric_soil_water_layer_2 | Volume fraction | 11132 meters | Volume of water in soil layer 2 (7 -28 cm) of the ECMWF Integrated Forecasting System. |
volumetric_soil_water_layer_3 | Volume fraction | 11132 meters | Volume of water in soil layer 3 (28-100 cm) of the ECMWF Integrated Forecasting System. |
volumetric_soil_water_layer_4 | Volume fraction | 11132 meters | Volume of water in soil layer 4 (100-289 cm) of the ECMWF Integrated Forecasting System. |
forecast_albedo | 11132 meters | Is a measure of the reflectivity of the Earth's surface. It is the fraction of solar (shortwave) radiation reflected by Earth's surface, across the solar spectrum, for both direct and diffuse radiation. Values are between 0 and 1. Typically, snow and ice have high reflectivity with albedo values of 0.8 and above, land has intermediate values between about 0.1 and 0.4 and the ocean has low values of 0.1 or less. Radiation from the Sun (solar, or shortwave, radiation) is partly reflected back to space by clouds and particles in the atmosphere (aerosols) and some of it is absorbed. The rest is incident on the Earth's surface, where some of it is reflected. The portion that is reflected by the Earth's surface depends on the albedo. In the ECMWF Integrated Forecasting System (IFS), a climatological background albedo (observed values averaged over a period of several years) is used, modified by the model over water, ice and snow. Albedo is often shown as a percentage (%). | |
surface_latent_heat_flux_sum | J/m^2 | 11132 meters | Exchange of latent heat with the surface through turbulent diffusion. This variables is accumulated from the beginning of the forecast time to the end of the forecast step. By model convention, downward fluxes are positive. |
surface_net_solar_radiation_sum | J/m^2 | 11132 meters | Amount of solar radiation (also known as shortwave radiation) reaching the surface of the Earth (both direct and diffuse) minus the amount reflected by the Earth's surface (which is governed by the albedo). Radiation from the Sun (solar, or shortwave, radiation) is partly reflected back to space by clouds and particles in the atmosphere (aerosols) and some of it is absorbed. The rest is incident on the Earth's surface, where some of it is reflected. The difference between downward and reflected solar radiation is the surface net solar radiation. This variable is accumulated from the beginning of the forecast time to the end of the forecast step. The units are joules per square meter (J m-2). To convert to watts per square meter (W m-2), the accumulated values should be divided by the accumulation period expressed in seconds. The ECMWF convention for vertical fluxes is positive downwards. |
surface_net_thermal_radiation_sum | J/m^2 | 11132 meters | Net thermal radiation at the surface. Accumulated field from the beginning of the forecast time to the end of the forecast step. By model convention downward fluxes are positive. |
surface_sensible_heat_flux_sum | J/m^2 | 11132 meters | Transfer of heat between the Earth's surface and the atmosphere through the effects of turbulent air motion (but excluding any heat transfer resulting from condensation or evaporation). The magnitude of the sensible heat flux is governed by the difference in temperature between the surface and the overlying atmosphere, wind speed and the surface roughness. For example, cold air overlying a warm surface would produce a sensible heat flux from the land (or ocean) into the atmosphere. This is a single level variable and it is accumulated from the beginning of the forecast time to the end of the forecast step. The units are joules per square meter (J m-2). To convert to watts per square meter (W m-2), the accumulated values should be divided by the accumulation period expressed in seconds. The ECMWF convention for vertical fluxes is positive downwards. |
surface_solar_radiation_downwards_sum | J/m^2 | 11132 meters | Amount of solar radiation (also known as shortwave radiation) reaching the surface of the Earth. This variable comprises both direct and diffuse solar radiation. Radiation from the Sun (solar, or shortwave, radiation) is partly reflected back to space by clouds and particles in the atmosphere (aerosols) and some of it is absorbed. The rest is incident on the Earth's surface (represented by this variable). To a reasonably good approximation, this variable is the model equivalent of what would be measured by a pyranometer (an instrument used for measuring solar radiation) at the surface. However, care should be taken when comparing model variables with observations, because observations are often local to a particular point in space and time, rather than representing averages over a model grid box and model time step. This variable is accumulated from the beginning of the forecast time to the end of the forecast step. The units are joules per square meter (J m-2). To convert to watts per square meter (W m-2), the accumulated values should be divided by the accumulation period expressed in seconds. The ECMWF convention for vertical fluxes is positive downwards. |
surface_thermal_radiation_downwards_sum | J/m^2 | 11132 meters | Amount of thermal (also known as longwave or terrestrial) radiation emitted by the atmosphere and clouds that reaches the Earth's surface. The surface of the Earth emits thermal radiation, some of which is absorbed by the atmosphere and clouds. The atmosphere and clouds likewise emit thermal radiation in all directions, some of which reaches the surface (represented by this variable). This variable is accumulated from the beginning of the forecast time to the end of the forecast step. The units are joules per square meter (J m-2). To convert to watts per square meter (W m-2), the accumulated values should be divided by the accumulation period expressed in seconds. The ECMWF convention for vertical fluxes is positive downwards. |
evaporation_from_bare_soil_sum | m of water equivalent | 11132 meters | The amount of evaporation from bare soil at the top of the land surface. This variable is accumulated from the beginning of the forecast time to the end of the forecast step. |
evaporation_from_open_water_surfaces_excluding_oceans_sum | m of water equivalent | 11132 meters | Amount of evaporation from surface water storage like lakes and inundated areas but excluding oceans. This variable is accumulated from the beginning of the forecast time to the end of the forecast step. |
evaporation_from_the_top_of_canopy_sum | m of water equivalent | 11132 meters | The amount of evaporation from the canopy interception reservoir at the top of the canopy. This variable is accumulated from the beginning of the forecast time to the end of the forecast step. |
evaporation_from_vegetation_transpiration_sum | m of water equivalent | 11132 meters | Amount of evaporation from vegetation transpiration. This has the same meaning as root extraction ie the amount of water extracted from the different soil layers. This variable is accumulated from the beginning of the forecast time to the end of the forecast step. |
potential_evaporation_sum | এম | 11132 meters | Potential evaporation (pev) in the current ECMWF model is computed, by making a second call to the surface energy balance routine with the vegetation variables set to "crops/mixed farming" and assuming no stress from soil moisture. In other words, evaporation is computed for agricultural land as if it is well watered and assuming that the atmosphere is not affected by this artificial surface condition. The latter may not always be realistic. Although pev is meant to provide an estimate of irrigation requirements, the method can give unrealistic results in arid conditions due to too strong evaporation forced by dry air. This variable is accumulated from the beginning of the forecast time to the end of the forecast step. |
runoff_sum | এম | 11132 meters | Some water from rainfall, melting snow, or deep in the soil, stays stored in the soil. Otherwise, the water drains away, either over the surface (surface runoff), or under the ground (sub-surface runoff) and the sum of these two is simply called 'runoff'. This variable is the total amount of water accumulated from the beginning of the forecast time to the end of the forecast step. The units of runoff are depth in meters. This is the depth the water would have if it were spread evenly over the grid box. Care should be taken when comparing model variables with observations, because observations are often local to a particular point rather than averaged over a grid square area. Observations are also often taken in different units, such as mm/day, rather than the accumulated meters produced here. Runoff is a measure of the availability of water in the soil, and can, for example, be used as an indicator of drought or flood. More information about how runoff is calculated is given in the IFS Physical Processes documentation. |
snow_evaporation_sum | m of water equivalent | 11132 meters | Evaporation from snow averaged over the grid box (to find flux over snow, divide by snow fraction). This variable is accumulated from the beginning of the forecast time to the end of the forecast step. |
sub_surface_runoff_sum | এম | 11132 meters | Some water from rainfall, melting snow, or deep in the soil, stays stored in the soil. Otherwise, the water drains away, either over the surface (surface runoff), or under the ground(sub-surface runoff) and the sum of these two is simply called 'runoff'. This variable is accumulated from the beginning of the forecast time to the end of the forecast step. The units of runoff are depth in meters. This is the depth the water would have if it were spread evenly over the grid box. Care should be taken when comparing model variables with observations, because observations are often local to a particular point rather than averaged over a grid square area. Observations are also often taken in different units, such as mm/day, rather than the accumulated meters produced here. Runoff is a measure of the availability of water in the soil, and can, for example, be used as an indicator of drought or flood. More information about how runoff is calculated is given in the IFS Physical Processes documentation. |
surface_runoff_sum | এম | 11132 meters | Some water from rainfall, melting snow, or deep in the soil, stays stored in the soil. Otherwise, the water drains away, either over the surface (surface runoff), or under the ground (sub-surface runoff) and the sum of these two is simply called 'runoff'. This variable is the total amount of water accumulated from the beginning of the forecast time to the end of the forecast step. The units of runoff are depth in meters. This is the depth the water would have if it were spread evenly over the grid box. Care should be taken when comparing model variables with observations, because observations are often local to a particular point rather than averaged over a grid square area. Observations are also often taken in different units, such as mm/day, rather than the accumulated meters produced here. Runoff is a measure of the availability of water in the soil, and can, for example, be used as an indicator of drought or flood. More information about how runoff is calculated is given in the IFS Physical Processes documentation. |
total_evaporation_sum | m of water equivalent | 11132 meters | Accumulated amount of water that has evaporated from the Earth's surface, including a simplified representation of transpiration (from vegetation), into vapor in the air above. This variable is accumulated from the beginning of the forecast to the end of the forecast step. The ECMWF Integrated Forecasting System convention is that downward fluxes are positive. Therefore, negative values indicate evaporation and positive values indicate condensation. |
u_component_of_wind_10m | মি/সে | 11132 meters | Eastward component of the 10m wind. It is the horizontal speed of air moving towards the east, at a height of ten meters above the surface of the Earth, in meters per second. Care should be taken when comparing this variable with observations, because wind observations vary on small space and time scales and are affected by the local terrain, vegetation and buildings that are represented only on average in the ECMWF Integrated Forecasting System. This variable can be combined with the V component of 10m wind to give the speed and direction of the horizontal 10m wind. |
v_component_of_wind_10m | মি/সে | 11132 meters | Northward component of the 10m wind. It is the horizontal speed of air moving towards the north, at a height of ten meters above the surface of the Earth, in meters per second. Care should be taken when comparing this variable with observations, because wind observations vary on small space and time scales and are affected by the local terrain, vegetation and buildings that are represented only on average in the ECMWF Integrated Forecasting System. This variable can be combined with the U component of 10m wind to give the speed and direction of the horizontal 10m wind. |
surface_pressure | পা | 11132 meters | Pressure (force per unit area) of the atmosphere on the surface of land, sea and in-land water. It is a measure of the weight of all the air in a column vertically above the area of the Earth's surface represented at a fixed point. Surface pressure is often used in combination with temperature to calculate air density. The strong variation of pressure with altitude makes it difficult to see the low and high pressure systems over mountainous areas, so mean sea level pressure, rather than surface pressure, is normally used for this purpose. The units of this variable are Pascals (Pa). Surface pressure is often measured in hPa and sometimes is presented in the old units of millibars, mb (1 hPa = 1 mb = 100 Pa). |
total_precipitation_sum | এম | 11132 meters | Accumulated liquid and frozen water, including rain and snow, that falls to the Earth's surface. It is the sum of large-scale precipitation (that precipitation which is generated by large-scale weather patterns, such as troughs and cold fronts) and convective precipitation (generated by convection which occurs when air at lower levels in the atmosphere is warmer and less dense than the air above, so it rises). Precipitation variables do not include fog, dew or the precipitation that evaporates in the atmosphere before it lands at the surface of the Earth. This variable is accumulated from the beginning of the forecast time to the end of the forecast step. The units of precipitation are depth in meters. It is the depth the water would have if it were spread evenly over the grid box. Care should be taken when comparing model variables with observations, because observations are often local to a particular point in space and time, rather than representing averages over a model grid box and model time step. |
leaf_area_index_high_vegetation | Area fraction | 11132 meters | One-half of the total green leaf area per unit horizontal ground surface area for high vegetation type. |
leaf_area_index_low_vegetation | Area fraction | 11132 meters | One-half of the total green leaf area per unit horizontal ground surface area for low vegetation type. |
dewpoint_temperature_2m_min | কে | 11132 meters | daily minimum dewpoint_temperature_2m value |
dewpoint_temperature_2m_max | কে | 11132 meters | daily maximum dewpoint_temperature_2m value |
temperature_2m_min | কে | 11132 meters | daily minimum temperature_2m value |
temperature_2m_max | কে | 11132 meters | daily maximum temperature_2m value |
skin_temperature_min | কে | 11132 meters | daily minimum skin_temperature value |
skin_temperature_max | কে | 11132 meters | daily maximum skin_temperature value |
soil_temperature_level_1_min | কে | 11132 meters | daily minimum soil_temperature_level_1 value |
soil_temperature_level_1_max | কে | 11132 meters | daily maximum soil_temperature_level_1 value |
soil_temperature_level_2_min | কে | 11132 meters | daily minimum soil_temperature_level_2 value |
soil_temperature_level_2_max | কে | 11132 meters | daily maximum soil_temperature_level_2 value |
soil_temperature_level_3_min | কে | 11132 meters | daily minimum soil_temperature_level_3 value |
soil_temperature_level_3_max | কে | 11132 meters | daily maximum soil_temperature_level_3 value |
soil_temperature_level_4_min | কে | 11132 meters | daily minimum soil_temperature_level_4 value |
soil_temperature_level_4_max | কে | 11132 meters | daily maximum soil_temperature_level_4 value |
lake_bottom_temperature_min | কে | 11132 meters | daily minimum lake_bottom_temperature value |
lake_bottom_temperature_max | কে | 11132 meters | daily maximum lake_bottom_temperature value |
lake_ice_depth_min | এম | 11132 meters | daily minimum lake_ice_depth value |
lake_ice_depth_max | এম | 11132 meters | daily maximum lake_ice_depth value |
lake_ice_temperature_min | কে | 11132 meters | daily minimum lake_ice_temperature value |
lake_ice_temperature_max | কে | 11132 meters | daily maximum lake_ice_temperature value |
lake_mix_layer_depth_min | এম | 11132 meters | daily minimum lake_mix_layer_depth value |
lake_mix_layer_depth_max | এম | 11132 meters | daily maximum lake_mix_layer_depth value |
lake_mix_layer_temperature_min | কে | 11132 meters | daily minimum lake_mix_layer_temperature value |
lake_mix_layer_temperature_max | কে | 11132 meters | daily maximum lake_mix_layer_temperature value |
lake_shape_factor_min | 11132 meters | daily minimum lake_shape_factor value | |
lake_shape_factor_max | 11132 meters | daily maximum lake_shape_factor value | |
lake_total_layer_temperature_min | কে | 11132 meters | daily minimum lake_total_layer_temperature value |
lake_total_layer_temperature_max | কে | 11132 meters | daily maximum lake_total_layer_temperature value |
snow_albedo_min | 11132 meters | daily minimum snow_albedo value | |
snow_albedo_max | 11132 meters | daily maximum snow_albedo value | |
snow_cover_min | 11132 meters | daily minimum snow_cover value | |
snow_cover_max | 11132 meters | daily maximum snow_cover value | |
snow_density_min | kg/m^3 | 11132 meters | daily minimum snow_density value |
snow_density_max | kg/m^3 | 11132 meters | daily maximum snow_density value |
snow_depth_min | এম | 11132 meters | daily minimum snow_depth value |
snow_depth_max | এম | 11132 meters | daily maximum snow_depth value |
snow_depth_water_equivalent_min | m of water equivalent | 11132 meters | daily minimum snow_depth_water_equivalent value |
snow_depth_water_equivalent_max | m of water equivalent | 11132 meters | daily maximum snow_depth_water_equivalent value |
snowfall_min | m of water equivalent | 11132 meters | daily minimum snowfall value |
snowfall_max | m of water equivalent | 11132 meters | daily maximum snowfall value |
snowmelt_min | m of water equivalent | 11132 meters | daily minimum snowmelt value |
snowmelt_max | m of water equivalent | 11132 meters | daily maximum snowmelt value |
temperature_of_snow_layer_min | কে | 11132 meters | daily minimum temperature_of_snow_layer value |
temperature_of_snow_layer_max | কে | 11132 meters | daily maximum temperature_of_snow_layer value |
skin_reservoir_content_min | m of water equivalent | 11132 meters | daily minimum skin_reservoir_content value |
skin_reservoir_content_max | m of water equivalent | 11132 meters | daily maximum skin_reservoir_content value |
volumetric_soil_water_layer_1_min | Volume fraction | 11132 meters | daily minimum volumetric_soil_water_layer_1 value |
volumetric_soil_water_layer_1_max | Volume fraction | 11132 meters | daily maximum volumetric_soil_water_layer_1 value |
volumetric_soil_water_layer_2_min | Volume fraction | 11132 meters | daily minimum volumetric_soil_water_layer_2 value |
volumetric_soil_water_layer_2_max | Volume fraction | 11132 meters | daily maximum volumetric_soil_water_layer_2 value |
volumetric_soil_water_layer_3_min | Volume fraction | 11132 meters | daily minimum volumetric_soil_water_layer_3 value |
volumetric_soil_water_layer_3_max | Volume fraction | 11132 meters | daily maximum volumetric_soil_water_layer_3 value |
volumetric_soil_water_layer_4_min | Volume fraction | 11132 meters | daily minimum volumetric_soil_water_layer_4 value |
volumetric_soil_water_layer_4_max | Volume fraction | 11132 meters | daily maximum volumetric_soil_water_layer_4 value |
forecast_albedo_min | 11132 meters | daily minimum forecast_albedo value | |
forecast_albedo_max | 11132 meters | daily maximum forecast_albedo value | |
surface_latent_heat_flux_min | J/m^2 | 11132 meters | daily minimum surface_latent_heat_flux value |
surface_latent_heat_flux_max | J/m^2 | 11132 meters | daily maximum surface_latent_heat_flux value |
surface_net_solar_radiation_min | J/m^2 | 11132 meters | daily minimum surface_net_solar_radiation value |
surface_net_solar_radiation_max | J/m^2 | 11132 meters | daily maximum surface_net_solar_radiation value |
surface_net_thermal_radiation_min | J/m^2 | 11132 meters | daily minimum surface_net_thermal_radiation value |
surface_net_thermal_radiation_max | J/m^2 | 11132 meters | daily maximum surface_net_thermal_radiation value |
surface_sensible_heat_flux_min | J/m^2 | 11132 meters | daily minimum surface_sensible_heat_flux value |
surface_sensible_heat_flux_max | J/m^2 | 11132 meters | daily maximum surface_sensible_heat_flux value |
surface_solar_radiation_downwards_min | J/m^2 | 11132 meters | daily minimum surface_solar_radiation_downwards value |
surface_solar_radiation_downwards_max | J/m^2 | 11132 meters | daily maximum surface_solar_radiation_downwards value |
surface_thermal_radiation_downwards_min | J/m^2 | 11132 meters | daily minimum surface_thermal_radiation_downwards value |
surface_thermal_radiation_downwards_max | J/m^2 | 11132 meters | daily maximum surface_thermal_radiation_downwards value |
evaporation_from_bare_soil_min | m of water equivalent | 11132 meters | daily minimum evaporation_from_bare_soil value |
evaporation_from_bare_soil_max | m of water equivalent | 11132 meters | daily maximum evaporation_from_bare_soil value |
evaporation_from_open_water_surfaces_excluding_oceans_min | m of water equivalent | 11132 meters | daily minimum evaporation_from_open_water_surfaces_excluding_oceans value |
evaporation_from_open_water_surfaces_excluding_oceans_max | m of water equivalent | 11132 meters | daily maximum evaporation_from_open_water_surfaces_excluding_oceans value |
evaporation_from_the_top_of_canopy_min | m of water equivalent | 11132 meters | daily minimum evaporation_from_the_top_of_canopy value |
evaporation_from_the_top_of_canopy_max | m of water equivalent | 11132 meters | daily maximum evaporation_from_the_top_of_canopy value |
evaporation_from_vegetation_transpiration_min | m of water equivalent | 11132 meters | daily minimum evaporation_from_vegetation_transpiration value |
evaporation_from_vegetation_transpiration_max | m of water equivalent | 11132 meters | daily maximum evaporation_from_vegetation_transpiration value |
potential_evaporation_min | এম | 11132 meters | daily minimum potential_evaporation value |
potential_evaporation_max | এম | 11132 meters | daily maximum potential_evaporation value |
runoff_min | এম | 11132 meters | daily minimum runoff value |
runoff_max | এম | 11132 meters | daily maximum runoff value |
snow_evaporation_min | m of water equivalent | 11132 meters | daily minimum snow_evaporation value |
snow_evaporation_max | m of water equivalent | 11132 meters | daily maximum snow_evaporation value |
sub_surface_runoff_min | এম | 11132 meters | daily minimum sub_surface_runoff value |
sub_surface_runoff_max | এম | 11132 meters | daily maximum sub_surface_runoff value |
surface_runoff_min | এম | 11132 meters | daily minimum surface_runoff value |
surface_runoff_max | এম | 11132 meters | daily maximum surface_runoff value |
total_evaporation_min | m of water equivalent | 11132 meters | daily minimum total_evaporation value |
total_evaporation_max | m of water equivalent | 11132 meters | daily maximum total_evaporation value |
u_component_of_wind_10m_min | মি/সে | 11132 meters | daily minimum u_component_of_wind_10m value |
u_component_of_wind_10m_max | মি/সে | 11132 meters | daily maximum u_component_of_wind_10m value |
v_component_of_wind_10m_min | মি/সে | 11132 meters | daily minimum v_component_of_wind_10m value |
v_component_of_wind_10m_max | মি/সে | 11132 meters | daily maximum v_component_of_wind_10m value |
surface_pressure_min | পা | 11132 meters | daily minimum surface_pressure value |
surface_pressure_max | পা | 11132 meters | daily maximum surface_pressure value |
total_precipitation_min | এম | 11132 meters | daily minimum total_precipitation value |
total_precipitation_max | এম | 11132 meters | daily maximum total_precipitation value |
leaf_area_index_high_vegetation_min | Area fraction | 11132 meters | daily minimum leaf_area_index_high_vegetation value |
leaf_area_index_high_vegetation_max | Area fraction | 11132 meters | daily maximum leaf_area_index_high_vegetation value |
leaf_area_index_low_vegetation_min | Area fraction | 11132 meters | daily minimum leaf_area_index_low_vegetation value |
leaf_area_index_low_vegetation_max | Area fraction | 11132 meters | daily maximum leaf_area_index_low_vegetation value |
ছবির বৈশিষ্ট্য
ছবির বৈশিষ্ট্য
| নাম | প্রকার | বর্ণনা |
|---|---|---|
| দিন | INT | Calendar day |
| মাস | INT | Calendar month |
| বছর | INT | Calendar year |
ব্যবহারের শর্তাবলী
ব্যবহারের শর্তাবলী
Please acknowledge the use of ERA5-Land as stated in the Copernicus C3S/CAMS License agreement :
5.1.1 Where the Licensee communicates or distributes Copernicus Products to the public, the Licensee shall inform the recipients of the source by using the following or any similar notice: 'Generated using Copernicus Climate Change Service Information [Year]'.
5.1.2 Where the Licensee makes or contributes to a publication or distribution containing adapted or modified Copernicus Products, the Licensee shall provide the following or any similar notice: 'Contains modified Copernicus Climate Change Service Information [Year]';
Any such publication or distribution covered by clauses 5.1.1 and 5.1.2 shall state that neither the European Commission nor ECMWF is responsible for any use that may be made of the Copernicus Information or Data it contains.
উদ্ধৃতি
Muñoz Sabater, J., (2019): ERA5-Land monthly averaged data from 1981 to present. Copernicus Climate Change Service (C3S) Climate Data Store (CDS). (<date of access>), doi:10.24381/cds.68d2bb30
আর্থ ইঞ্জিন দিয়ে অন্বেষণ করুন
কোড এডিটর (জাভাস্ক্রিপ্ট)
var dataset = ee.ImageCollection('ECMWF/ERA5_LAND/DAILY_AGGR').first();

var visualization = {
  bands: ['temperature_2m'],
  min: 250,
  max: 320,
  palette: [
    '000080', '0000d9', '4000ff', '8000ff', '0080ff', '00ffff',
    '00ff80', '80ff00', 'daff00', 'ffff00', 'fff500', 'ffda00',
    'ffb000', 'ffa400', 'ff4f00', 'ff2500', 'ff0a00', 'ff00ff',
  ]
};
Map.setCenter(70, 45, 3);
Map.addLayer(
    dataset, visualization, 'Air temperature (K) at 2m height', true, 0.8);
- ডেটাসেটের প্রাপ্যতা
- 1950-01-02T00:00:00Z–2026-09-04T00:00:00Z
- ডেটাসেট প্রযোজক
- Daily Aggregates: Google and Copernicus Climate Data Store
- ক্যাডেন্স
- ১ মাস
- ট্যাগ
বর্ণনা
ERA5-Land is a reanalysis dataset providing a consistent view of the evolution of land variables over several decades at an enhanced resolution compared to ERA5. ERA5-Land has been produced by replaying the land component of the ECMWF ERA5 climate reanalysis. Reanalysis combines model data with observations from across the world into a globally complete and consistent dataset using the laws of physics. Reanalysis produces data that goes several decades back in time, providing an accurate description of the climate of the past. This dataset includes all 50 variables as available on CDS.
ERA5-Land data is available from 1950 to three months from real-time.
Please consult the ERA5-Land "Known Issues" section . In particular, note that three components of the total evapotranspiration have values swapped as follows:
- variable "Evaporation from bare soil" (mars parameter code 228101 (evabs)) has the values corresponding to the "Evaporation from vegetation transpiration" (mars parameter 228103 (evavt)),
- variable "Evaporation from open water surfaces excluding oceans (mars parameter code 228102 (evaow)) has the values corresponding to the "Evaporation from bare soil" (mars parameter code 228101 (evabs)),
- variable "Evaporation from vegetation transpiration" (mars parameter code 228103 (evavt)) has the values corresponding to the "Evaporation from open water surfaces excluding oceans" (mars parameter code 228102 (evaow)).
The asset is a daily aggregate of ECMWF ERA5 Land hourly assets which includes both flow and non-flow bands. Flow bands are formed by collecting the first hour's data of the following day which holds aggregated sum of previous day and while the non-flow bands are created by averaging all hourly data of the day. The flow bands are labeled with the "_sum" identifier, which approach is different from the daily data produced by Copernicus Climate Data Store, where flow bands are averaged too.
Daily aggregates have been pre-calculated to facilitate many applications requiring easy and fast access to the data.
Precipitation and other flow (accumulated) bands might occasionally have negative values, which doesn't make physical sense. At other times their values might be excessively high.
This problem is due to how the GRIB format saves data: it simplifies or "packs" the data into smaller, less precise numbers, which can introduce errors. These errors get worse when the data varies a lot.
Because of this, when we look at the data for a whole day to compute daily totals, sometimes the highest amount of rainfall recorded at one time can seem larger than the total rainfall measured for the entire day.
To learn more, Please see: "Why are there sometimes small negative precipitation accumulations"
ব্যান্ড
ব্যান্ড
পিক্সেল সাইজ: ১১১৩২ মিটার (সকল ব্যান্ড)
| নাম | ইউনিট | পিক্সেল আকার | বর্ণনা |
|---|---|---|---|
dewpoint_temperature_2m | কে | 11132 meters | Temperature to which the air, at 2 meters above the surface of the Earth, would have to be cooled for saturation to occur. It is a measure of the humidity of the air. Combined with temperature and pressure, it can be used to calculate the relative humidity. 2m dew point temperature is calculated by interpolating between the lowest model level and the Earth's surface, taking account of the atmospheric conditions. |
temperature_2m | কে | 11132 meters | Temperature of air at 2m above the surface of land, sea or in-land waters. 2m temperature is calculated by interpolating between the lowest model level and the Earth's surface, taking account of the atmospheric conditions. |
skin_temperature | কে | 11132 meters | Temperature of the surface of the Earth. The skin temperature is the theoretical temperature that is required to satisfy the surface energy balance. It represents the temperature of the uppermost surface layer, which has no heat capacity and so can respond instantaneously to changes in surface fluxes. Skin temperature is calculated differently over land and sea. |
soil_temperature_level_1 | কে | 11132 meters | Temperature of the soil in layer 1 (0 - 7 cm) of the ECMWF Integrated Forecasting System. The surface is at 0 cm. Soil temperature is set at the middle of each layer, and heat transfer is calculated at the interfaces between them. It is assumed that there is no heat transfer out of the bottom of the lowest layer. |
soil_temperature_level_2 | কে | 11132 meters | Temperature of the soil in layer 2 (7-28 cm) of the ECMWF Integrated Forecasting System. |
soil_temperature_level_3 | কে | 11132 meters | Temperature of the soil in layer 3 (28-100 cm) of the ECMWF Integrated Forecasting System. |
soil_temperature_level_4 | কে | 11132 meters | Temperature of the soil in layer 4 (100-289 cm) of the ECMWF Integrated Forecasting System. |
lake_bottom_temperature | কে | 11132 meters | Temperature of water at the bottom of inland water bodies (lakes, reservoirs, rivers) and coastal waters. ECMWF implemented a lake model in May 2015 to represent the water temperature and lake ice of all the world's major inland water bodies in the Integrated Forecasting System. The model keeps lake depth and surface area (or fractional cover) constant in time. |
lake_ice_depth | এম | 11132 meters | The thickness of ice on inland water bodies (lakes, reservoirs and rivers) and coastal waters. The ECMWF Integrated Forecasting System (IFS) represents the formation and melting of ice on inland water bodies (lakes, reservoirs and rivers) and coastal water. A single ice layer is represented. This parameter is the thickness of that ice layer. |
lake_ice_temperature | কে | 11132 meters | The temperature of the uppermost surface of ice on inland water bodies (lakes, reservoirs, rivers) and coastal waters. The ECMWF Integrated Forecasting System represents the formation and melting of ice on lakes. A single ice layer is represented. |
lake_mix_layer_depth | এম | 11132 meters | The thickness of the upper most layer of an inland water body (lake, reservoirs, and rivers) or coastal waters that is well mixed and has a near constant temperature with depth (uniform distribution of temperature). The ECMWF Integrated Forecasting System represents inland water bodies with two layers in the vertical, the mixed layer above and the thermocline below. Thermoclines upper boundary is located at the mixed layer bottom, and the lower boundary at the lake bottom. Mixing within the mixed layer can occur when the density of the surface (and near-surface) water is greater than that of the water below. Mixing can also occur through the action of wind on the surface of the lake. |
lake_mix_layer_temperature | কে | 11132 meters | The temperature of the upper most layer of inland water bodies (lakes, reservoirs and rivers) or coastal waters) that is well mixed. The ECMWF Integrated Forecasting System represents inland water bodies with two layers in the vertical, the mixed layer above and the thermocline below. Thermoclines upper boundary is located at the mixed layer bottom, and the lower boundary at the lake bottom. Mixing within the mixed layer can occur when the density of the surface (and near-surface) water is greater than that of the water below. Mixing can also occur through the action of wind on the surface of the lake. |
lake_shape_factor | 11132 meters | This parameter describes the way that temperature changes with depth in the thermocline layer of inland water bodies (lakes, reservoirs and rivers) and coastal waters. It is used to calculate the lake bottom temperature and other lake-related parameters. The ECMWF Integrated Forecasting System represents inland and coastal water bodies with two layers in the vertical, the mixed layer above and the thermocline below where temperature changes with depth. | |
lake_total_layer_temperature | কে | 11132 meters | The mean temperature of total water column in inland water bodies (lakes, reservoirs and rivers) and coastal waters. The ECMWF Integrated Forecasting System represents inland water bodies with two layers in the vertical, the mixed layer above and the thermocline below where temperature changes with depth. This parameter is the mean over the two layers. |
snow_albedo | 11132 meters | It is defined as the fraction of solar (shortwave) radiation reflected by the snow, across the solar spectrum, for both direct and diffuse radiation. It is a measure of the reflectivity of the snow covered grid cells. Values vary between 0 and 1. Typically, snow and ice have high reflectivity with albedo values of 0.8 and above. | |
snow_cover | 11132 meters | It represents the fraction (0-1) of the cell / grid-box occupied by snow (similar to the cloud cover fields of ERA5). | |
snow_density | kg/m^3 | 11132 meters | Mass of snow per cubic meter in the snow layer. The ECMWF Integrated Forecast System (IFS) model represents snow as a single additional layer over the uppermost soil level. The snow may cover all or part of the grid box. |
snow_depth | এম | 11132 meters | Instantaneous grid-box average of the snow thickness on the ground (excluding snow on canopy). |
snow_depth_water_equivalent | m of water equivalent | 11132 meters | Depth of snow from the snow-covered area of a grid box. Its units are meters of water equivalent, so it is the depth the water would have if the snow melted and was spread evenly over the whole grid box. The ECMWF Integrated Forecast System represents snow as a single additional layer over the uppermost soil level. The snow may cover all or part of the grid box. |
snowfall_sum | m of water equivalent | 11132 meters | Accumulated total snow that has fallen to the Earth's surface. It consists of snow due to the large-scale atmospheric flow (horizontal scales greater than around a few hundred meters) and convection where smaller scale areas (around 5km to a few hundred kilometers) of warm air rise. If snow has melted during the period over which this variable was accumulated, then it will be higher than the snow depth. This variable is the total amount of water accumulated from the beginning of the forecast time to the end of the forecast step. The units given measure the depth the water would have if the snow melted and was spread evenly over the grid box. Care should be taken when comparing model variables with observations, because observations are often local to a particular point in space and time, rather than representing averages over a model grid box and model time step. |
snowmelt_sum | m of water equivalent | 11132 meters | Melting of snow averaged over the grid box (to find melt over snow, divide by snow fraction). This variable is accumulated from the beginning of the forecast time to the end of the forecast step. |
temperature_of_snow_layer | কে | 11132 meters | This variable gives the temperature of the snow layer from the ground to the snow-air interface. The ECMWF Integrated Forecast System (IFS) model represents snow as a single additional layer over the uppermost soil level. The snow may cover all or part of the grid box. |
skin_reservoir_content | m of water equivalent | 11132 meters | Amount of water in the vegetation canopy and/or in a thin layer on the soil. It represents the amount of rain intercepted by foliage, and water from dew. The maximum amount of 'skin reservoir content' a grid box can hold depends on the type of vegetation, and may be zero. Water leaves the 'skin reservoir' by evaporation. |
volumetric_soil_water_layer_1 | Volume fraction | 11132 meters | Volume of water in soil layer 1 (0 - 7 cm) of the ECMWF Integrated Forecasting System. The surface is at 0 cm. The volumetric soil water is associated with the soil texture (or classification), soil depth, and the underlying groundwater level. |
volumetric_soil_water_layer_2 | Volume fraction | 11132 meters | Volume of water in soil layer 2 (7 -28 cm) of the ECMWF Integrated Forecasting System. |
volumetric_soil_water_layer_3 | Volume fraction | 11132 meters | Volume of water in soil layer 3 (28-100 cm) of the ECMWF Integrated Forecasting System. |
volumetric_soil_water_layer_4 | Volume fraction | 11132 meters | Volume of water in soil layer 4 (100-289 cm) of the ECMWF Integrated Forecasting System. |
forecast_albedo | 11132 meters | Is a measure of the reflectivity of the Earth's surface. It is the fraction of solar (shortwave) radiation reflected by Earth's surface, across the solar spectrum, for both direct and diffuse radiation. Values are between 0 and 1. Typically, snow and ice have high reflectivity with albedo values of 0.8 and above, land has intermediate values between about 0.1 and 0.4 and the ocean has low values of 0.1 or less. Radiation from the Sun (solar, or shortwave, radiation) is partly reflected back to space by clouds and particles in the atmosphere (aerosols) and some of it is absorbed. The rest is incident on the Earth's surface, where some of it is reflected. The portion that is reflected by the Earth's surface depends on the albedo. In the ECMWF Integrated Forecasting System (IFS), a climatological background albedo (observed values averaged over a period of several years) is used, modified by the model over water, ice and snow. Albedo is often shown as a percentage (%). | |
surface_latent_heat_flux_sum | J/m^2 | 11132 meters | Exchange of latent heat with the surface through turbulent diffusion. This variables is accumulated from the beginning of the forecast time to the end of the forecast step. By model convention, downward fluxes are positive. |
surface_net_solar_radiation_sum | J/m^2 | 11132 meters | Amount of solar radiation (also known as shortwave radiation) reaching the surface of the Earth (both direct and diffuse) minus the amount reflected by the Earth's surface (which is governed by the albedo). Radiation from the Sun (solar, or shortwave, radiation) is partly reflected back to space by clouds and particles in the atmosphere (aerosols) and some of it is absorbed. The rest is incident on the Earth's surface, where some of it is reflected. The difference between downward and reflected solar radiation is the surface net solar radiation. This variable is accumulated from the beginning of the forecast time to the end of the forecast step. The units are joules per square meter (J m-2). To convert to watts per square meter (W m-2), the accumulated values should be divided by the accumulation period expressed in seconds. The ECMWF convention for vertical fluxes is positive downwards. |
surface_net_thermal_radiation_sum | J/m^2 | 11132 meters | Net thermal radiation at the surface. Accumulated field from the beginning of the forecast time to the end of the forecast step. By model convention downward fluxes are positive. |
surface_sensible_heat_flux_sum | J/m^2 | 11132 meters | Transfer of heat between the Earth's surface and the atmosphere through the effects of turbulent air motion (but excluding any heat transfer resulting from condensation or evaporation). The magnitude of the sensible heat flux is governed by the difference in temperature between the surface and the overlying atmosphere, wind speed and the surface roughness. For example, cold air overlying a warm surface would produce a sensible heat flux from the land (or ocean) into the atmosphere. This is a single level variable and it is accumulated from the beginning of the forecast time to the end of the forecast step. The units are joules per square meter (J m-2). To convert to watts per square meter (W m-2), the accumulated values should be divided by the accumulation period expressed in seconds. The ECMWF convention for vertical fluxes is positive downwards. |
surface_solar_radiation_downwards_sum | J/m^2 | 11132 meters | Amount of solar radiation (also known as shortwave radiation) reaching the surface of the Earth. This variable comprises both direct and diffuse solar radiation. Radiation from the Sun (solar, or shortwave, radiation) is partly reflected back to space by clouds and particles in the atmosphere (aerosols) and some of it is absorbed. The rest is incident on the Earth's surface (represented by this variable). To a reasonably good approximation, this variable is the model equivalent of what would be measured by a pyranometer (an instrument used for measuring solar radiation) at the surface. However, care should be taken when comparing model variables with observations, because observations are often local to a particular point in space and time, rather than representing averages over a model grid box and model time step. This variable is accumulated from the beginning of the forecast time to the end of the forecast step. The units are joules per square meter (J m-2). To convert to watts per square meter (W m-2), the accumulated values should be divided by the accumulation period expressed in seconds. The ECMWF convention for vertical fluxes is positive downwards. |
surface_thermal_radiation_downwards_sum | J/m^2 | 11132 meters | Amount of thermal (also known as longwave or terrestrial) radiation emitted by the atmosphere and clouds that reaches the Earth's surface. The surface of the Earth emits thermal radiation, some of which is absorbed by the atmosphere and clouds. The atmosphere and clouds likewise emit thermal radiation in all directions, some of which reaches the surface (represented by this variable). This variable is accumulated from the beginning of the forecast time to the end of the forecast step. The units are joules per square meter (J m-2). To convert to watts per square meter (W m-2), the accumulated values should be divided by the accumulation period expressed in seconds. The ECMWF convention for vertical fluxes is positive downwards. |
evaporation_from_bare_soil_sum | m of water equivalent | 11132 meters | The amount of evaporation from bare soil at the top of the land surface. This variable is accumulated from the beginning of the forecast time to the end of the forecast step. |
evaporation_from_open_water_surfaces_excluding_oceans_sum | m of water equivalent | 11132 meters | Amount of evaporation from surface water storage like lakes and inundated areas but excluding oceans. This variable is accumulated from the beginning of the forecast time to the end of the forecast step. |
evaporation_from_the_top_of_canopy_sum | m of water equivalent | 11132 meters | The amount of evaporation from the canopy interception reservoir at the top of the canopy. This variable is accumulated from the beginning of the forecast time to the end of the forecast step. |
evaporation_from_vegetation_transpiration_sum | m of water equivalent | 11132 meters | Amount of evaporation from vegetation transpiration. This has the same meaning as root extraction ie the amount of water extracted from the different soil layers. This variable is accumulated from the beginning of the forecast time to the end of the forecast step. |
potential_evaporation_sum | এম | 11132 meters | Potential evaporation (pev) in the current ECMWF model is computed, by making a second call to the surface energy balance routine with the vegetation variables set to "crops/mixed farming" and assuming no stress from soil moisture. In other words, evaporation is computed for agricultural land as if it is well watered and assuming that the atmosphere is not affected by this artificial surface condition. The latter may not always be realistic. Although pev is meant to provide an estimate of irrigation requirements, the method can give unrealistic results in arid conditions due to too strong evaporation forced by dry air. This variable is accumulated from the beginning of the forecast time to the end of the forecast step. |
runoff_sum | এম | 11132 meters | Some water from rainfall, melting snow, or deep in the soil, stays stored in the soil. Otherwise, the water drains away, either over the surface (surface runoff), or under the ground (sub-surface runoff) and the sum of these two is simply called 'runoff'. This variable is the total amount of water accumulated from the beginning of the forecast time to the end of the forecast step. The units of runoff are depth in meters. This is the depth the water would have if it were spread evenly over the grid box. Care should be taken when comparing model variables with observations, because observations are often local to a particular point rather than averaged over a grid square area. Observations are also often taken in different units, such as mm/day, rather than the accumulated meters produced here. Runoff is a measure of the availability of water in the soil, and can, for example, be used as an indicator of drought or flood. More information about how runoff is calculated is given in the IFS Physical Processes documentation. |
snow_evaporation_sum | m of water equivalent | 11132 meters | Evaporation from snow averaged over the grid box (to find flux over snow, divide by snow fraction). This variable is accumulated from the beginning of the forecast time to the end of the forecast step. |
sub_surface_runoff_sum | এম | 11132 meters | Some water from rainfall, melting snow, or deep in the soil, stays stored in the soil. Otherwise, the water drains away, either over the surface (surface runoff), or under the ground(sub-surface runoff) and the sum of these two is simply called 'runoff'. This variable is accumulated from the beginning of the forecast time to the end of the forecast step. The units of runoff are depth in meters. This is the depth the water would have if it were spread evenly over the grid box. Care should be taken when comparing model variables with observations, because observations are often local to a particular point rather than averaged over a grid square area. Observations are also often taken in different units, such as mm/day, rather than the accumulated meters produced here. Runoff is a measure of the availability of water in the soil, and can, for example, be used as an indicator of drought or flood. More information about how runoff is calculated is given in the IFS Physical Processes documentation. |
surface_runoff_sum | এম | 11132 meters | Some water from rainfall, melting snow, or deep in the soil, stays stored in the soil. Otherwise, the water drains away, either over the surface (surface runoff), or under the ground (sub-surface runoff) and the sum of these two is simply called 'runoff'. This variable is the total amount of water accumulated from the beginning of the forecast time to the end of the forecast step. The units of runoff are depth in meters. This is the depth the water would have if it were spread evenly over the grid box. Care should be taken when comparing model variables with observations, because observations are often local to a particular point rather than averaged over a grid square area. Observations are also often taken in different units, such as mm/day, rather than the accumulated meters produced here. Runoff is a measure of the availability of water in the soil, and can, for example, be used as an indicator of drought or flood. More information about how runoff is calculated is given in the IFS Physical Processes documentation. |
total_evaporation_sum | m of water equivalent | 11132 meters | Accumulated amount of water that has evaporated from the Earth's surface, including a simplified representation of transpiration (from vegetation), into vapor in the air above. This variable is accumulated from the beginning of the forecast to the end of the forecast step. The ECMWF Integrated Forecasting System convention is that downward fluxes are positive. Therefore, negative values indicate evaporation and positive values indicate condensation. |
u_component_of_wind_10m | মি/সে | 11132 meters | Eastward component of the 10m wind. It is the horizontal speed of air moving towards the east, at a height of ten meters above the surface of the Earth, in meters per second. Care should be taken when comparing this variable with observations, because wind observations vary on small space and time scales and are affected by the local terrain, vegetation and buildings that are represented only on average in the ECMWF Integrated Forecasting System. This variable can be combined with the V component of 10m wind to give the speed and direction of the horizontal 10m wind. |
v_component_of_wind_10m | মি/সে | 11132 meters | Northward component of the 10m wind. It is the horizontal speed of air moving towards the north, at a height of ten meters above the surface of the Earth, in meters per second. Care should be taken when comparing this variable with observations, because wind observations vary on small space and time scales and are affected by the local terrain, vegetation and buildings that are represented only on average in the ECMWF Integrated Forecasting System. This variable can be combined with the U component of 10m wind to give the speed and direction of the horizontal 10m wind. |
surface_pressure | পা | 11132 meters | Pressure (force per unit area) of the atmosphere on the surface of land, sea and in-land water. It is a measure of the weight of all the air in a column vertically above the area of the Earth's surface represented at a fixed point. Surface pressure is often used in combination with temperature to calculate air density. The strong variation of pressure with altitude makes it difficult to see the low and high pressure systems over mountainous areas, so mean sea level pressure, rather than surface pressure, is normally used for this purpose. The units of this variable are Pascals (Pa). Surface pressure is often measured in hPa and sometimes is presented in the old units of millibars, mb (1 hPa = 1 mb = 100 Pa). |
total_precipitation_sum | এম | 11132 meters | Accumulated liquid and frozen water, including rain and snow, that falls to the Earth's surface. It is the sum of large-scale precipitation (that precipitation which is generated by large-scale weather patterns, such as troughs and cold fronts) and convective precipitation (generated by convection which occurs when air at lower levels in the atmosphere is warmer and less dense than the air above, so it rises). Precipitation variables do not include fog, dew or the precipitation that evaporates in the atmosphere before it lands at the surface of the Earth. This variable is accumulated from the beginning of the forecast time to the end of the forecast step. The units of precipitation are depth in meters. It is the depth the water would have if it were spread evenly over the grid box. Care should be taken when comparing model variables with observations, because observations are often local to a particular point in space and time, rather than representing averages over a model grid box and model time step. |
leaf_area_index_high_vegetation | Area fraction | 11132 meters | One-half of the total green leaf area per unit horizontal ground surface area for high vegetation type. |
leaf_area_index_low_vegetation | Area fraction | 11132 meters | One-half of the total green leaf area per unit horizontal ground surface area for low vegetation type. |
dewpoint_temperature_2m_min | কে | 11132 meters | daily minimum dewpoint_temperature_2m value |
dewpoint_temperature_2m_max | কে | 11132 meters | daily maximum dewpoint_temperature_2m value |
temperature_2m_min | কে | 11132 meters | daily minimum temperature_2m value |
temperature_2m_max | কে | 11132 meters | daily maximum temperature_2m value |
skin_temperature_min | কে | 11132 meters | daily minimum skin_temperature value |
skin_temperature_max | কে | 11132 meters | daily maximum skin_temperature value |
soil_temperature_level_1_min | কে | 11132 meters | daily minimum soil_temperature_level_1 value |
soil_temperature_level_1_max | কে | 11132 meters | daily maximum soil_temperature_level_1 value |
soil_temperature_level_2_min | কে | 11132 meters | daily minimum soil_temperature_level_2 value |
soil_temperature_level_2_max | কে | 11132 meters | daily maximum soil_temperature_level_2 value |
soil_temperature_level_3_min | কে | 11132 meters | daily minimum soil_temperature_level_3 value |
soil_temperature_level_3_max | কে | 11132 meters | daily maximum soil_temperature_level_3 value |
soil_temperature_level_4_min | কে | 11132 meters | daily minimum soil_temperature_level_4 value |
soil_temperature_level_4_max | কে | 11132 meters | daily maximum soil_temperature_level_4 value |
lake_bottom_temperature_min | কে | 11132 meters | daily minimum lake_bottom_temperature value |
lake_bottom_temperature_max | কে | 11132 meters | daily maximum lake_bottom_temperature value |
lake_ice_depth_min | এম | 11132 meters | daily minimum lake_ice_depth value |
lake_ice_depth_max | এম | 11132 meters | daily maximum lake_ice_depth value |
lake_ice_temperature_min | কে | 11132 meters | daily minimum lake_ice_temperature value |
lake_ice_temperature_max | কে | 11132 meters | daily maximum lake_ice_temperature value |
lake_mix_layer_depth_min | এম | 11132 meters | daily minimum lake_mix_layer_depth value |
lake_mix_layer_depth_max | এম | 11132 meters | daily maximum lake_mix_layer_depth value |
lake_mix_layer_temperature_min | কে | 11132 meters | daily minimum lake_mix_layer_temperature value |
lake_mix_layer_temperature_max | কে | 11132 meters | daily maximum lake_mix_layer_temperature value |
lake_shape_factor_min | 11132 meters | daily minimum lake_shape_factor value | |
lake_shape_factor_max | 11132 meters | daily maximum lake_shape_factor value | |
lake_total_layer_temperature_min | কে | 11132 meters | daily minimum lake_total_layer_temperature value |
lake_total_layer_temperature_max | কে | 11132 meters | daily maximum lake_total_layer_temperature value |
snow_albedo_min | 11132 meters | daily minimum snow_albedo value | |
snow_albedo_max | 11132 meters | daily maximum snow_albedo value | |
snow_cover_min | 11132 meters | daily minimum snow_cover value | |
snow_cover_max | 11132 meters | daily maximum snow_cover value | |
snow_density_min | kg/m^3 | 11132 meters | daily minimum snow_density value |
snow_density_max | kg/m^3 | 11132 meters | daily maximum snow_density value |
snow_depth_min | এম | 11132 meters | daily minimum snow_depth value |
snow_depth_max | এম | 11132 meters | daily maximum snow_depth value |
snow_depth_water_equivalent_min | m of water equivalent | 11132 meters | daily minimum snow_depth_water_equivalent value |
snow_depth_water_equivalent_max | m of water equivalent | 11132 meters | daily maximum snow_depth_water_equivalent value |
snowfall_min | m of water equivalent | 11132 meters | daily minimum snowfall value |
snowfall_max | m of water equivalent | 11132 meters | daily maximum snowfall value |
snowmelt_min | m of water equivalent | 11132 meters | daily minimum snowmelt value |
snowmelt_max | m of water equivalent | 11132 meters | daily maximum snowmelt value |
temperature_of_snow_layer_min | কে | 11132 meters | daily minimum temperature_of_snow_layer value |
temperature_of_snow_layer_max | কে | 11132 meters | daily maximum temperature_of_snow_layer value |
skin_reservoir_content_min | m of water equivalent | 11132 meters | daily minimum skin_reservoir_content value |
skin_reservoir_content_max | m of water equivalent | 11132 meters | daily maximum skin_reservoir_content value |
volumetric_soil_water_layer_1_min | Volume fraction | 11132 meters | daily minimum volumetric_soil_water_layer_1 value |
volumetric_soil_water_layer_1_max | Volume fraction | 11132 meters | daily maximum volumetric_soil_water_layer_1 value |
volumetric_soil_water_layer_2_min | Volume fraction | 11132 meters | daily minimum volumetric_soil_water_layer_2 value |
volumetric_soil_water_layer_2_max | Volume fraction | 11132 meters | daily maximum volumetric_soil_water_layer_2 value |
volumetric_soil_water_layer_3_min | Volume fraction | 11132 meters | daily minimum volumetric_soil_water_layer_3 value |
volumetric_soil_water_layer_3_max | Volume fraction | 11132 meters | daily maximum volumetric_soil_water_layer_3 value |
volumetric_soil_water_layer_4_min | Volume fraction | 11132 meters | daily minimum volumetric_soil_water_layer_4 value |
volumetric_soil_water_layer_4_max | Volume fraction | 11132 meters | daily maximum volumetric_soil_water_layer_4 value |
forecast_albedo_min | 11132 meters | daily minimum forecast_albedo value | |
forecast_albedo_max | 11132 meters | daily maximum forecast_albedo value | |
surface_latent_heat_flux_min | J/m^2 | 11132 meters | daily minimum surface_latent_heat_flux value |
surface_latent_heat_flux_max | J/m^2 | 11132 meters | daily maximum surface_latent_heat_flux value |
surface_net_solar_radiation_min | J/m^2 | 11132 meters | daily minimum surface_net_solar_radiation value |
surface_net_solar_radiation_max | J/m^2 | 11132 meters | daily maximum surface_net_solar_radiation value |
surface_net_thermal_radiation_min | J/m^2 | 11132 meters | daily minimum surface_net_thermal_radiation value |
surface_net_thermal_radiation_max | J/m^2 | 11132 meters | daily maximum surface_net_thermal_radiation value |
surface_sensible_heat_flux_min | J/m^2 | 11132 meters | daily minimum surface_sensible_heat_flux value |
surface_sensible_heat_flux_max | J/m^2 | 11132 meters | daily maximum surface_sensible_heat_flux value |
surface_solar_radiation_downwards_min | J/m^2 | 11132 meters | daily minimum surface_solar_radiation_downwards value |
surface_solar_radiation_downwards_max | J/m^2 | 11132 meters | daily maximum surface_solar_radiation_downwards value |
surface_thermal_radiation_downwards_min | J/m^2 | 11132 meters | daily minimum surface_thermal_radiation_downwards value |
surface_thermal_radiation_downwards_max | J/m^2 | 11132 meters | daily maximum surface_thermal_radiation_downwards value |
evaporation_from_bare_soil_min | m of water equivalent | 11132 meters | daily minimum evaporation_from_bare_soil value |
evaporation_from_bare_soil_max | m of water equivalent | 11132 meters | daily maximum evaporation_from_bare_soil value |
evaporation_from_open_water_surfaces_excluding_oceans_min | m of water equivalent | 11132 meters | daily minimum evaporation_from_open_water_surfaces_excluding_oceans value |
evaporation_from_open_water_surfaces_excluding_oceans_max | m of water equivalent | 11132 meters | daily maximum evaporation_from_open_water_surfaces_excluding_oceans value |
evaporation_from_the_top_of_canopy_min | m of water equivalent | 11132 meters | daily minimum evaporation_from_the_top_of_canopy value |
evaporation_from_the_top_of_canopy_max | m of water equivalent | 11132 meters | daily maximum evaporation_from_the_top_of_canopy value |
evaporation_from_vegetation_transpiration_min | m of water equivalent | 11132 meters | daily minimum evaporation_from_vegetation_transpiration value |
evaporation_from_vegetation_transpiration_max | m of water equivalent | 11132 meters | daily maximum evaporation_from_vegetation_transpiration value |
potential_evaporation_min | এম | 11132 meters | daily minimum potential_evaporation value |
potential_evaporation_max | এম | 11132 meters | daily maximum potential_evaporation value |
runoff_min | এম | 11132 meters | daily minimum runoff value |
runoff_max | এম | 11132 meters | daily maximum runoff value |
snow_evaporation_min | m of water equivalent | 11132 meters | daily minimum snow_evaporation value |
snow_evaporation_max | m of water equivalent | 11132 meters | daily maximum snow_evaporation value |
sub_surface_runoff_min | এম | 11132 meters | daily minimum sub_surface_runoff value |
sub_surface_runoff_max | এম | 11132 meters | daily maximum sub_surface_runoff value |
surface_runoff_min | এম | 11132 meters | daily minimum surface_runoff value |
surface_runoff_max | এম | 11132 meters | daily maximum surface_runoff value |
total_evaporation_min | m of water equivalent | 11132 meters | daily minimum total_evaporation value |
total_evaporation_max | m of water equivalent | 11132 meters | daily maximum total_evaporation value |
u_component_of_wind_10m_min | মি/সে | 11132 meters | daily minimum u_component_of_wind_10m value |
u_component_of_wind_10m_max | মি/সে | 11132 meters | daily maximum u_component_of_wind_10m value |
v_component_of_wind_10m_min | মি/সে | 11132 meters | daily minimum v_component_of_wind_10m value |
v_component_of_wind_10m_max | মি/সে | 11132 meters | daily maximum v_component_of_wind_10m value |
surface_pressure_min | পা | 11132 meters | daily minimum surface_pressure value |
surface_pressure_max | পা | 11132 meters | daily maximum surface_pressure value |
total_precipitation_min | এম | 11132 meters | daily minimum total_precipitation value |
total_precipitation_max | এম | 11132 meters | daily maximum total_precipitation value |
leaf_area_index_high_vegetation_min | Area fraction | 11132 meters | daily minimum leaf_area_index_high_vegetation value |
leaf_area_index_high_vegetation_max | Area fraction | 11132 meters | daily maximum leaf_area_index_high_vegetation value |
leaf_area_index_low_vegetation_min | Area fraction | 11132 meters | daily minimum leaf_area_index_low_vegetation value |
leaf_area_index_low_vegetation_max | Area fraction | 11132 meters | daily maximum leaf_area_index_low_vegetation value |
ছবির বৈশিষ্ট্য
ছবির বৈশিষ্ট্য
| নাম | প্রকার | বর্ণনা |
|---|---|---|
| দিন | INT | Calendar day |
| মাস | INT | Calendar month |
| বছর | INT | Calendar year |
ব্যবহারের শর্তাবলী
ব্যবহারের শর্তাবলী
Please acknowledge the use of ERA5-Land as stated in the Copernicus C3S/CAMS License agreement :
5.1.1 Where the Licensee communicates or distributes Copernicus Products to the public, the Licensee shall inform the recipients of the source by using the following or any similar notice: 'Generated using Copernicus Climate Change Service Information [Year]'.
5.1.2 Where the Licensee makes or contributes to a publication or distribution containing adapted or modified Copernicus Products, the Licensee shall provide the following or any similar notice: 'Contains modified Copernicus Climate Change Service Information [Year]';
Any such publication or distribution covered by clauses 5.1.1 and 5.1.2 shall state that neither the European Commission nor ECMWF is responsible for any use that may be made of the Copernicus Information or Data it contains.
উদ্ধৃতি
Muñoz Sabater, J., (2019): ERA5-Land monthly averaged data from 1981 to present. Copernicus Climate Change Service (C3S) Climate Data Store (CDS). (<date of access>), doi:10.24381/cds.68d2bb30
আর্থ ইঞ্জিন দিয়ে অন্বেষণ করুন
কোড এডিটর (জাভাস্ক্রিপ্ট)
var dataset = ee.ImageCollection('ECMWF/ERA5_LAND/DAILY_AGGR').first();

var visualization = {
  bands: ['temperature_2m'],
  min: 250,
  max: 320,
  palette: [
    '000080', '0000d9', '4000ff', '8000ff', '0080ff', '00ffff',
    '00ff80', '80ff00', 'daff00', 'ffff00', 'fff500', 'ffda00',
    'ffb000', 'ffa400', 'ff4f00', 'ff2500', 'ff0a00', 'ff00ff',
  ]
};
Map.setCenter(70, 45, 3);
Map.addLayer(
    dataset, visualization, 'Air temperature (K) at 2m height', true, 0.8);