
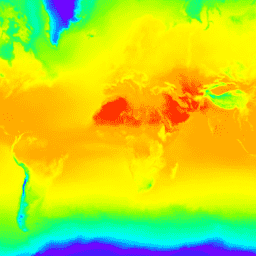
- ความพร้อมของชุดข้อมูล
- 1979-01-02T00:00:00Z–2020-07-09T00:00:00Z
- ผู้ผลิตชุดข้อมูล
- ECMWF / Copernicus Climate Change Service
- ความถี่การบันทึก
- 1 วัน
- แท็ก
คำอธิบาย
ERA5 คือการวิเคราะห์สภาพอากาศซ้ำครั้งที่ 5 ของ ECMWF เกี่ยวกับสภาพภูมิอากาศทั่วโลก การวิเคราะห์สภาพอากาศซ้ำจะรวมข้อมูลแบบจำลองเข้ากับการสังเกตการณ์จากทั่วโลกเป็นชุดข้อมูลที่สมบูรณ์และสอดคล้องกันทั่วโลก ERA5 มาแทนที่การวิเคราะห์สภาพอากาศซ้ำ ERA-Interim ซึ่งเป็นรุ่นก่อนหน้า
ERA5 DAILY ให้ค่ารวมสำหรับแต่ละวันสำหรับพารามิเตอร์การวิเคราะห์สภาพอากาศซ้ำ 7 รายการของ ERA5 ได้แก่ อุณหภูมิอากาศที่ความสูง 2 ม. อุณหภูมิจุดน้ำค้างที่ความสูง 2 ม. ปริมาณน้ำฝนทั้งหมด ความกดอากาศระดับน้ำทะเลเฉลี่ย ความกดอากาศพื้นผิว ส่วนประกอบลมตามแนวแกน u ที่ความสูง 10 ม. และส่วนประกอบลมตามแนวแกน v ที่ความสูง 10 ม. นอกจากนี้ ระบบยังคำนวณอุณหภูมิอากาศต่ำสุดและสูงสุดรายวันที่ความสูง 2 ม. โดยอิงตามข้อมูลอุณหภูมิอากาศรายชั่วโมงที่ความสูง 2 ม. ค่าปริมาณน้ำฝนทั้งหมดรายวันจะแสดงเป็นผลรวมรายวัน ส่วนพารามิเตอร์อื่นๆ ทั้งหมดจะแสดงเป็นค่าเฉลี่ยรายวัน
ข้อมูล ERA5 มีให้ตั้งแต่ปี 1979 จนถึง 3 เดือนนับจากเวลาจริง ดูข้อมูลเพิ่มเติม และพารามิเตอร์สภาพอากาศเพิ่มเติมของ ERA5 ได้ที่ Copernicus Climate Data Store
หมายเหตุจากผู้ให้บริการ: ระบบคำนวณค่ารวมรายวันโดยอิงตามค่ารายชั่วโมงของพารามิเตอร์แต่ละรายการของ ERA5
ย่านความถี่
ย่านความถี่
ขนาดพิกเซล: 27,830 เมตร (ทุกย่านความถี่)
| ชื่อ | หน่วย | ต่ำสุด | สูงสุด | ขนาดพิกเซล | คำอธิบาย |
|---|---|---|---|---|---|
mean_2m_air_temperature |
K | 223.6* | 304* | 27,830 เมตร | อุณหภูมิอากาศเฉลี่ยที่ความสูง 2 ม. (ค่าเฉลี่ยรายวัน) |
minimum_2m_air_temperature |
K | 220.7* | 300.8* | 27,830 เมตร | อุณหภูมิอากาศต่ำสุดที่ความสูง 2 ม. (ค่าต่ำสุดรายวัน) |
maximum_2m_air_temperature |
K | 225.8* | 310.2* | 27,830 เมตร | อุณหภูมิอากาศสูงสุดที่ความสูง 2 ม. (ค่าสูงสุดรายวัน) |
dewpoint_2m_temperature |
K | 219.3* | 297.8* | 27,830 เมตร | อุณหภูมิจุดน้ำค้างที่ความสูง 2 ม. (ค่าเฉลี่ยรายวัน) |
total_precipitation |
ม. | 0* | 0.02* | 27,830 เมตร | ปริมาณน้ำฝนทั้งหมด (ผลรวมรายวัน) |
surface_pressure |
Pa | 65,639* | 102,595* | 27,830 เมตร | ความกดอากาศพื้นผิว (ค่าเฉลี่ยรายวัน) |
mean_sea_level_pressure |
Pa | 97,657.4* | 103,861* | 27,830 เมตร | ความกดอากาศระดับน้ำทะเลเฉลี่ย (ค่าเฉลี่ยรายวัน) |
u_component_of_wind_10m |
ม./วิ | -11.4* | 11.4* | 27,830 เมตร | ส่วนประกอบลมตามแนวแกน u ที่ความสูง 10 ม. (ค่าเฉลี่ยรายวัน) |
v_component_of_wind_10m |
ม./วิ | -10.1* | 10.1* | 27,830 เมตร | ส่วนประกอบลมตามแนวแกน v ที่ความสูง 10 ม. (ค่าเฉลี่ยรายวัน) |
พร็อพเพอร์ตี้รูปภาพ
พร็อพเพอร์ตี้รูปภาพ
| ชื่อ | ประเภท | คำอธิบาย |
|---|---|---|
| เดือน | INT | เดือนของข้อมูล |
| ปี | INT | ปีของข้อมูล |
| วัน | INT | วันของข้อมูล |
ข้อกำหนดในการใช้งาน
ข้อกำหนดในการใช้งาน
โปรดยอมรับการใช้ ERA5 ตามที่ระบุไว้ในข้อตกลงการอนุญาตให้ใช้สิทธิ C3S/CAMS ของ Copernicus
- 5.1.1 ในกรณีที่ผู้รับใบอนุญาตสื่อสารหรือเผยแพร่ผลิตภัณฑ์ของ Copernicus ต่อสาธารณะ ผู้รับใบอนุญาตจะต้องแจ้งให้ผู้รับทราบแหล่งที่มาโดยใช้ข้อความต่อไปนี้หรือข้อความที่คล้ายกัน "สร้างขึ้นโดยใช้ข้อมูลจากหน่วยบริการสังเกตการณ์ชั้นบรรยากาศโคเปอร์นิคัส (ปี)"
- 5.1.2 ในกรณีที่ผู้รับใบอนุญาตจัดทำหรือมีส่วนร่วมในการเผยแพร่หรือการเผยแพร่ที่มีผลิตภัณฑ์ของ Copernicus ที่ปรับเปลี่ยน ผู้รับใบอนุญาตจะต้องระบุข้อความต่อไปนี้หรือข้อความที่คล้ายกัน "มีข้อมูลจากหน่วยบริการสังเกตการณ์ชั้นบรรยากาศโคเปอร์นิคัส (ปี) ที่ปรับเปลี่ยน"
- 5.1.3 การเผยแพร่หรือการเผยแพร่ดังกล่าวที่ครอบคลุมโดยข้อ 5.1.1 และ 5.1.2 จะต้องระบุว่าทั้งคณะกรรมาธิการยุโรปและ ECMWF จะไม่รับผิดชอบต่อการใช้ข้อมูลที่จัดทำโดยหน่วยบริการสังเกตการณ์ชั้นบรรยากาศโคเปอร์นิคัสหรือข้อมูลที่มีอยู่ในนั้น
การอ้างอิง
Copernicus Climate Change Service (C3S) (2017): ERA5: Fifth generation of ECMWF atmospheric reanalyses of the global climate. Copernicus Climate Change Service Climate Data Store (CDS), (date of access), https://cds.climate.copernicus.eu/datasets/reanalysis-era5-single-levels?tab=overview
สำรวจด้วย Earth Engine
ตัวแก้ไขโค้ด (JavaScript)
// Example script to load and visualize ERA5 climate reanalysis parameters in
// Google Earth Engine

// Daily mean 2m air temperature
var era5_2mt = ee.ImageCollection('ECMWF/ERA5/DAILY')
                   .select('mean_2m_air_temperature')
                   .filter(ee.Filter.date('2019-07-01', '2019-07-31'));
print(era5_2mt);

// Daily total precipitation sums
var era5_tp = ee.ImageCollection('ECMWF/ERA5/DAILY')
                  .select('total_precipitation')
                  .filter(ee.Filter.date('2019-07-01', '2019-07-31'));

// Daily mean 2m dewpoint temperature
var era5_2d = ee.ImageCollection('ECMWF/ERA5/DAILY')
                  .select('dewpoint_2m_temperature')
                  .filter(ee.Filter.date('2019-07-01', '2019-07-31'));

// Daily mean sea-level pressure
var era5_mslp = ee.ImageCollection('ECMWF/ERA5/DAILY')
                    .select('mean_sea_level_pressure')
                    .filter(ee.Filter.date('2019-07-01', '2019-07-31'));

// Daily mean surface pressure
var era5_sp = ee.ImageCollection('ECMWF/ERA5/DAILY')
                  .select('surface_pressure')
                  .filter(ee.Filter.date('2019-07-01', '2019-07-31'));

// Daily mean 10m u-component of wind
var era5_u_wind_10m = ee.ImageCollection('ECMWF/ERA5/DAILY')
                          .select('u_component_of_wind_10m')
                          .filter(ee.Filter.date('2019-07-01', '2019-07-31'));

// Convert pressure levels from Pa to hPa - Example for surface pressure
var era5_sp = era5_sp.map(function(image) {
  return image.divide(100).set(
      'system:time_start', image.get('system:time_start'));
});

// Visualization palette for total precipitation
var visTp = {
  min: 0.0,
  max: 0.1,
  palette: ['ffffff', '00ffff', '0080ff', 'da00ff', 'ffa400', 'ff0000']
};

// Visualization palette for temperature (mean, min and max) and 2m dewpoint
// temperature
var vis2mt = {
  min: 250,
  max: 320,
  palette: [
    '000080', '0000d9', '4000ff', '8000ff', '0080ff', '00ffff', '00ff80',
    '80ff00', 'daff00', 'ffff00', 'fff500', 'ffda00', 'ffb000', 'ffa400',
    'ff4f00', 'ff2500', 'ff0a00', 'ff00ff'
  ]
};

// Visualization palette for u- and v-component of 10m wind
var visWind = {
  min: 0,
  max: 30,
  palette: [
    'ffffff', 'ffff71', 'deff00', '9eff00', '77b038', '007e55', '005f51',
    '004b51', '013a7b', '023aad'
  ]
};

// Visualization palette for pressure (surface pressure, mean sea level
// pressure) - adjust min and max values for mslp to min:990 and max:1050
var visPressure = {
  min: 500,
  max: 1150,
  palette: [
    '01ffff', '058bff', '0600ff', 'df00ff', 'ff00ff', 'ff8c00', 'ff8c00'
  ]
};


// Add layer to map
Map.addLayer(
    era5_tp.filter(ee.Filter.date('2019-07-15')), visTp,
    'Daily total precipitation sums');
Map.addLayer(
    era5_2d.filter(ee.Filter.date('2019-07-15')), vis2mt,
    'Daily mean 2m dewpoint temperature');
Map.addLayer(
    era5_2mt.filter(ee.Filter.date('2019-07-15')), vis2mt,
    'Daily mean 2m air temperature');
Map.addLayer(
    era5_u_wind_10m.filter(ee.Filter.date('2019-07-15')), visWind,
    'Daily mean 10m u-component of wind');
Map.addLayer(
    era5_sp.filter(ee.Filter.date('2019-07-15')), visPressure,
    'Daily mean surface pressure');

Map.setCenter(21.2, 22.2, 2);
import ee
import geemap.core as geemap
Colab (Python)
# Example script to load and visualize ERA5 climate reanalysis parameters in
# Google Earth Engine

# Daily mean 2m air temperature
era5_2mt = (
    ee.ImageCollection('ECMWF/ERA5/DAILY')
    .select('mean_2m_air_temperature')
    .filter(ee.Filter.date('2019-07-01', '2019-07-31'))
)
display(era5_2mt)

# Daily total precipitation sums
era5_tp = (
    ee.ImageCollection('ECMWF/ERA5/DAILY')
    .select('total_precipitation')
    .filter(ee.Filter.date('2019-07-01', '2019-07-31'))
)

# Daily mean 2m dewpoint temperature
era5_2d = (
    ee.ImageCollection('ECMWF/ERA5/DAILY')
    .select('dewpoint_2m_temperature')
    .filter(ee.Filter.date('2019-07-01', '2019-07-31'))
)

# Daily mean sea-level pressure
era5_mslp = (
    ee.ImageCollection('ECMWF/ERA5/DAILY')
    .select('mean_sea_level_pressure')
    .filter(ee.Filter.date('2019-07-01', '2019-07-31'))
)

# Daily mean surface pressure
era5_sp = (
    ee.ImageCollection('ECMWF/ERA5/DAILY')
    .select('surface_pressure')
    .filter(ee.Filter.date('2019-07-01', '2019-07-31'))
)

# Daily mean 10m u-component of wind
era5_u_wind_10m = (
    ee.ImageCollection('ECMWF/ERA5/DAILY')
    .select('u_component_of_wind_10m')
    .filter(ee.Filter.date('2019-07-01', '2019-07-31'))
)

# Convert pressure levels from Pa to hPa - Example for surface pressure
era5_sp = era5_sp.map(
    lambda image: image.divide(100).set(
        'system:time_start', image.get('system:time_start')
    )
)

# Visualization palette for total precipitation
vis_tp = {
    'min': 0.0,
    'max': 0.1,
    'palette': ['ffffff', '00ffff', '0080ff', 'da00ff', 'ffa400', 'ff0000'],
}

# Visualization palette for temperature (mean, min and max) and 2m dewpoint
# temperature
vis_2mt = {
    'min': 250,
    'max': 320,
    'palette': [
        '000080',
        '0000d9',
        '4000ff',
        '8000ff',
        '0080ff',
        '00ffff',
        '00ff80',
        '80ff00',
        'daff00',
        'ffff00',
        'fff500',
        'ffda00',
        'ffb000',
        'ffa400',
        'ff4f00',
        'ff2500',
        'ff0a00',
        'ff00ff',
    ],
}

# Visualization palette for u- and v-component of 10m wind
vis_wind = {
    'min': 0,
    'max': 30,
    'palette': [
        'ffffff',
        'ffff71',
        'deff00',
        '9eff00',
        '77b038',
        '007e55',
        '005f51',
        '004b51',
        '013a7b',
        '023aad',
    ],
}

# Visualization palette for pressure (surface pressure, mean sea level
# pressure) - adjust min and max values for mslp to 'min':990 and 'max':1050
vis_pressure = {
    'min': 500,
    'max': 1150,
    'palette': [
        '01ffff',
        '058bff',
        '0600ff',
        'df00ff',
        'ff00ff',
        'ff8c00',
        'ff8c00',
    ],
}


# Add layer to map
m = geemap.Map()
m.add_layer(
    era5_tp.filter(ee.Filter.date('2019-07-15')),
    vis_tp,
    'Daily total precipitation sums',
)
m.add_layer(
    era5_2d.filter(ee.Filter.date('2019-07-15')),
    vis_2mt,
    'Daily mean 2m dewpoint temperature',
)
m.add_layer(
    era5_2mt.filter(ee.Filter.date('2019-07-15')),
    vis_2mt,
    'Daily mean 2m air temperature',
)
m.add_layer(
    era5_u_wind_10m.filter(ee.Filter.date('2019-07-15')),
    vis_wind,
    'Daily mean 10m u-component of wind',
)
m.add_layer(
    era5_sp.filter(ee.Filter.date('2019-07-15')),
    vis_pressure,
    'Daily mean surface pressure',
)

m.set_center(21.2, 22.2, 2)
m