- 데이터 세트 제공
- 2019-01-01T00:00:00Z–2019-12-31T00:00:00Z
- 데이터 세트 출처
- Biopama 프로그램
- 태그
설명
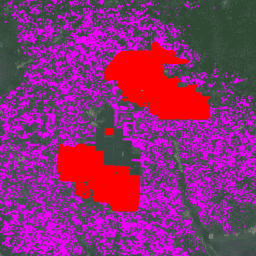
이 데이터 세트는 2019년의 10m 전 세계 산업 및 소규모 자영농 팜유 지도입니다. 팜유 농장이 감지된 지역을 포함합니다. 분류된 이미지는 Sentinel-1 및 Sentinel-2 반년 합성물을 기반으로 하는 컨볼루셔널 신경망의 출력입니다.
자세한 내용은 도움말을 참고하세요.
대역
대역
픽셀 크기: 10m (모든 대역)
| 이름 | 픽셀 크기 | 설명 |
|---|---|---|
classification |
10m | 팜유 클래스 설명 |
분류 클래스 표
| 값 | 색상 | 설명 |
|---|---|---|
| 1 | #ff0000 | 산업용 폐쇄형 캐노피 팜유 농장 |
| 2 | #ef00ff | 소규모 자영농 폐쇄형 캐노피 팜유 농장 |
| 3 | #696969 | 폐쇄형 캐노피 팜유가 아닌 기타 토지 피복 또는 용도 |
이용약관
이용약관
인용
인용:
Adrià, D., Serge, W., Erik, M., David, G., Stephen, P., &Zoltan, S. (2021). 2019년의 고해상도 전 세계 산업 및 소규모 자영농 팜유 지도 (버전 v1)[데이터 세트]. Zenodo. doi:10.5281/zenodo.4473715
DOI
Earth Engine으로 탐색
코드 편집기 (JavaScript)
// Import the dataset; a collection of composite granules from 2019.
var dataset = ee.ImageCollection('BIOPAMA/GlobalOilPalm/v1');

// Select the classification band.
var opClass = dataset.select('classification');

// Mosaic all of the granules into a single image.
var mosaic = opClass.mosaic();

// Define visualization parameters.
var classificationVis = {
  min: 1,
  max: 3,
  palette: ['ff0000','ef00ff', '696969']
};

// Create a mask to add transparency to non-oil palm plantation class pixels.
var mask = mosaic.neq(3);
mask = mask.where(mask.eq(0), 0.6);

// Display the data on the map.
Map.addLayer(mosaic.updateMask(mask),
             classificationVis, 'Oil palm plantation type', true);
Map.setCenter(-3.0175, 5.2745,12);
import ee
import geemap.core as geemap
Colab(Python)
# Import the dataset a collection of composite granules from 2019.
dataset = ee.ImageCollection('BIOPAMA/GlobalOilPalm/v1')

# Select the classification band.
op_class = dataset.select('classification')

# Mosaic all of the granules into a single image.
mosaic = op_class.mosaic()

# Define visualization parameters.
classification_vis = {
    'min': 1,
    'max': 3,
    'palette': ['ff0000', 'ef00ff', '696969'],
}

# Create a mask to add transparency to non-oil palm plantation class pixels.
mask = mosaic.neq(3)
mask = mask.where(mask.eq(0), 0.6)

# Display the data on the map.
m = geemap.Map()
m.add_layer(
    mosaic.updateMask(mask),
    classification_vis,
    'Oil palm plantation type',
    True,
)
m.set_center(-3.0175, 5.2745, 12)
m