This document describes how to access and view virtual machine (VM) metrics. It also describes how to review VM metrics to learn more about your VMs or troubleshoot specific problems with a VM.
Monitoring virtual machine (VM) instances is essential to maintaining your VM resources. Compute Engine offers a high-level view of your VM metrics using the Observability tab in the Google Cloud console. This tab provides a predefined dashboard using telemetry data so you can monitor your VMs and make informed decisions about your Compute Engine resources. You can also customize the predefined dashboard to view only the specific metrics that you want.
All VMs have basic process utilization data available when they are created. However, installing the Ops Agent provides deeper insights into VM behavior.
For more information about creating a monitoring alerting policy, using the Metrics Explorer, or for general information on how monitoring and metrics work on Google Cloud, see Cloud Monitoring documents.
Before you begin
Optional: Install the Ops Agent to gather more detailed data from your Compute Engine instances.
To check which VM instances have the Ops Agent installed, do the following:
In the Google Cloud console, go to Monitoring Dashboards
Select VM instances from the dashboard list.
Click List to view the VMs as a list.
All the VMs in your project are displayed. The Agent column shows the status of Ops Agent installation. You can install or update the agent from this page.
Access VM observability metrics
Access information for single or multiple VMs using the Observability tab in the Google Cloud console. By default, a predefined dashboard displays the VM metrics. If you want to view only the specific metrics that you want, you can create a customized dashboard.
View observability metrics for a single VM
Basic VM metrics such as CPU utilization and network traffic are available to you when you create your VM. Metrics for memory and process utilization are only available with the installation of the Ops Agent, which is the primary agent for collecting telemetry from your Compute Engine instances.
To view the metrics for a single VM do the following:
In the Google Cloud console, go to the VM instances page.
Select a VM to open the Details page.
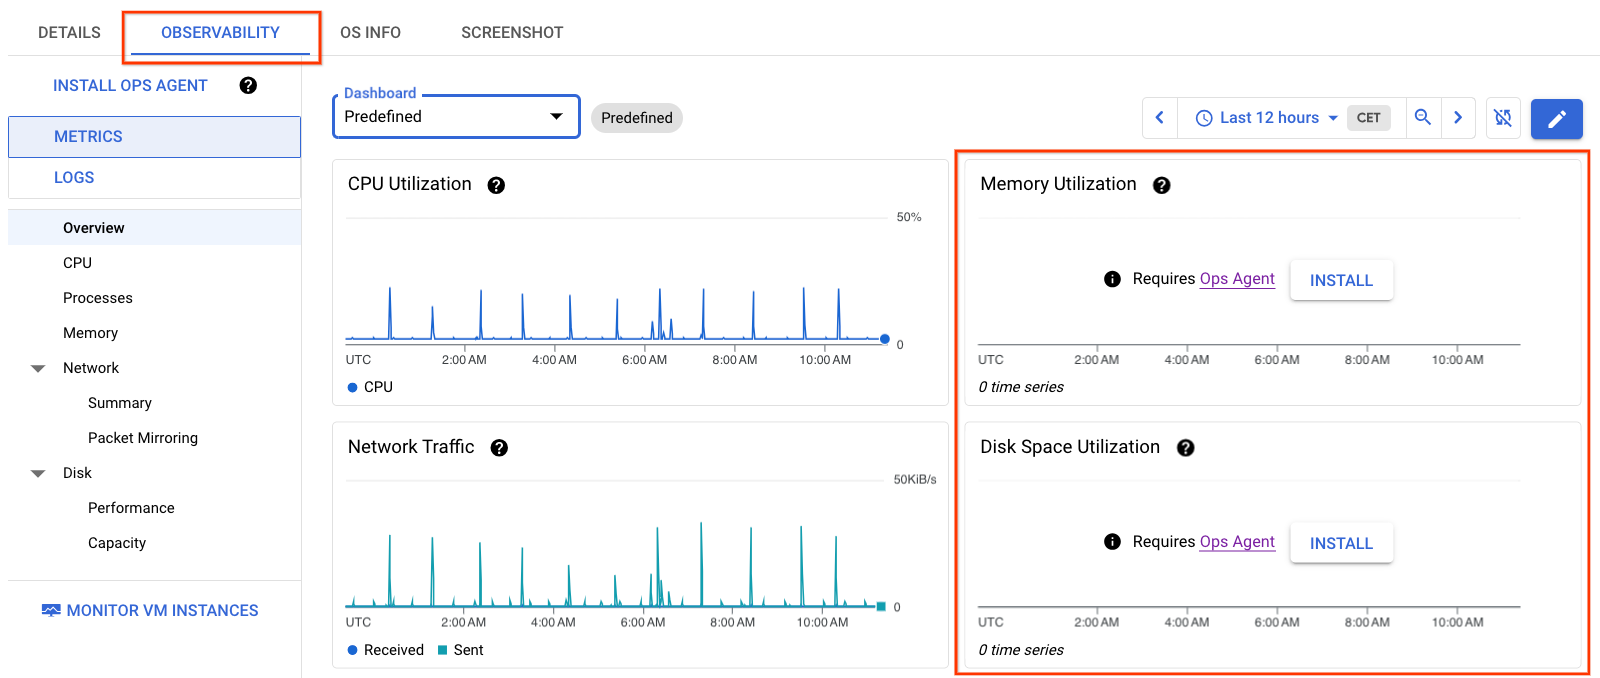
Click the Observability tab to display information about the VM.
Optional: Reset the one hour default timeframe to the timeframe you want to monitor.
The information in Figure 1 displays VM details without the Ops Agent installed on the VM. Notice that the Memory and Disk Space Utilization graphs have no data.
View observability metrics for multiple VMs
Observability at the fleet level displays the metrics for the top five VMs with the highest process utilization. The top five VMs listed vary by metric. You might not see the same five VMs for each process. Although there is more data available at the fleet level without installing the Ops Agent compared to the amount of data available for a single VM, installing the agent provides more data for future troubleshooting purposes.
To view the metrics for multiple VMs, do the following:
In the Google Cloud console, go to the VM instances page.
Click the Observability tab.
Optional: Reset the one hour default timeframe to the timeframe that you want to monitor.
Filter the results by one or more of the following options:
- ID
- Name
- Machine type
- Zone
- Region
- Instance group
- Labels
- State
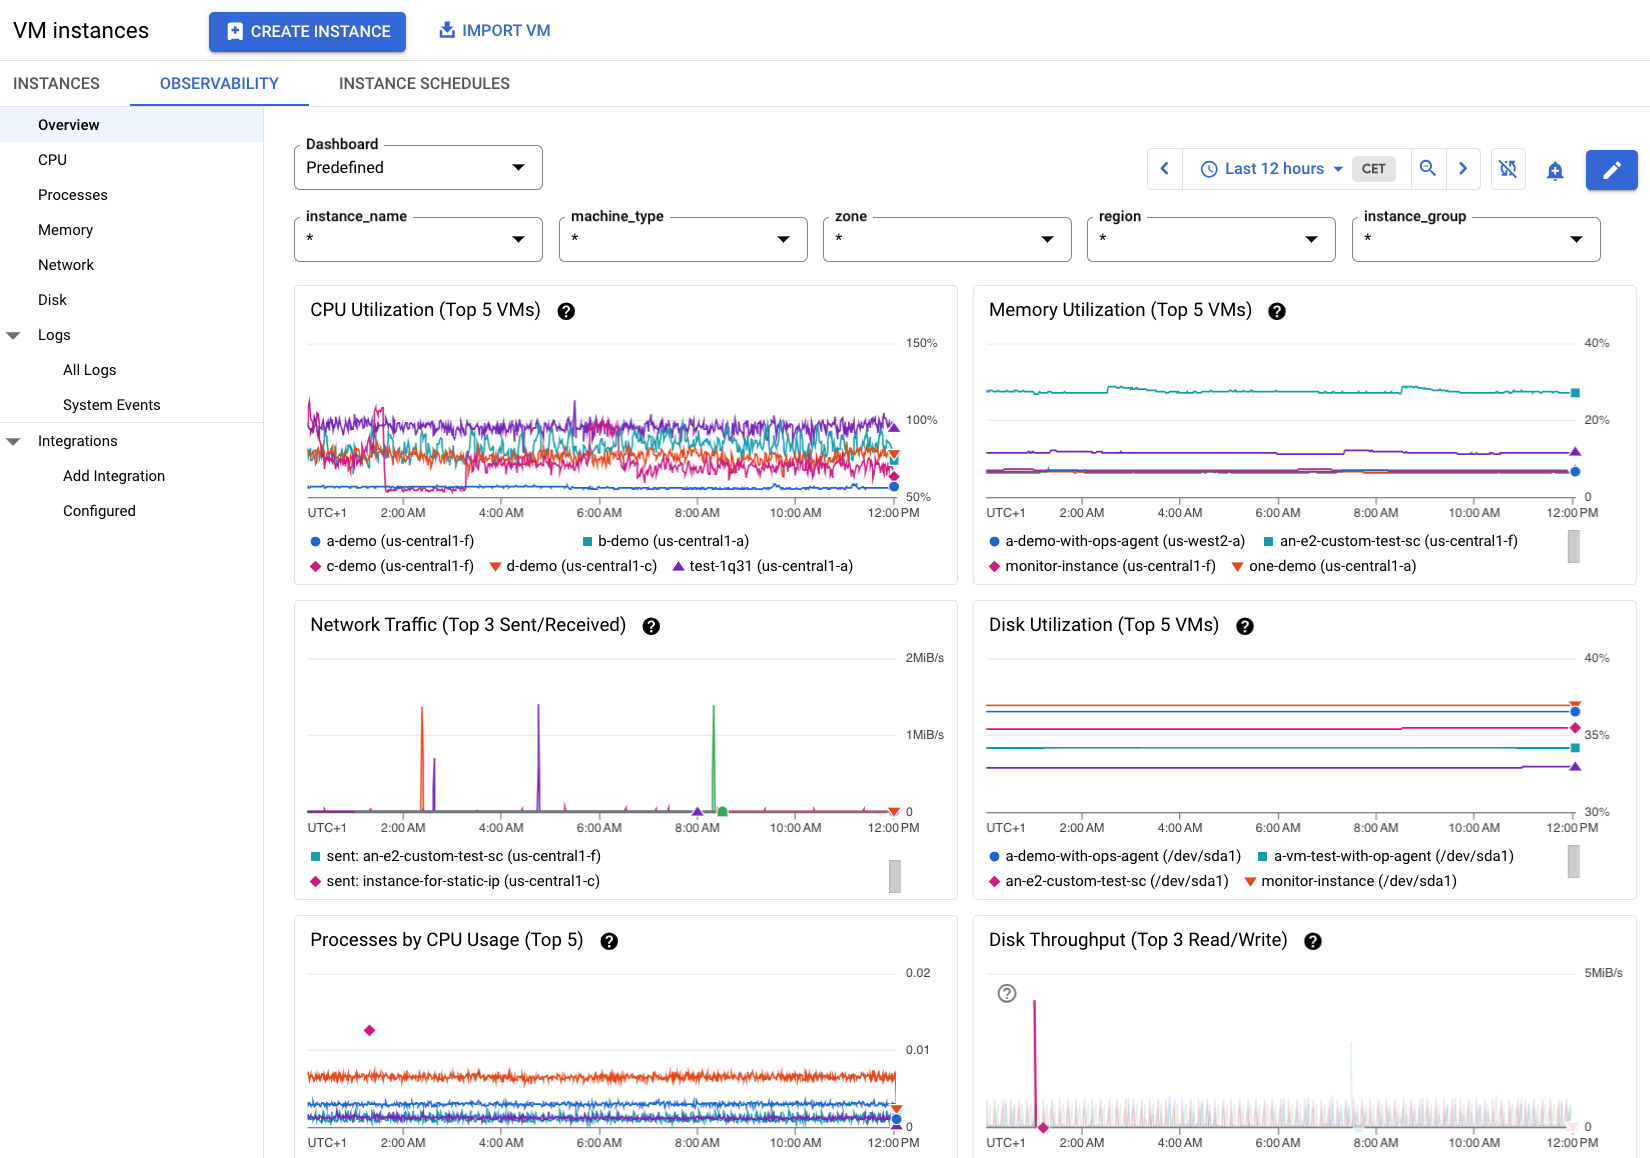
The information in Figure 2 displays an example of the Observability tab when multiple VMs in a project have the Ops Agent installed. Notice there are more metrics available about these VMs.
View detailed metrics for a VM
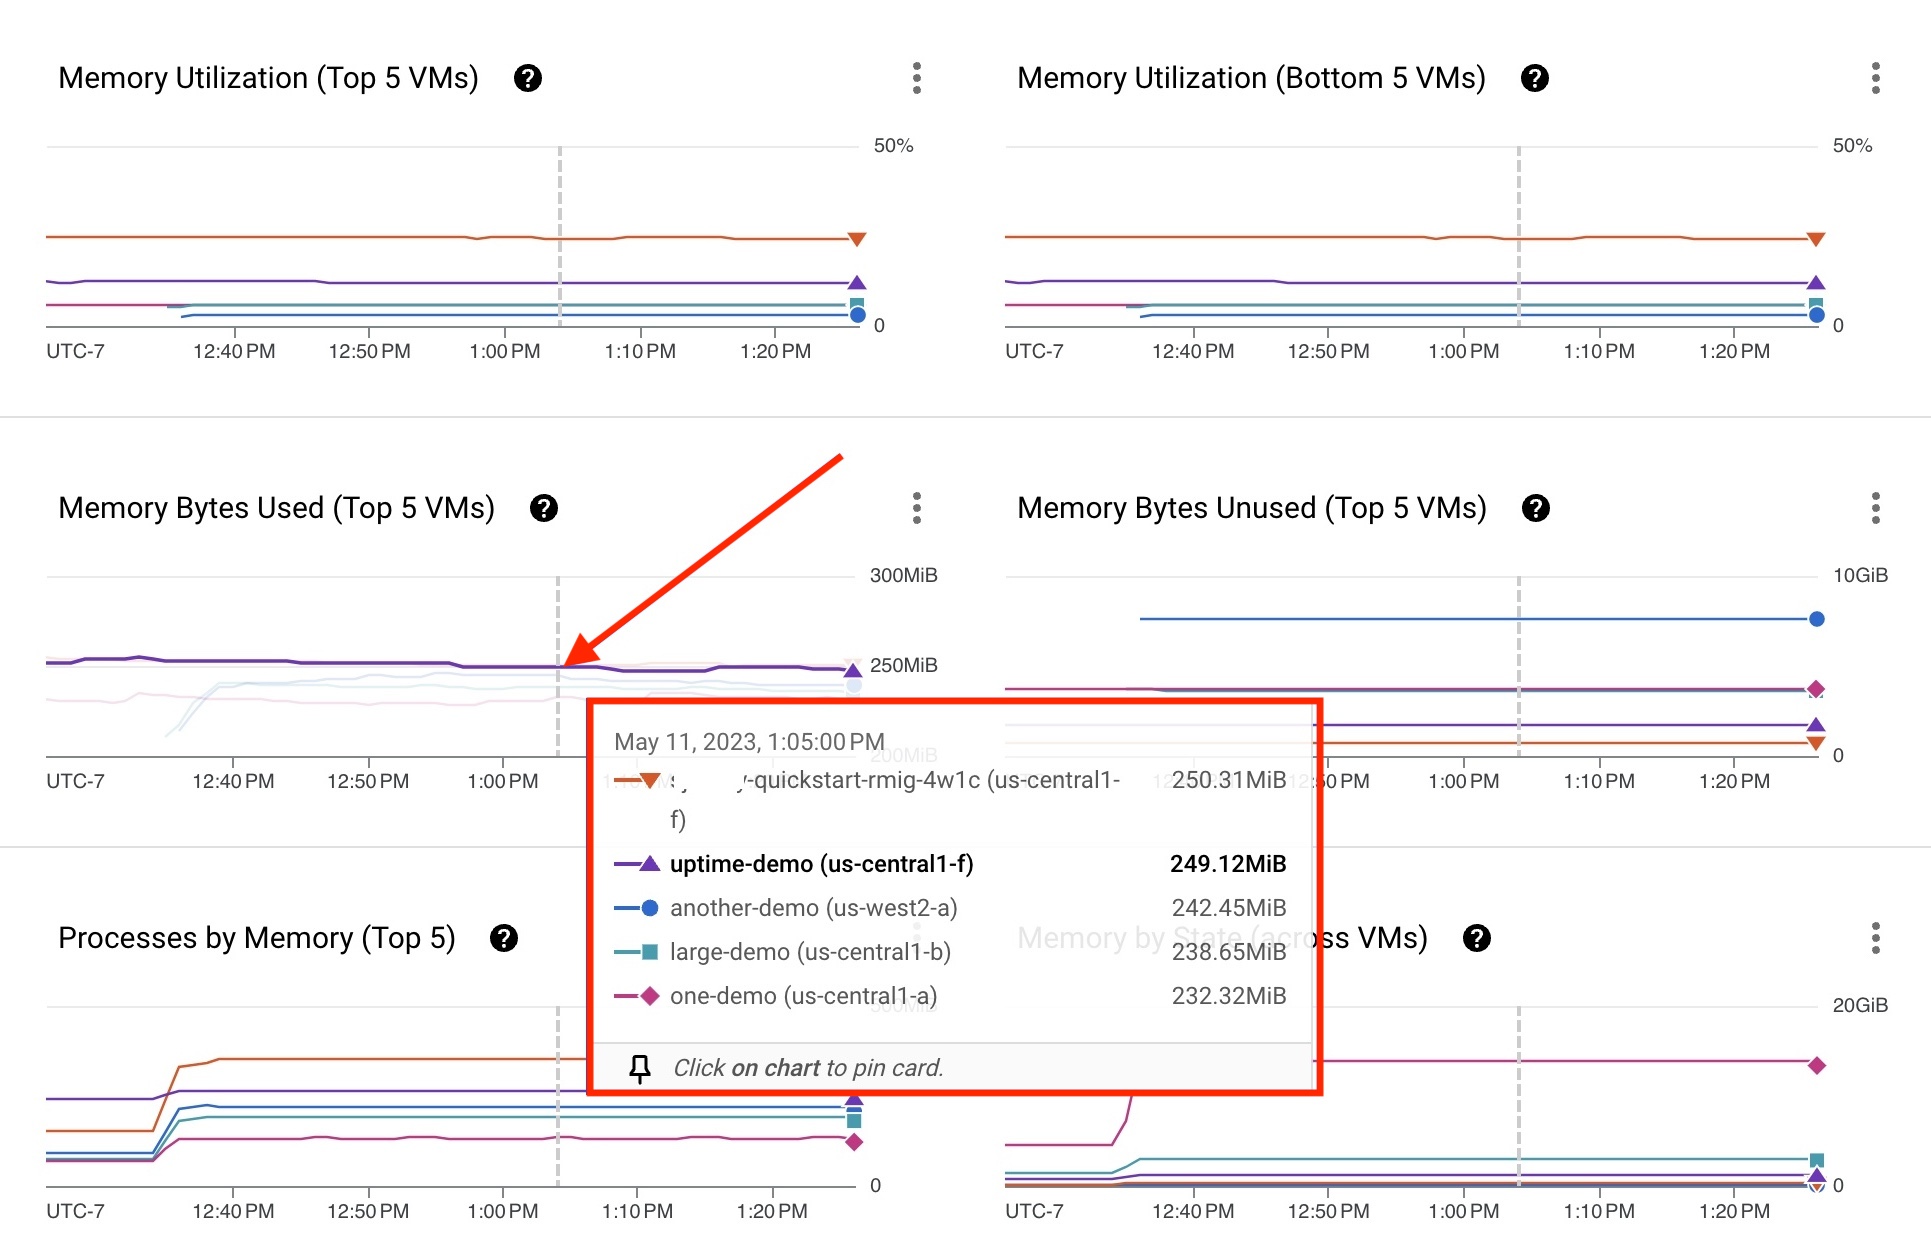
Each VM process metric is represented by a graph line on a chart. In the following example, the uptime-demo VM has the Ops Agent installed. Memory utilization data is available for troubleshooting purposes. If a VM is not listed on the card, filter by the VM name to find a specific VM.
To retrieve the information about this VM or another of the top five VMs from the Observability tab, do the following:
- Hold the pointer over the graph line of any VM. A card appears with a list of the top five VMs using the process, each displaying a metric.
- To learn more about the VM's behavior, click the VM graph line or a specific VM name on the list.
The uptime-demo VM displayed on the card in Figure 3 reveals some metrics that might require a review.
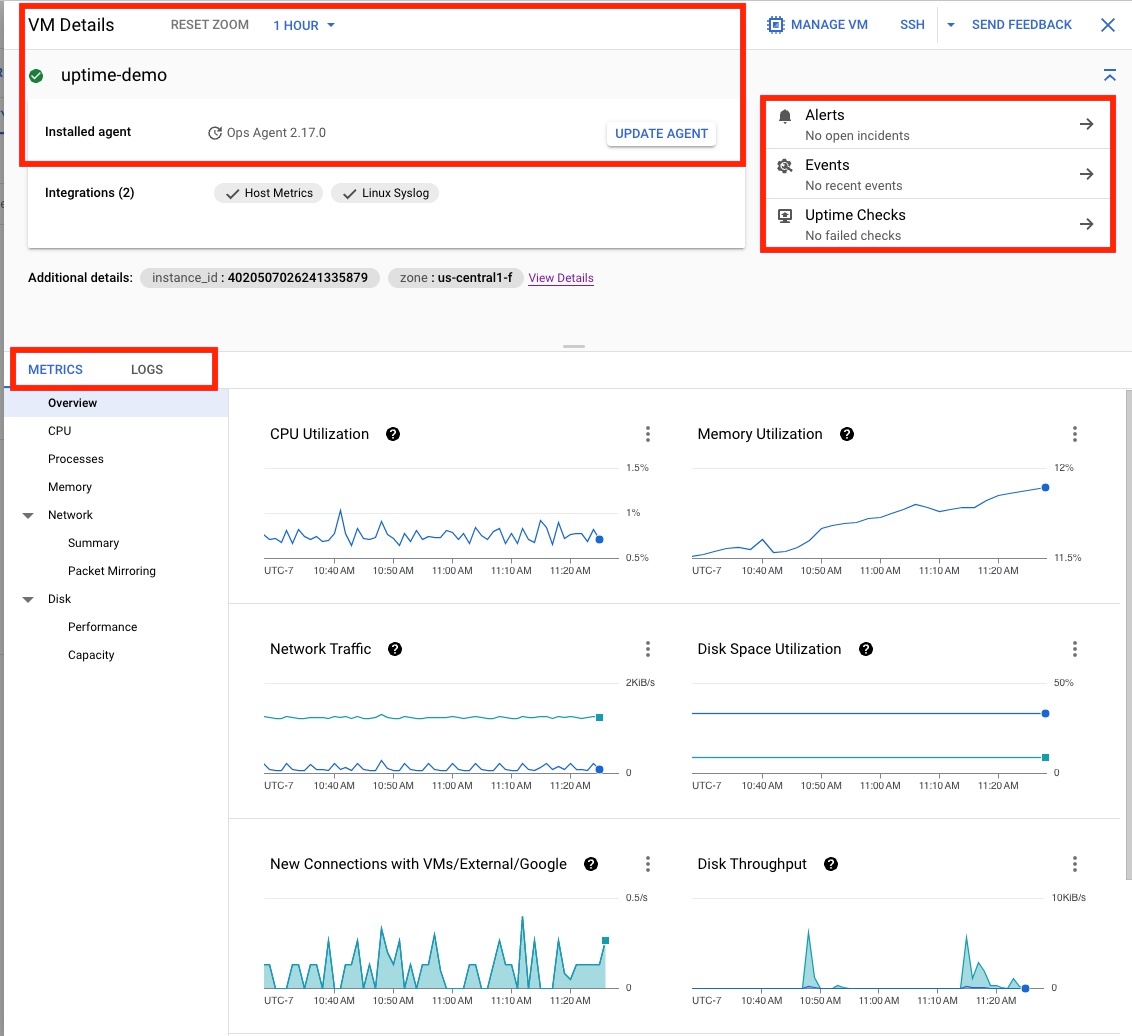
Click the uptime-demo VM to open the VM Details page displayed in Figure 4, which provides the following information:
- The Ops Agent status.
- The in-context options to create Alerts, check for Events, or create Uptime Checks.
- The option to view the details of the VM's configurations, metrics, and logs.
Create a customized dashboard to view specific metrics
By default, the Observability tab in Compute Engine provides a predefined dashboard that displays basic VM metrics. To view only the specific metrics that you want to see, you can modify the predefined dashboard and save it as a customized dashboard. You can customize the dashboard as you see fit.
To create a customized dashboard, do the following:
In the Google Cloud console, go to the VM instances page.
Go to the Observability tab as follows:
- For a single VM: In the VM instances page, click the VM name to open its Details page, and then click the Observability tab for that VM.
- For multiple VMs: In the VM instances page, click the Observability tab.
If the Dashboard drop-down is enabled, then customized dashboards are available. To modify a custom view, select a custom view from the drop-down, and then, in the dashboard toolbar, click .
Otherwise, to customize the predefined dashboard, in the dashboard toolbar, click .
Compute Engine creates a copy of the predefined dashboard, and then opens the copy in edit mode.
In the editor, you can add, modify, delete, reposition, or resize the visualizations in the dashboard. The visualizations are collectively called widgets. For more information about the different widget types, see Dashboards overview.
To add a widget, in the dashboard toolbar, click Add widget and complete the configuration.
For example, to view the logs with your metric data, click Add widget, select Logs, and then click Apply.
To modify a widget, place your pointer on the widget to activate the toolbar, click Edit widget, and then use the Configure widget dialog. To apply your changes to the dashboard, in the toolbar, click Apply. To discard your changes, click Cancel.
To delete a widget, place your pointer on the widget to activate the toolbar, click More chart options, and then select Delete.
To reposition a widget, use your pointer to drag the widget by its header to a new location.
To resize a widget, use your pointer to reposition the right-hand corner of the widget.
After you finish modifying the dashboard, click Save.
In the dialog confirming the changes, click View customized dashboard to go to the customized view.
You can switch back to the predefined view by selecting Predefined from the Dashboard drop-down.
Review resource metrics
To learn more about each resource metric, click each process within the Observability tab menu:
- Explore CPU, Processes, Memory utilization, Network traffic, and Disk utilization.
- View log data by searching Logs to identify and view System Events.
- Add third party Integrations and check for Configured existing integrations.
The rest of this section describes examples of how some processes might affect your workloads. This information assumes that the Ops Agent is installed on your VMs.
CPU utilization
An example of extreme CPU utilization might be when a server is under an unexpectedly heavy load, such as when a website experiences a sudden surge in traffic or when a large-scale data processing task is in progress. In such situations, the CPU might be running at 100% capacity for an extended period of time, which can cause the server to slow down or become unresponsive.
In this example, saturation is the concern. If your CPU utilization is at 100%, that might be fine for your workloads, but you might want to examine other metrics to learn if this requires intervention. In this case, you might want to create an alerting policy so you're notified when a VM's CPU utilization surges.
With proper permissions, you can connect using SSH to your VMs to investigate the problem. However, if the Ops Agent is installed, you can see more historical data to help you troubleshoot.
Process utilization
An example of extreme process behavior might be when a process is consuming an excessive amount of resources such as CPU, memory, or disk I/O, to the point where it's causing performance degradation or even crashes the VM.
For example, if a process running on a VM is experiencing a memory leak, it might start consuming increasingly large amounts of memory over time, eventually causing the VM to run out of memory and crash. Similarly, if a process is using the disk heavily, it can cause the VM's disk I/O to become saturated, leading to slow response times for other processes.
Memory utilization
Databases require a large amount of memory to perform operations like indexing, sorting, and joining tables.
An example of high memory usage on a VM is when you run a database server, such as Cloud SQL for MySQL or Cloud SQL for PostgreSQL, with a large dataset. If the available memory of your VM is too small, reloading a dataset into memory can cause the database to run slow or crash.
Network performance
Network performance issues are the result of different factors: congestion, bandwidth limitations, hardware or software issues, and latency. To diagnose the problem, monitor your network performance metrics, troubleshoot hardware and software issues, and analyze network traffic patterns to identify and solve the root cause of the issue.
Disk utilization
High disk utilization on a VM occurs when there is a great amount of data being read to or written from the virtual disk resulting in a delay in disk access and a possible effect on VM performance.
Monitoring disk utilization metrics like disk I/O operations per second (IOPS), disk queue length, and average disk response time can help identify and diagnose high disk utilization issues on a VM.
Check logs and system events
The All Logs page provides log data about your resources. Sort by severity to identify problems and inspect the payload.
Audit logs record administrative events that occur in your resources. The logs can tell you what happened to trigger the event. Multiple logs are recorded and maintained in the same row, so for example, if you have 20 identical logs, the information is stored in one row, rather than 20 separate rows.
You can think of System Events as an umbrella term for events that are occurring at a higher level, but might affect your Compute Engine resources. A system event occurs when an error unrelated to a planned event fires. System events are logged at the fleet level.
Use third party integrations
Monitoring provides integrations with third-party applications. These integrations let you collect telemetry from applications such as Apache Web Server, Cloud SQL for MySQL, Memorystore for Redis, and others for deployments running on Compute Engine and GKE. When you use Compute Engine, third-party telemetry is collected by the Ops Agent.