
این صفحه نحوه ایجاد انواع پیامها، حبابها، پینها و سایر گرافیکها را توضیح میدهد که میتوانند توسط URL درخواست شوند یا به عنوان نشانگر در بالای نمودارهای دیگر اضافه شوند.
فهرست مطالب
معرفی
Chart API شما را قادر میسازد تا انواع پیامها، پینها یا حبابهای جالبی ایجاد کنید که متن و تصاویر را با هم ترکیب میکنند. به این موارد آیکون های پویا می گویند. می توانید یک تصویر آیکون پویا مستقل ایجاد کنید یا می توانید یک نماد پویا را در بالای نمودار خود به عنوان یک نوع نشانگر با استفاده از پارامتر chem قرار دهید. این صفحه نحوه ایجاد آیکون های پویا را به عنوان تصاویر مستقل یا به عنوان نشانگر در نمودار دیگر توضیح می دهد. صفحه مرجع Infographics Dynamic Icons همه انواع نشانگرهای پویا موجود را شرح می دهد.
نحو ایجاد یک نماد پویا بستگی به این دارد که آیا شما یک نماد مستقل را می خواهید یا به عنوان یک نشانگر پویا در نمودار دیگری.
نمادهای مستقل
شما می توانید یک تصویر آیکون پویا را به همان روشی که هر یک از نمودارهای دیگر را درخواست می کنید درخواست کنید. یک نماد پویا مستقل از مجموعه پارامترهای متفاوتی نسبت به نمودارهای دیگر پشتیبانی می کند:
| پارامتر | الزامی یا اختیاری | شرح |
|---|---|---|
chst=< icon_string_constant > | ضروری | توضیح می دهد که چه نوع نمادی ایجاد شود.
|
chld=< icon_data > | ضروری | داده های خاصی که برای توصیف اندازه، چرخش، متن و سایر داده های مورد نیاز نماد استفاده می شود.
|
cht | استفاده نشده | نمودارهای نماد پویا مستقل از پارامتر cht استفاده نمی کنند. |
chs | استفاده نشده | نمودارهای نماد پویا مستقل از پارامتر chs استفاده نمی کنند. |
chd | استفاده نشده | از پارامتر chld برای ارسال داده به یک نماد پویا مستقل استفاده کنید. |
مثال

https://chart.googleapis.com/chart?chst=d_bubble_icon_text_small&chld=ski|bb|Wheeee!|FFFFFF|000000
نشانگرهای پویا
شما می توانید یک نماد پویا را به عنوان یک نوع نشانگر در چندین نوع مختلف نمودار با استفاده از پارامتر chem جاسازی کنید. برای یادگیری نحوه کار به مستندات chem مراجعه کنید.
مثال
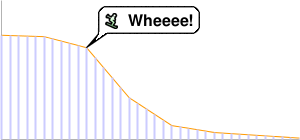
https://chart.googleapis.com/chart?
 chs=300x140
 cht=lc&chco=FF9900,224499
 chd=t:75,74,66,30,10,5,3,1
 chls=1|1
 chem=y;s=bubble_icon_text_small;d=ski,bb,Wheeee!,FFFFFF;dp=2;ds=0
 chm=v,ccccFF,0,::.2,2
ویژگی های رایج آیکون
بیشتر آیکون ها می توانند دارای رشته های متنی یا سایه های مرتبط با آنها باشند.
رشته های متنی
تمام متن های نمایشی ارسال شده به Chart API باید دارای کد UTF-8 و سپس کدگذاری URL باشند. این فقط بر نویسههای غیر ایمن URL تأثیر میگذارد (نویسههای ایمن URL عمدتاً حروف انگلیسی az بزرگ و کوچک هستند، به علاوه مجموعهای کوچک از علائم نگارشی). به عنوان مثال، UTF-8 و مقدار کدگذاری شده با URL برای حرف "è" " %C3%A8 " و برای کاراکتر چینی 駅 " %E9%A7%85 " است. اکثر مرورگرها به شما اجازه می دهند از یک مقدار رمزگذاری نشده در رشته URL استفاده کنید (به عنوان مثال، 駅) و آن را برای شما در پشت صحنه رمزگذاری می کنند. با این حال، ممکن است شخصی که URL نمودار شما را مشاهده میکند، از مرورگری استفاده میکند که این کار را انجام نمیدهد، بنابراین معمولاً بهترین کار این است که UTF-8 و URL-encode تمام کاراکترهای غیرASCII در رشتههای متنی انجام شود. توجه داشته باشید که این فقط برای متن نشان داده شده در حباب ها یا پین ها است، نه برای &، |، یا سایر کاراکترهایی که بخشی از نحو URL هستند.
هنگام استفاده از پارامتر chem برای تعیین نشانگرهای نماد پویا، باید از نویسههای خاصی در متن خود نیز فرار کنید، همانطور که در مستندات chem توضیح داده شده است.
سایه ها
می توانید به بسیاری از آیکون ها سایه اضافه کنید یا حتی برای برخی از آیکون ها بدون خود آیکون سایه بکشید!
آیکون های سایه دار 
بسیاری از این نمادها را می توان با یا بدون سایه ترسیم کرد. اگر shadowing یک گزینه باشد، نام نماد دارای نسخه ای است که به _withshadow ختم می شود و نسخه دیگری بدون پایان آن. بسته به اینکه سایه را میخواهید یا نه، میتوانید نمادی را با هر دو انتهای آن مشخص کنید.
در اینجا یک مثال از یک حباب متن متوسط و یک پین با و بدون سایه آورده شده است:
 chst=d_bubble_icon_text_big |  chst=d_bubble_icon_text_big_withshadow |
 chst=d_map_pin_icon |  chst=d_map_pin_icon_withshadow |
سایه های مستقل
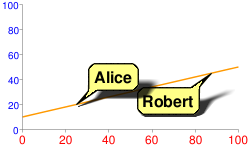
برخی از انواع آیکون ها به شما امکان می دهند سایه آنها را به تنهایی بکشید. اگر از چندین نماد سایهدار روی یک گرافیک استفاده میکنید و آنقدر نزدیک هستند که سایه یکی روی نماد دیگری میافتد، ممکن است بخواهید این کار را انجام دهید. برای مثال، در اینجا دو حباب سایه دار وجود دارد که ابتدا رابرت کشیده، سپس آلیس:
توجه داشته باشید که چگونه سایه آلیس تا حدودی رابرت را می پوشاند. برای رفع این مشکل، می توانید ابتدا سایه آلیس، سپس حباب رابرت و سپس آلیس بدون سایه را بکشید. شاید از نظر نور و سایه کاملاً واقع گرایانه نباشد، اما از پوشاندن یک حباب با سایه دیگری اجتناب می کند:
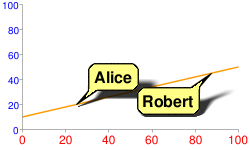
chem=
 y;s=bubble_text_small_shadow;d=bb,Alice,FF8,000;ds=0;dp=1;py=1          // Alice, no shadow
 y;s=bubble_text_small_withshadow;d=bbtr,Robert,FF8,000;ds=0;dp=3.5;py=1 // Robert with shadow
 y;s=bubble_text_small;d=bb,Alice,FF8,000;ds=0;dp=1;py=1                 // Alice shadow
همه نشانگرها همان z-order 1 را مشخص می کنند ( py=1 )، بنابراین به ترتیب فهرست شده در بالای عناصر نمودار (خط نمودار) رسم می شوند. ابتدا سایه آلیس کشیده می شود، سپس حباب رابرت در بالای آن و در نهایت حباب آلیس در بالا.
اسناد نوع نماد خاص خود را ببینید تا بدانید که آیا می توانید سایه آن را به تنهایی بکشید یا خیر.
نمادهای متنی

شما می توانید نمادی را مشخص کنید که رنگ، اندازه یا انباشته شدن آن با توجه به نقطه ای که به آن اختصاص داده شده است متفاوت باشد. این نوع نمادها فقط به عنوان نشانگرهای نماد پویا (پارامتر chem ) در دسترس هستند، نه به عنوان نمادهای مستقل.
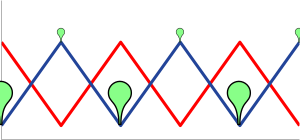
این نمادها را میتوان در مجموعهای غیر از سریهایی که رنگ، اندازه یا اطلاعات پشتهای آنها را مشخص میکند، رندر کرد. این بدان معناست که مقدار ds پارامتر chem سریهایی را که نماد را بر روی آن رندر میکند مشخص میکند، اما مقادیر تعیین اندازه یا رنگ نماد در پارامترهای زیر مشخص میشوند. یکی از کاربردهای خوب آن استفاده از سری داده های مخفی برای داده های نماد است، اما نمادها را در یک خط یا نوار قابل مشاهده ارائه کنید. در اینجا چند نمونه آورده شده است:
| نماد ارائه شده در سری منبع | نماد در سری های غیر منبع ارائه شده است | نماد با استفاده از سری های پنهان |
|---|---|---|
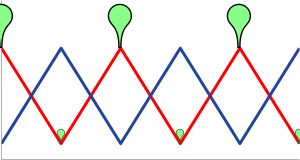 |  |  |
chem=
| chem=
| chd=t1:
|
انواع نشانگر زمینه
| نوع نشانگر | ارزش chem | مثال |
|---|---|---|
| تنوع رنگ | s=cm_color | 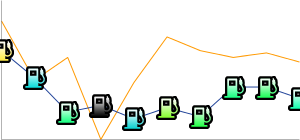 |
| تنوع سایز | s=cm_size | 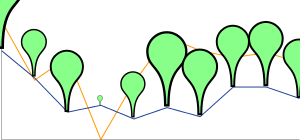 |
| تنوع رنگ و سایز | s=cm_color_size | 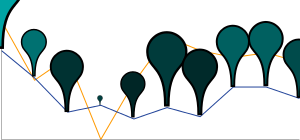 |
| تنوع انباشته شدن | s=cm_repeat | 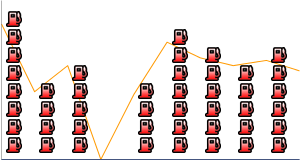 |
| چیدمان و تنوع رنگ | s=cm_repeat_color | 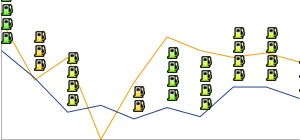 |
رشته های تراز برای نمادهای متنی
نمادهای متنی از یک رشته تراز اختیاری برای تعیین یک تراز و افست نماد به نقطه داده پشتیبانی می کنند. این رشته دارای نحو زیر است:
<alignment>[+/-<h_anchor_offset>+/-<v_anchor_offset>]
- هم ترازی
- دو حرف که تراز بودن نماد را به نقطه توصیف می کند. مثالها عبارتند از
tl(بالا سمت چپ) وrb(پایین سمت راست). برای فهرست و توضیحات کامل، به توضیح پارامتر alignment_string پارامترchemمراجعه کنید. - h_anchor_offset
- [ اختیاری ] انحراف افقی نقطه لنگر، بر حسب پیکسل. مقادیری از جمله صفر باید قبل از + یا - باشند. مهم: باید url-encode + را به صورت %2B انجام دهید.
- v_anchor_offset
- [ اختیاری ] افست عمودی نقطه لنگر، بر حسب پیکسل. مقادیری از جمله صفر باید قبل از + یا - باشند. مهم: باید url-encode + را به صورت %2B انجام دهید.
توجه داشته باشید که می توانید از کامپوننت of در پارامتر chem نیز برای تعیین افست های افقی و عمودی استفاده کنید. اگر هر دو مقدار of و h_anchor_offset v_anchor_offset را مشخص کنید، تمام افست ها روی نماد شما اعمال می شود.
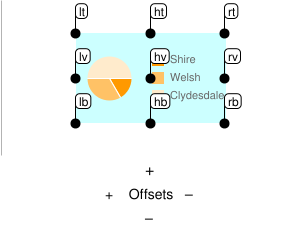
مثال ها:
 hb-0-0پایین مرکز افقی بدون افست |  lb-0-0پایین سمت چپ بدون افست |  rb-0-0سمت راست پایین بدون افست |  ht-0-0بالای افقی بدون افست |
 hb-20-0پایین مرکز افقی -20 افقی 0 عمودی |  hb%2b20-0پایین مرکز افقی +20 افقی 0 عمودی |  hb-0%2b10پایین مرکز افقی 0 افقی +10 عمودی |  hb-0-20پایین مرکز افقی 0 افقی -20 عمودی |
تنوع رنگ ( cm_color )
شما می توانید رنگ نشانگر نمودار زمینه ای را با توجه به نقطه ای که نشان می دهد تغییر دهید. شما باید یک محدوده رنگی را مشخص کنید، و مقدار داده به رنگ مربوطه در آن محدوده مقیاس می شود.
نحو
chem=y;s=cm_color;ds=<series_rendering_index>; ...other_values... ;
  d=<icon_shape>,<color_data_series>,<low_color>,<middle_color>,<high_color>,<icon_size>,<outline_color>,<alignment>
- < icon_shape >
- نماد مورد استفاده یک رشته شناسه شناسایی یکی از تصاویر فهرست شده در انتهای صفحه را مشخص کنید.
- < color_data_series >
- شاخص مبتنی بر صفر سری داده ها برای تغییر رنگ نمادها استفاده می شود.
- < کم_رنگ >
- مقدار کم رنگ در محدوده، به عنوان یک رنگ هگزادسیمال HTML سه یا شش رقمی (بدون علامت #). این با کمترین مقدار ممکن در محدوده داده های موجود همراه است.
- < وسط_رنگ >
- مقدار رنگ میانی در محدوده، به عنوان یک رنگ هگزادسیمال HTML سه یا شش رقمی (بدون علامت #). این با مقدار متوسط در محدوده داده های موجود مرتبط است.
- < high_color >
- مقدار رنگ بالا در محدوده، به عنوان یک رنگ هگزادسیمال HTML سه یا شش رقمی (بدون علامت #). این با بالاترین مقدار ممکن در محدوده داده های موجود همراه است.
- < icon_size >
- اندازه آیکون، بر حسب پیکسل. مقادیر زیر پشتیبانی می شوند: 12، 16، 24.
- < outline_color >
- رنگ طرح کلی نماد، به عنوان یک رنگ هگزادسیمال HTML سه یا شش رقمی (بدون علامت #).
- < تراز >
- یک رشته اختیاری که تراز و آفست نماد را توصیف می کند.
مثال
| 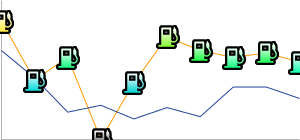 chem=y;s=cm_color; |
تغییر اندازه ( cm_size )
شما می توانید اندازه یک نشانگر نمودار متنی را به تنهایی با توجه به سری داده های انتخابی خود تغییر دهید.
نحو
chem=y;s=cm_size;ds=<series_rendering_index>; ...other_values... ;
  d=<icon_type>,<size_data_series>,<zero_value_size>,<size_multiplier>,<min_size>,<outline_color>,<fill_color>,<alignment>
- < icon_type >
- شکل نماد. یکی از مقادیر زیر را انتخاب کنید:
maps_pin،diskیاsquare. - < size_data_series >
- شاخص مبتنی بر صفر سری داده ها برای تغییر اندازه نمادها استفاده می شود.
- < zero_value_size >
- اندازه پایه نماد، در حداقل مقدار داده برای سری.
- < size_multiplier >
- یک فاکتور مقیاس بندی اندازه این مقدار در برابر تفاوت بین مقدار داده هر نماد و حداقل مقدار سری ضرب می شود تا اندازه نماد نهایی محاسبه شود. بنابراین، نمادی با مقدار داده 0 تحت تأثیر این ضریب قرار نخواهد گرفت.
- < اندازه_کم >
- حداقل اندازه برای هر نماد، بر حسب پیکسل.
- < outline_color >
- رنگ طرح کلی نماد، به عنوان یک رنگ هگزادسیمال HTML سه یا شش رقمی (بدون علامت #).
- < fill_color >
- رنگ پر کردن نماد، به عنوان یک رنگ هگزادسیمال HTML سه یا شش رقمی (بدون علامت #).
- < تراز >
- یک رشته اختیاری که تراز و آفست نماد را توصیف می کند.
مثال ها
| یک مثال اساسی نماد با مقدار صفر در اندازه مقدار صفر، که 30 پیکسل است، ارائه می شود. اندازه ها همراه با داده ها افزایش می یابد. | 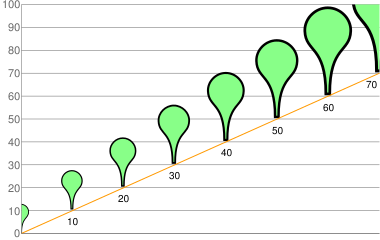 chd=t:0,10,20,30,40,50,60,70 |
در این مثال، آیکون ها داده های اندازه خود را از خط زرد می گیرند، اما در خط آبی نمایش داده می شوند.
|  chem=chem=y;s=cm_size;ds=1;dp=all;d=maps_pin,0,10,90,10,8F8,000,hb |
تنوع رنگ و اندازه ( cm_color_size )
شما می توانید رنگ و اندازه یک نشانگر نمودار متنی را با توجه به سری داده های انتخابی خود تغییر دهید.
نحو
chem=y;s=cm_color_size;ds=<series_rendering_index>; ...other_values... ;
  d=<icon_type>,<color_data_series>,<low_color>,<middle_color>,<high_color>,<size_data_series>,<zero_value_size>,<size_multiplier>,<min_size>,<outline_color>,<alignment>
- < icon_type >
- شکل نماد. یکی از مقادیر زیر را انتخاب کنید:
maps_pin،diskیاsquare. - < color_data_series >
- شاخص مبتنی بر صفر سری داده ها برای تغییر رنگ نمادها استفاده می شود.
- < کم_رنگ >
- مقدار کم رنگ در محدوده، به عنوان یک رنگ هگزادسیمال HTML سه یا شش رقمی (بدون علامت #). این با کمترین مقدار ممکن در محدوده داده های موجود همراه است.
- < وسط_رنگ >
- مقدار رنگ میانی در محدوده، به عنوان یک رنگ هگزادسیمال HTML سه یا شش رقمی (بدون علامت #). این با مقدار متوسط در محدوده داده های موجود مرتبط است.
- < high_color >
- مقدار رنگ بالا در محدوده، به عنوان یک رنگ هگزادسیمال HTML سه یا شش رقمی (بدون علامت #). این با بالاترین مقدار ممکن در محدوده داده های موجود همراه است.
- < size_data_series >
- شاخص مبتنی بر صفر سری داده ها برای تغییر اندازه نمادها استفاده می شود.
- < zero_value_size >
- اندازه پایه نماد، در حداقل مقدار داده برای سری.
- < size_multiplier >
- یک فاکتور مقیاس بندی اندازه این مقدار در برابر تفاوت بین مقدار داده هر نماد و حداقل مقدار سری ضرب می شود تا اندازه نماد نهایی محاسبه شود. بنابراین، نمادی با مقدار داده 0 تحت تأثیر این ضریب قرار نخواهد گرفت.
- < اندازه_کم >
- حداقل اندازه برای هر نماد، بر حسب پیکسل.
- < outline_color >
- رنگ طرح کلی نماد، به عنوان یک رنگ هگزادسیمال HTML سه یا شش رقمی (بدون علامت #).
- < تراز >
- یک رشته اختیاری که تراز و آفست نماد را توصیف می کند.
مثال ها
این مثال از دو خط استفاده می کند. پینها از دادههای رنگی از سریهایی که روی آنها رندر شدهاند استفاده میکنند، اما از دادههای اندازه سریهای دیگر استفاده میکنند.
|  chd=s:0akAZtnkmi,nbMPJOKXXS |
تنوع انباشته ( cm_repeat )
می توانید ارتفاع پشته ای از نمادها را با توجه به مقدار داده در یک نقطه خاص تغییر دهید.
نحو
chem=y;s=cm_repeat;ds=<series_rendering_index>; ...other_values... ;
  d=<icon_shape>,<repeat_series_index>,<scaling_factor>,<stacking_direction>,<icon_size>,<fill_color>,<outline_color>,<spacing>,<alignment>
- < icon_shape >
- نماد مورد استفاده یک رشته شناسه شناسایی یکی از تصاویر فهرست شده در انتهای صفحه را مشخص کنید.
- < repeat_series_index >
- شاخص مبتنی بر صفر سری داده ها برای محاسبه تعداد نمادهایی که در این نقطه قرار می گیرند استفاده می شود.
- < scaling_factor >
- مقدار سری داده منبع به مقداری از 0 تا 1 مقیاس می شود و در این مقدار ضرب می شود تا مشخص شود چه تعداد نشانگر باید در این نقطه قرار گیرد. مقادیر جزئی کوتاه شده اند.
- < stacking_direction >
- جهت انباشته شدن: یا "h" (حروف کوچک) برای افقی یا "V" (بزرگ) برای عمودی.
- < icon_size >
- اندازه هر نشانگر، بر حسب پیکسل. مقادیر زیر پشتیبانی می شوند: 12، 16، 24.
- < fill_color >
- رنگ پر کردن نماد، به عنوان یک رنگ هگزادسیمال HTML سه یا شش رقمی (بدون علامت #).
- < outline_color >
- رنگ طرح کلی نماد، به عنوان یک رنگ هگزادسیمال HTML سه یا شش رقمی (بدون علامت #).
- < فاصله >
- چه مقدار فضای بین هر نشانگر در یک پشته، بر حسب پیکسل.
- < تراز >
- یک رشته اختیاری که تراز و آفست نماد را توصیف می کند.
مثال
این مثال از یک سری داده ساختگی دوم استفاده می کند. در نمودار رندر نمی شود، اما به عنوان راهی برای فاصله گذاری یکنواخت بین پشته ها، از پایین نمودار استفاده می شود.
|  chd=s1:0akAZtnkmi,AAAAAAAAAA |
چیدمان و تنوع رنگ ( cm_repeat_color )
می توانید ارتفاع و رنگ پشته آیکون را با توجه به مقدار داده در یک نقطه خاص تغییر دهید.
نحو
chem=y;s=cm_repeat_color;ds=<series_rendering_index>; ...other_values... ;
  d=<icon_shape>,<repeat_series_index>,<scaling_factor>,<stacking_direction>,<icon_size>,<color_data_series>,<low_color>,<middle_color>,<high_color>,<outline_color>,<spacing>,<alignment>
- < icon_shape >
- نماد مورد استفاده یک رشته شناسه شناسایی یکی از تصاویر فهرست شده در انتهای صفحه را مشخص کنید.
- < repeat_series_index >
- شاخص مبتنی بر صفر سری داده ها برای محاسبه تعداد نمادهایی که در این نقطه قرار می گیرند استفاده می شود.
- < scaling_factor >
- مقدار سری داده منبع به مقداری از 0 تا 1 مقیاس می شود و در این مقدار ضرب می شود تا مشخص شود چه تعداد نشانگر باید در این نقطه قرار گیرد. مقادیر جزئی کوتاه شده اند.
- < stacking_direction >
- جهت انباشته شدن: یا "h" (حروف کوچک) برای افقی یا "V" (بزرگ) برای عمودی.
- < icon_size >
- اندازه هر نشانگر، بر حسب پیکسل. مقادیر زیر پشتیبانی می شوند: 12، 16، 24.
- < color_data_series >
- شاخص مبتنی بر صفر سری داده ها برای تغییر رنگ نمادها استفاده می شود.
- < کم_رنگ >
- مقدار کم رنگ در محدوده، به عنوان یک رنگ هگزادسیمال HTML سه یا شش رقمی (بدون علامت #). این با کمترین مقدار ممکن در محدوده داده های موجود همراه است.
- < وسط_رنگ >
- مقدار رنگ میانی در محدوده، به عنوان یک رنگ هگزادسیمال HTML سه یا شش رقمی (بدون علامت #). این با مقدار متوسط در محدوده داده های موجود مرتبط است.
- < high_color >
- مقدار رنگ بالا در محدوده، به عنوان یک رنگ هگزادسیمال HTML سه یا شش رقمی (بدون علامت #). این با بالاترین مقدار ممکن در محدوده داده های موجود همراه است.
- < outline_color >
- رنگ طرح کلی نماد، به عنوان یک رنگ هگزادسیمال HTML سه یا شش رقمی (بدون علامت #).
- < فاصله >
- چه مقدار فضای بین هر نشانگر در یک پشته، بر حسب پیکسل.
- < تراز >
- یک رشته اختیاری که تراز و آفست نماد را توصیف می کند.
مثال
| 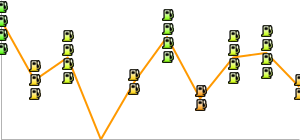 chem= |

این صفحه نحوه ایجاد انواع پیامها، حبابها، پینها و سایر گرافیکها را توضیح میدهد که میتوانند توسط URL درخواست شوند یا به عنوان نشانگر در بالای نمودارهای دیگر اضافه شوند.
فهرست مطالب
معرفی
Chart API شما را قادر میسازد تا انواع پیامها، پینها یا حبابهای جالبی ایجاد کنید که متن و تصاویر را با هم ترکیب میکنند. به این موارد آیکون های پویا می گویند. می توانید یک تصویر آیکون پویا مستقل ایجاد کنید یا می توانید یک نماد پویا را در بالای نمودار خود به عنوان یک نوع نشانگر با استفاده از پارامتر chem قرار دهید. این صفحه نحوه ایجاد آیکون های پویا را به عنوان تصاویر مستقل یا به عنوان نشانگر در نمودار دیگر توضیح می دهد. صفحه مرجع Infographics Dynamic Icons همه انواع نشانگرهای پویا موجود را شرح می دهد.
نحو ایجاد یک نماد پویا بستگی به این دارد که آیا شما یک نماد مستقل را می خواهید یا به عنوان یک نشانگر پویا در نمودار دیگری.
نمادهای مستقل
شما می توانید یک تصویر آیکون پویا را به همان روشی که هر یک از نمودارهای دیگر را درخواست می کنید درخواست کنید. یک نماد پویا مستقل از مجموعه پارامترهای متفاوتی نسبت به نمودارهای دیگر پشتیبانی می کند:
| پارامتر | الزامی یا اختیاری | شرح |
|---|---|---|
chst=< icon_string_constant > | ضروری | توضیح می دهد که چه نوع نمادی ایجاد شود.
|
chld=< icon_data > | ضروری | داده های خاصی که برای توصیف اندازه، چرخش، متن و سایر داده های مورد نیاز نماد استفاده می شود.
|
cht | استفاده نشده | نمودارهای نماد پویا مستقل از پارامتر cht استفاده نمی کنند. |
chs | استفاده نشده | نمودارهای نماد پویا مستقل از پارامتر chs استفاده نمی کنند. |
chd | استفاده نشده | از پارامتر chld برای ارسال داده به یک نماد پویا مستقل استفاده کنید. |
مثال

https://chart.googleapis.com/chart?chst=d_bubble_icon_text_small&chld=ski|bb|Wheeee!|FFFFFF|000000
نشانگرهای پویا
شما می توانید یک نماد پویا را به عنوان یک نوع نشانگر در چندین نوع مختلف نمودار با استفاده از پارامتر chem جاسازی کنید. برای یادگیری نحوه کار به مستندات chem مراجعه کنید.
مثال

https://chart.googleapis.com/chart?
 chs=300x140
 cht=lc&chco=FF9900,224499
 chd=t:75,74,66,30,10,5,3,1
 chls=1|1
 chem=y;s=bubble_icon_text_small;d=ski,bb,Wheeee!,FFFFFF;dp=2;ds=0
 chm=v,ccccFF,0,::.2,2
ویژگی های رایج آیکون
بیشتر آیکون ها می توانند دارای رشته های متنی یا سایه های مرتبط با آنها باشند.
رشته های متنی
تمام متن های نمایشی ارسال شده به Chart API باید دارای کد UTF-8 و سپس کدگذاری URL باشند. این فقط بر نویسههای غیر ایمن URL تأثیر میگذارد (نویسههای ایمن URL عمدتاً حروف انگلیسی az بزرگ و کوچک هستند، به علاوه مجموعهای کوچک از علائم نگارشی). به عنوان مثال، UTF-8 و مقدار کدگذاری شده با URL برای حرف "è" " %C3%A8 " و برای کاراکتر چینی 駅 " %E9%A7%85 " است. اکثر مرورگرها به شما اجازه می دهند از یک مقدار رمزگذاری نشده در رشته URL استفاده کنید (به عنوان مثال، 駅) و آن را برای شما در پشت صحنه رمزگذاری می کنند. با این حال، ممکن است شخصی که URL نمودار شما را مشاهده میکند، از مرورگری استفاده میکند که این کار را انجام نمیدهد، بنابراین معمولاً بهترین کار این است که UTF-8 و URL-encode تمام کاراکترهای غیرASCII در رشتههای متنی انجام شود. توجه داشته باشید که این فقط برای متن نشان داده شده در حباب ها یا پین ها است، نه برای &، |، یا سایر کاراکترهایی که بخشی از نحو URL هستند.
هنگام استفاده از پارامتر chem برای تعیین نشانگرهای نماد پویا، باید از نویسههای خاصی در متن خود نیز فرار کنید، همانطور که در مستندات chem توضیح داده شده است.
سایه ها
می توانید به بسیاری از آیکون ها سایه اضافه کنید یا حتی برای برخی از آیکون ها بدون خود آیکون سایه بکشید!
آیکون های سایه دار 
بسیاری از این نمادها را می توان با یا بدون سایه ترسیم کرد. اگر shadowing یک گزینه باشد، نام نماد دارای نسخه ای است که به _withshadow ختم می شود و نسخه دیگری بدون پایان آن. بسته به اینکه سایه را میخواهید یا نه، میتوانید نمادی را با هر دو انتهای آن مشخص کنید.
در اینجا یک مثال از یک حباب متن متوسط و یک پین با و بدون سایه آورده شده است:
 chst=d_bubble_icon_text_big |  chst=d_bubble_icon_text_big_withshadow |
 chst=d_map_pin_icon |  chst=d_map_pin_icon_withshadow |
سایه های مستقل
برخی از انواع آیکون ها به شما امکان می دهند سایه آنها را به تنهایی بکشید. اگر از چندین نماد سایهدار روی یک گرافیک استفاده میکنید و آنقدر نزدیک هستند که سایه یکی روی نماد دیگری میافتد، ممکن است بخواهید این کار را انجام دهید. برای مثال، در اینجا دو حباب سایه دار وجود دارد که ابتدا رابرت کشیده، سپس آلیس:

توجه داشته باشید که چگونه سایه آلیس تا حدودی رابرت را می پوشاند. برای رفع این مشکل، می توانید ابتدا سایه آلیس، سپس حباب رابرت و سپس آلیس بدون سایه را بکشید. شاید از نظر نور و سایه کاملاً واقع گرایانه نباشد، اما از پوشاندن یک حباب با سایه دیگری اجتناب می کند:

chem=
 y;s=bubble_text_small_shadow;d=bb,Alice,FF8,000;ds=0;dp=1;py=1          // Alice, no shadow
 y;s=bubble_text_small_withshadow;d=bbtr,Robert,FF8,000;ds=0;dp=3.5;py=1 // Robert with shadow
 y;s=bubble_text_small;d=bb,Alice,FF8,000;ds=0;dp=1;py=1                 // Alice shadow
همه نشانگرها همان z-order 1 را مشخص می کنند ( py=1 )، بنابراین به ترتیب فهرست شده در بالای عناصر نمودار (خط نمودار) رسم می شوند. ابتدا سایه آلیس کشیده می شود، سپس حباب رابرت در بالای آن و در نهایت حباب آلیس در بالا.
اسناد نوع نماد خاص خود را ببینید تا بدانید که آیا می توانید سایه آن را به تنهایی بکشید یا خیر.
نمادهای متنی

شما می توانید نمادی را مشخص کنید که رنگ، اندازه یا انباشته شدن آن با توجه به نقطه ای که به آن اختصاص داده شده است متفاوت باشد. این نوع نمادها فقط به عنوان نشانگرهای نماد پویا (پارامتر chem ) در دسترس هستند، نه به عنوان نمادهای مستقل.
این نمادها را میتوان در مجموعهای غیر از سریهایی که رنگ، اندازه یا اطلاعات پشتهای آنها را مشخص میکند، رندر کرد. این بدان معناست که مقدار ds پارامتر chem سریهایی را که نماد را بر روی آن رندر میکند مشخص میکند، اما مقادیر تعیین اندازه یا رنگ نماد در پارامترهای زیر مشخص میشوند. یکی از کاربردهای خوب آن استفاده از سری داده های مخفی برای داده های نماد است، اما نمادها را در یک خط یا نوار قابل مشاهده ارائه کنید. در اینجا چند نمونه آورده شده است:
| نماد ارائه شده در سری منبع | نماد در سری های غیر منبع ارائه شده است | نماد با استفاده از سری های پنهان |
|---|---|---|
 |  |  |
chem=
| chem=
| chd=t1:
|
انواع نشانگر زمینه
| نوع نشانگر | ارزش chem | مثال |
|---|---|---|
| تنوع رنگ | s=cm_color |  |
| تنوع سایز | s=cm_size |  |
| تنوع رنگ و سایز | s=cm_color_size |  |
| تنوع انباشته شدن | s=cm_repeat |  |
| چیدمان و تنوع رنگ | s=cm_repeat_color |  |
رشته های تراز برای نمادهای متنی
نمادهای متنی از یک رشته تراز اختیاری برای تعیین یک تراز و افست نماد به نقطه داده پشتیبانی می کنند. این رشته دارای نحو زیر است:
<alignment>[+/-<h_anchor_offset>+/-<v_anchor_offset>]
- هم ترازی
- دو حرف که تراز بودن نماد را به نقطه توصیف می کند. مثالها عبارتند از
tl(بالا سمت چپ) وrb(پایین سمت راست). See the alignment_string parameter description of thechemparameter for a complete listing and description. - h_anchor_offset
- [ Optional ] The horizontal offset of the anchor point, in pixels. Values including zero must be preceded by either + or -. Important: You must url-encode + as %2B.
- v_anchor_offset
- [ Optional ] The vertical offset of the anchor point, in pixels. Values including zero must be preceded by either + or -. Important: You must url-encode + as %2B.
Note that you can also use the of component of the chem parameter to specify horizontal and vertical offsets. If you specify both the of component and h_anchor_offset v_anchor_offset values, all offsets will be applied to your icon.

مثال ها:
 hb-0-0Horizontal center bottom No offsets |  lb-0-0Bottom left No offsets |  rb-0-0Bottom right No offsets |  ht-0-0Horizontal top No offsets |
 hb-20-0Horizontal center bottom -20 horizontal 0 vertical |  hb%2b20-0Horizontal center bottom +20 horizontal 0 vertical |  hb-0%2b10Horizontal center bottom 0 horizontal +10 vertical |  hb-0-20Horizontal center bottom 0 horizontal -20 vertical |
Color Variation ( cm_color )
You can vary the color of a contextual chart marker according to the point that it represents. You must specify a color range, and the data value will be scaled to a corresponding color within that range.
نحو
chem=y;s=cm_color;ds=<series_rendering_index>; ...other_values... ;
  d=<icon_shape>,<color_data_series>,<low_color>,<middle_color>,<high_color>,<icon_size>,<outline_color>,<alignment>
- < icon_shape >
- The icon to use. Specify an ID string identifying one of the images listed at the end of the page .
- < color_data_series >
- The zero-based index of the data series used to vary the color of the icons.
- < low_color >
- The low color value in the range, as a three- or six-digit HTML hexadecimal color (no # mark). This is associated with the lowest possible value in the available data range.
- < middle_color >
- The middle color value in the range, as a three- or six-digit HTML hexadecimal color (no # mark). This is associated with the middle value in the available data range.
- < high_color >
- The high color value in the range, as a three- or six-digit HTML hexadecimal color (no # mark). This is associated with the highest possible value in the available data range.
- < icon_size >
- The size of the icon, in pixels. The following values are supported: 12, 16, 24.
- < outline_color >
- The outline color for the icon, as a three- or six-digit HTML hexadecimal color (no # mark).
- < alignment >
- An optional string describing the icon alignment and offset.
Example
|  chem=y;s=cm_color; |
Size Variation ( cm_size )
You can vary the size alone of a contextual chart marker, according to the data series of your choice.
نحو
chem=y;s=cm_size;ds=<series_rendering_index>; ...other_values... ;
  d=<icon_type>,<size_data_series>,<zero_value_size>,<size_multiplier>,<min_size>,<outline_color>,<fill_color>,<alignment>
- < icon_type >
- The shape of the icon. Choose one of the following values:
maps_pin,disk, orsquare. - < size_data_series >
- The zero-based index of the data series used to vary the size of the icons.
- < zero_value_size >
- The base size of the icon, at the minimum data value for the series.
- < size_multiplier >
- A size scaling factor. This value is multiplied against the difference between each icon's data value and the minimum series value, to calculate the final icon size. Therefore, an icon at the 0 data value will not be affected by this multiplier.
- < min_size >
- The minimum size for any icon, in pixels.
- < outline_color >
- The outline color for the icon, as a three- or six-digit HTML hexadecimal color (no # mark).
- < fill_color >
- The fill color for the icon, as a three- or six-digit HTML hexadecimal color (no # mark).
- < alignment >
- An optional string describing the icon alignment and offset.
مثال ها
| A basic example. The icon with zero value is rendered at the zero value size, which is 30 pixels. Sizes increase along with the data. |  chd=t:0,10,20,30,40,50,60,70 |
In this example, the icons take their size data from the yellow line, but are rendered on the blue line.
|  chem=chem=y;s=cm_size;ds=1;dp=all;d=maps_pin,0,10,90,10,8F8,000,hb |
Color and Size Variation ( cm_color_size )
You can vary both color and size of a contextual chart marker, according to the data series of your choice.
نحو
chem=y;s=cm_color_size;ds=<series_rendering_index>; ...other_values... ;
  d=<icon_type>,<color_data_series>,<low_color>,<middle_color>,<high_color>,<size_data_series>,<zero_value_size>,<size_multiplier>,<min_size>,<outline_color>,<alignment>
- < icon_type >
- The shape of the icon. Choose one of the following values:
maps_pin,disk, orsquare. - < color_data_series >
- The zero-based index of the data series used to vary the color of the icons.
- < low_color >
- The low color value in the range, as a three- or six-digit HTML hexadecimal color (no # mark). This is associated with the lowest possible value in the available data range.
- < middle_color >
- The middle color value in the range, as a three- or six-digit HTML hexadecimal color (no # mark). This is associated with the middle value in the available data range.
- < high_color >
- The high color value in the range, as a three- or six-digit HTML hexadecimal color (no # mark). This is associated with the highest possible value in the available data range.
- < size_data_series >
- The zero-based index of the data series used to vary the size of the icons.
- < zero_value_size >
- The base size of the icon, at the minimum data value for the series.
- < size_multiplier >
- A size scaling factor. This value is multiplied against the difference between each icon's data value and the minimum series value, to calculate the final icon size. Therefore, an icon at the 0 data value will not be affected by this multiplier.
- < min_size >
- The minimum size for any icon, in pixels.
- < outline_color >
- The outline color for the icon, as a three- or six-digit HTML hexadecimal color (no # mark).
- < alignment >
- An optional string describing the icon alignment and offset.
مثال ها
This example uses two lines. The pins use color data from the series on which they're rendered, but use size data from the other series.
|  chd=s:0akAZtnkmi,nbMPJOKXXS |
Stacking Variation ( cm_repeat )
You can vary the height of a stack of icons according to the data value at a specific point.
نحو
chem=y;s=cm_repeat;ds=<series_rendering_index>; ...other_values... ;
  d=<icon_shape>,<repeat_series_index>,<scaling_factor>,<stacking_direction>,<icon_size>,<fill_color>,<outline_color>,<spacing>,<alignment>
- < icon_shape >
- The icon to use. Specify an ID string identifying one of the images listed at the end of the page .
- < repeat_series_index >
- The zero-based index of the data series used to calculate how many icons to place at this point.
- < scaling_factor >
- The source data series value is scaled to a value from 0 to 1 and multiplied by this value to determine how many markers to place on this point. Partial values are truncated.
- < stacking_direction >
- Stacking direction: either "h" (lowercase) for horizontal or "V" (uppercase) for vertical.
- < icon_size >
- The size of each marker, in pixels. The following values are supported: 12, 16, 24.
- < fill_color >
- The fill color for the icon, as a three- or six-digit HTML hexadecimal color (no # mark).
- < outline_color >
- The outline color for the icon, as a three- or six-digit HTML hexadecimal color (no # mark).
- < spacing >
- How much space to put between each marker in a stack, in pixels.
- < alignment >
- An optional string describing the icon alignment and offset.
Example
This example uses a second dummy data series. It is not rendered on the chart, but used as a way to space all the stacks evenly, starting at the bottom of the chart.
|  chd=s1:0akAZtnkmi,AAAAAAAAAA |
Stacking and Color Variation ( cm_repeat_color )
You can vary the both the height and color of an icon stack, according to the data value at a specific point.
نحو
chem=y;s=cm_repeat_color;ds=<series_rendering_index>; ...other_values... ;
  d=<icon_shape>,<repeat_series_index>,<scaling_factor>,<stacking_direction>,<icon_size>,<color_data_series>,<low_color>,<middle_color>,<high_color>,<outline_color>,<spacing>,<alignment>
- < icon_shape >
- The icon to use. Specify an ID string identifying one of the images listed at the end of the page .
- < repeat_series_index >
- The zero-based index of the data series used to calculate how many icons to place at this point.
- < scaling_factor >
- The source data series value is scaled to a value from 0 to 1 and multiplied by this value to determine how many markers to place on this point. Partial values are truncated.
- < stacking_direction >
- Stacking direction: either "h" (lowercase) for horizontal or "V" (uppercase) for vertical.
- < icon_size >
- The size of each marker, in pixels. The following values are supported: 12, 16, 24.
- < color_data_series >
- The zero-based index of the data series used to vary the color of the icons.
- < low_color >
- The low color value in the range, as a three- or six-digit HTML hexadecimal color (no # mark). This is associated with the lowest possible value in the available data range.
- < middle_color >
- The middle color value in the range, as a three- or six-digit HTML hexadecimal color (no # mark). This is associated with the middle value in the available data range.
- < high_color >
- The high color value in the range, as a three- or six-digit HTML hexadecimal color (no # mark). This is associated with the highest possible value in the available data range.
- < outline_color >
- The outline color for the icon, as a three- or six-digit HTML hexadecimal color (no # mark).
- < spacing >
- How much space to put between each marker in a stack, in pixels.
- < alignment >
- An optional string describing the icon alignment and offset.
Example
|  chem= |

This page describes how to create a variety of callouts, bubbles, pins, and other graphics that can be requested by URL, or added as markers on top of other charts.
Table of Contents
معرفی
The Chart API enables you to create a variety of interesting callouts, pins, or bubbles that mix text and images. These items are called dynamic icons . You can either create a freestanding dynamic icon image, or you can position a dynamic icon on top of your chart as a marker type using the chem parameter. This page will describe how to create dynamic icons as either freestanding images or as markers on another chart. The Infographics Dynamic Icons reference page describes all the types of dynamic marker types available.
The syntax for creating a dynamic icon depends on whether you want a freestanding icon, or as a dynamic marker in another chart.
Freestanding Icons
You can request a dynamic icon image the same way you request any of the other charts. A freestanding dynamic icon supports a different set of parameters than other charts do:
| پارامتر | الزامی یا اختیاری | شرح |
|---|---|---|
chst=< icon_string_constant > | ضروری | Describes which kind of icon to create.
|
chld=< icon_data > | ضروری | The specific data used to describe the icon's size, rotation, text, and other required data.
|
cht | استفاده نشده | Freestanding dynamic icon charts don't use the cht parameter. |
chs | استفاده نشده | Freestanding dynamic icon charts don't use the chs parameter. |
chd | استفاده نشده | Use the chld parameter to pass data to a freestanding dynamic icon. |
Example

https://chart.googleapis.com/chart?chst=d_bubble_icon_text_small&chld=ski|bb|Wheeee!|FFFFFF|000000
Dynamic Markers
You can embed a dynamic icon as a marker type on several different types of charts using the chem parameter. See the chem documentation to learn how.
Example

https://chart.googleapis.com/chart?
 chs=300x140
 cht=lc&chco=FF9900,224499
 chd=t:75,74,66,30,10,5,3,1
 chls=1|1
 chem=y;s=bubble_icon_text_small;d=ski,bb,Wheeee!,FFFFFF;dp=2;ds=0
 chm=v,ccccFF,0,::.2,2
Common Icon Features
Most icons can have text strings or shadows associated with them.
Text Strings
All display text passed to the Chart API must be UTF-8 encoded and then URL-encoded. This affects only non-URL-safe characters (URL-safe characters are mostly the English letters az both upper and lower case, plus plus a small set of punctuation). For example, the UTF-8 and URL-encoded value for the letter "è" is " %C3%A8 ", and for the Chinese character 駅 is " %E9%A7%85 ". Most browsers will let you use an unencoded value in the URL string (for example, 駅) and will encode it for you behind the scenes. However, it is possible that someone viewing your chart URL is using a browser that doesn't do this, so it is usually best to UTF-8 and URL-encode all non-ASCII characters in text strings. Note that this is only for the text shown in bubbles or pins, not for the &, |, or other characters that are part of the URL syntax.
When using the chem parameter to specify dynamic icon markers, you must also escape certain characters in your text, as described in the chem documentation.
Shadows
You can add shadows to many icons, or even draw shadows for some icons without the icon itself!
Shadowed Icons 
Many of these icons can be drawn with or without shadows. If shadowing is an option, the icon name will have a version that ends in _withshadow and another version without that ending. You can specify an icon with either ending, depending on whether you want the shadow or not.
Here's an example of a medium text bubble and a pin with and without shadows:
 chst=d_bubble_icon_text_big |  chst=d_bubble_icon_text_big_withshadow |
 chst=d_map_pin_icon |  chst=d_map_pin_icon_withshadow |
Freestanding Shadows
Some icon types allow you to draw their shadow by itself. You might want to do this if you are using several overlapping shadowed icons on a graphic, and they are so close that the shadow from one falls across another icon. For example, here is two shadowed bubbles, Robert drawn first, then Alice:

Note how Alice's shadow partially covers Robert. To fix this, you can draw the Alice shadow first, then the Robert bubble, then Alice without a shadow. Perhaps not totally realistic in terms of lighting and shadows, but it avoids obscuring one bubble with the shadow of another:

chem=
 y;s=bubble_text_small_shadow;d=bb,Alice,FF8,000;ds=0;dp=1;py=1          // Alice, no shadow
 y;s=bubble_text_small_withshadow;d=bbtr,Robert,FF8,000;ds=0;dp=3.5;py=1 // Robert with shadow
 y;s=bubble_text_small;d=bb,Alice,FF8,000;ds=0;dp=1;py=1                 // Alice shadow
All markers specify the same z-order of 1 ( py=1 ), so they are drawn in the order listed, on top of the chart elements (the chart line). First the Alice shadow is drawn, then the Robert bubble on top of that, and finally the Alice bubble on top.
See the documentation of your specific icon type to learn whether you can draw its shadow alone.
Contextual Icons

You can specify an icon that varies its color, size, or stacking according to the point they are assigned to. These icon types are available as dynamic icon markers only ( chem parameter), not as freestanding icons.
These icons can be rendered on a series other than the series that specifies their color, size, or stacking information. This means that the chem parameter's ds value specifies the series on which to render the icon, but the values for determining the size or color of the icon are specified in the parameters given below. One good use of this is to use a hidden data series for icon data, but render the icons on a visible line or bar. Here are some examples:
| Icon rendered on source series | Icon rendered on non-source series | Icon using hidden series |
|---|---|---|
 |  |  |
chem=
| chem=
| chd=t1:
|
Context Marker Types
| Marker Type | chem s Value | Example |
|---|---|---|
| Color variation | s=cm_color |  |
| Size variation | s=cm_size |  |
| Color and size variation | s=cm_color_size |  |
| Stacking variation | s=cm_repeat |  |
| Stacking and color variation | s=cm_repeat_color |  |
Alignment Strings for Contextual Icons
The contextual icons support an optional alignment string to specify an alignment and offset of the icon to the data point. This string has the following syntax:
<alignment>[+/-<h_anchor_offset>+/-<v_anchor_offset>]
- alignment
- Two letters describing the alignment of the icon to the point. Examples include
tl(top left), andrb(bottom right). See the alignment_string parameter description of thechemparameter for a complete listing and description. - h_anchor_offset
- [ Optional ] The horizontal offset of the anchor point, in pixels. Values including zero must be preceded by either + or -. Important: You must url-encode + as %2B.
- v_anchor_offset
- [ Optional ] The vertical offset of the anchor point, in pixels. Values including zero must be preceded by either + or -. Important: You must url-encode + as %2B.
Note that you can also use the of component of the chem parameter to specify horizontal and vertical offsets. If you specify both the of component and h_anchor_offset v_anchor_offset values, all offsets will be applied to your icon.

مثال ها:
 hb-0-0Horizontal center bottom No offsets |  lb-0-0Bottom left No offsets |  rb-0-0Bottom right No offsets |  ht-0-0Horizontal top No offsets |
 hb-20-0Horizontal center bottom -20 horizontal 0 vertical |  hb%2b20-0Horizontal center bottom +20 horizontal 0 vertical |  hb-0%2b10Horizontal center bottom 0 horizontal +10 vertical |  hb-0-20Horizontal center bottom 0 horizontal -20 vertical |
Color Variation ( cm_color )
You can vary the color of a contextual chart marker according to the point that it represents. You must specify a color range, and the data value will be scaled to a corresponding color within that range.
نحو
chem=y;s=cm_color;ds=<series_rendering_index>; ...other_values... ;
  d=<icon_shape>,<color_data_series>,<low_color>,<middle_color>,<high_color>,<icon_size>,<outline_color>,<alignment>
- < icon_shape >
- The icon to use. Specify an ID string identifying one of the images listed at the end of the page .
- < color_data_series >
- The zero-based index of the data series used to vary the color of the icons.
- < low_color >
- The low color value in the range, as a three- or six-digit HTML hexadecimal color (no # mark). This is associated with the lowest possible value in the available data range.
- < middle_color >
- The middle color value in the range, as a three- or six-digit HTML hexadecimal color (no # mark). This is associated with the middle value in the available data range.
- < high_color >
- The high color value in the range, as a three- or six-digit HTML hexadecimal color (no # mark). This is associated with the highest possible value in the available data range.
- < icon_size >
- The size of the icon, in pixels. The following values are supported: 12, 16, 24.
- < outline_color >
- The outline color for the icon, as a three- or six-digit HTML hexadecimal color (no # mark).
- < alignment >
- An optional string describing the icon alignment and offset.
Example
|  chem=y;s=cm_color; |
Size Variation ( cm_size )
You can vary the size alone of a contextual chart marker, according to the data series of your choice.
نحو
chem=y;s=cm_size;ds=<series_rendering_index>; ...other_values... ;
  d=<icon_type>,<size_data_series>,<zero_value_size>,<size_multiplier>,<min_size>,<outline_color>,<fill_color>,<alignment>
- < icon_type >
- The shape of the icon. Choose one of the following values:
maps_pin,disk, orsquare. - < size_data_series >
- The zero-based index of the data series used to vary the size of the icons.
- < zero_value_size >
- The base size of the icon, at the minimum data value for the series.
- < size_multiplier >
- A size scaling factor. This value is multiplied against the difference between each icon's data value and the minimum series value, to calculate the final icon size. Therefore, an icon at the 0 data value will not be affected by this multiplier.
- < min_size >
- The minimum size for any icon, in pixels.
- < outline_color >
- The outline color for the icon, as a three- or six-digit HTML hexadecimal color (no # mark).
- < fill_color >
- The fill color for the icon, as a three- or six-digit HTML hexadecimal color (no # mark).
- < alignment >
- An optional string describing the icon alignment and offset.
مثال ها
| A basic example. The icon with zero value is rendered at the zero value size, which is 30 pixels. Sizes increase along with the data. |  chd=t:0,10,20,30,40,50,60,70 |
In this example, the icons take their size data from the yellow line, but are rendered on the blue line.
|  chem=chem=y;s=cm_size;ds=1;dp=all;d=maps_pin,0,10,90,10,8F8,000,hb |
Color and Size Variation ( cm_color_size )
You can vary both color and size of a contextual chart marker, according to the data series of your choice.
نحو
chem=y;s=cm_color_size;ds=<series_rendering_index>; ...other_values... ;
  d=<icon_type>,<color_data_series>,<low_color>,<middle_color>,<high_color>,<size_data_series>,<zero_value_size>,<size_multiplier>,<min_size>,<outline_color>,<alignment>
- < icon_type >
- The shape of the icon. Choose one of the following values:
maps_pin,disk, orsquare. - < color_data_series >
- The zero-based index of the data series used to vary the color of the icons.
- < low_color >
- The low color value in the range, as a three- or six-digit HTML hexadecimal color (no # mark). This is associated with the lowest possible value in the available data range.
- < middle_color >
- The middle color value in the range, as a three- or six-digit HTML hexadecimal color (no # mark). This is associated with the middle value in the available data range.
- < high_color >
- The high color value in the range, as a three- or six-digit HTML hexadecimal color (no # mark). This is associated with the highest possible value in the available data range.
- < size_data_series >
- The zero-based index of the data series used to vary the size of the icons.
- < zero_value_size >
- The base size of the icon, at the minimum data value for the series.
- < size_multiplier >
- A size scaling factor. This value is multiplied against the difference between each icon's data value and the minimum series value, to calculate the final icon size. Therefore, an icon at the 0 data value will not be affected by this multiplier.
- < min_size >
- The minimum size for any icon, in pixels.
- < outline_color >
- The outline color for the icon, as a three- or six-digit HTML hexadecimal color (no # mark).
- < alignment >
- An optional string describing the icon alignment and offset.
مثال ها
This example uses two lines. The pins use color data from the series on which they're rendered, but use size data from the other series.
|  chd=s:0akAZtnkmi,nbMPJOKXXS |
Stacking Variation ( cm_repeat )
You can vary the height of a stack of icons according to the data value at a specific point.
نحو
chem=y;s=cm_repeat;ds=<series_rendering_index>; ...other_values... ;
  d=<icon_shape>,<repeat_series_index>,<scaling_factor>,<stacking_direction>,<icon_size>,<fill_color>,<outline_color>,<spacing>,<alignment>
- < icon_shape >
- The icon to use. Specify an ID string identifying one of the images listed at the end of the page .
- < repeat_series_index >
- The zero-based index of the data series used to calculate how many icons to place at this point.
- < scaling_factor >
- The source data series value is scaled to a value from 0 to 1 and multiplied by this value to determine how many markers to place on this point. Partial values are truncated.
- < stacking_direction >
- Stacking direction: either "h" (lowercase) for horizontal or "V" (uppercase) for vertical.
- < icon_size >
- The size of each marker, in pixels. The following values are supported: 12, 16, 24.
- < fill_color >
- The fill color for the icon, as a three- or six-digit HTML hexadecimal color (no # mark).
- < outline_color >
- The outline color for the icon, as a three- or six-digit HTML hexadecimal color (no # mark).
- < spacing >
- How much space to put between each marker in a stack, in pixels.
- < alignment >
- An optional string describing the icon alignment and offset.
Example
This example uses a second dummy data series. It is not rendered on the chart, but used as a way to space all the stacks evenly, starting at the bottom of the chart.
|  chd=s1:0akAZtnkmi,AAAAAAAAAA |
Stacking and Color Variation ( cm_repeat_color )
You can vary the both the height and color of an icon stack, according to the data value at a specific point.
نحو
chem=y;s=cm_repeat_color;ds=<series_rendering_index>; ...other_values... ;
  d=<icon_shape>,<repeat_series_index>,<scaling_factor>,<stacking_direction>,<icon_size>,<color_data_series>,<low_color>,<middle_color>,<high_color>,<outline_color>,<spacing>,<alignment>
- < icon_shape >
- The icon to use. Specify an ID string identifying one of the images listed at the end of the page .
- < repeat_series_index >
- The zero-based index of the data series used to calculate how many icons to place at this point.
- < scaling_factor >
- The source data series value is scaled to a value from 0 to 1 and multiplied by this value to determine how many markers to place on this point. Partial values are truncated.
- < stacking_direction >
- Stacking direction: either "h" (lowercase) for horizontal or "V" (uppercase) for vertical.
- < icon_size >
- The size of each marker, in pixels. The following values are supported: 12, 16, 24.
- < color_data_series >
- The zero-based index of the data series used to vary the color of the icons.
- < low_color >
- The low color value in the range, as a three- or six-digit HTML hexadecimal color (no # mark). This is associated with the lowest possible value in the available data range.
- < middle_color >
- The middle color value in the range, as a three- or six-digit HTML hexadecimal color (no # mark). This is associated with the middle value in the available data range.
- < high_color >
- The high color value in the range, as a three- or six-digit HTML hexadecimal color (no # mark). This is associated with the highest possible value in the available data range.
- < outline_color >
- The outline color for the icon, as a three- or six-digit HTML hexadecimal color (no # mark).
- < spacing >
- How much space to put between each marker in a stack, in pixels.
- < alignment >
- An optional string describing the icon alignment and offset.
Example
|  chem= |
