The Agricultural Understanding platform provides granular insights into agricultural landscapes by leveraging machine learning models applied to satellite imagery. The data is primarily delivered through two core systems: Agricultural Landscape Understanding (ALU) and Agricultural Monitoring and Event Detection (AMED).
Units of analysis
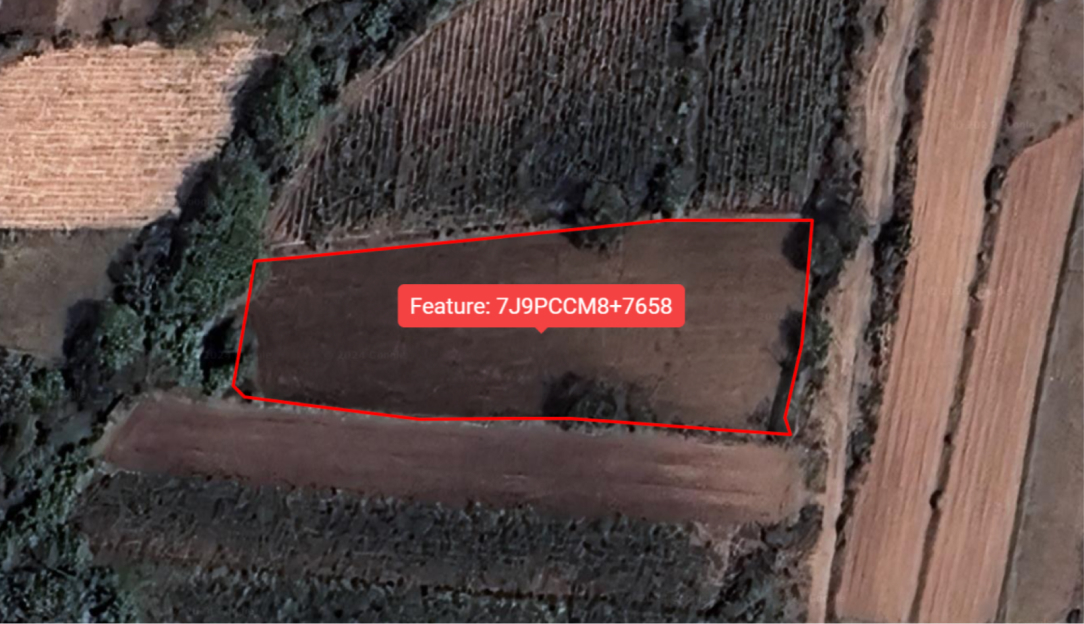
The segmentation model analyzes satellite imagery to identify and delineate landscape features, including agricultural fields, trees, and water bodies (such as farm ponds, dug wells, and natural streams).
Data indexing
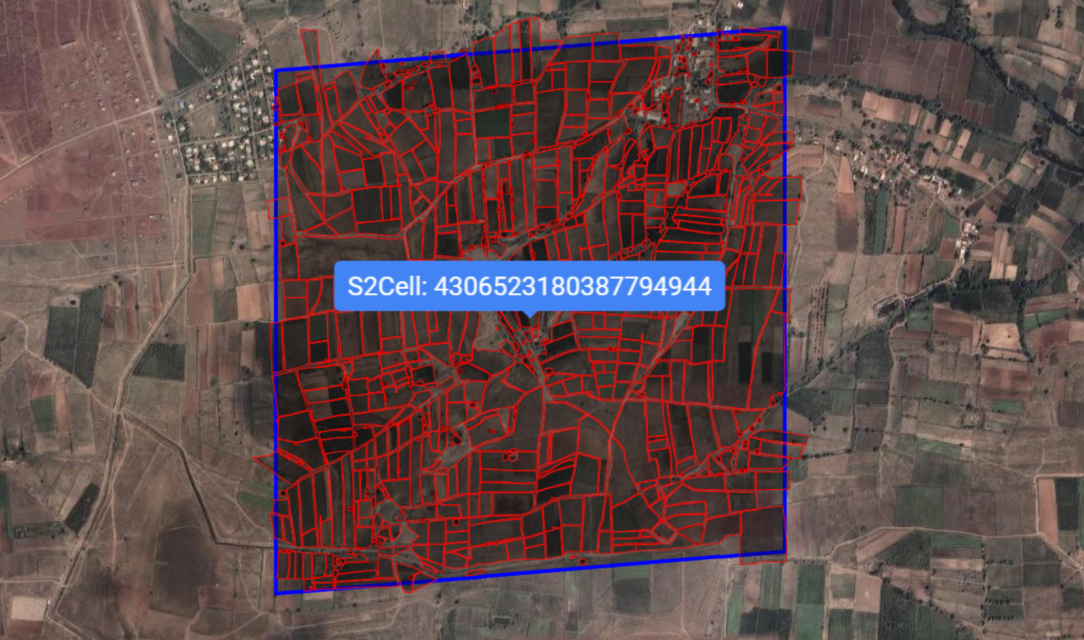
To index spatial data efficiently, the platform organizes the Earth's surface into grid cells using the S2 Geometry library. Data is sharded using level 13 S2 cells, corresponding to grid cells approximately 1 kilometer by 1 kilometer in size. This ensures response payloads are roughly 1MB in size, making them suitable for mobile applications. Features are assigned to an S2 cell based on centroid location.

Landscape features are bucketed into S2 cells by centroid location so a landscape feature will uniquely be only in a single cell.
Agricultural versus non-agricultural areas
Non-agricultural areas include landscape covers like barren lands, rocky hills,
arid deserts, dense forests, infrastructure, roads, large bodies of water, and
urban or built-up surfaces. The machine learning model is trained to exclude
these non-agricultural regions. In cases where the model fails to exclude them,
the platform applies a secondary filter to remove this data unless the user
explicitly requests model output across all regions (for example, by setting
includeNonAgriculturalAreas: true in the
REST API).
Agricultural Landscape Understanding (ALU)
Agricultural Landscape Understanding (ALU) leverages satellite imagery and machine learning to identify boundaries of landscape features (fields, trees, and water bodies).
- Functionality: ALU leverages high-resolution satellite imagery and computer vision to segment the landscape and draw accurate physical boundaries of fields, trees, and water bodies.
- Data sources: High-resolution satellite imagery procured from private vendors.
- Resolution: Outputs are provided in a vectorized format (polygons and shapes rather than a raster grid). The underlying satellite imagery has a resolution of 30–50 cm, from which features are inferred at a 1-meter resolution.
- Insights: Once boundaries are established, the system assigns a near unique ID (Plus Code) to each feature and calculates its area.
- Cadence and history: ALU provides up to 15 years of historical landscape data, with data typically refreshed every 6-12 months.
Capture date
Each agriculture feature includes capture_timestamp_sec which describes the
timestamp of the satellite image used to identify the feature. If a feature
remains unchanged through multiple images, the earliest image timestamp is
provided.
By default, ALU provides a consolidated map across multiple temporal satellite images for the given location. This represents the overall agricultural landscape across a timespan, but may merge results from different years of cultivation. If you're interested in landscape features for a region at a specific crop season or time period, see the Retrieve historical captures example for more details.
Confidence
Each agricultural feature has a class_confidence value describing confidence
in the accuracy of the classification. The value is between 0 and 1.
We recommend thresholding based on these confidence values:
- High confidence: > 0.9
- Medium confidence: 0.75 - 0.9
- Low confidence: < 0.75
Depending on your use case, filtering predictions based on field size, shape, or recency of capture date might also be relevant.
Research
For details on agricultural landscape understanding, its underlying panoptic segmentation model, validation of output, and constraints, read the ALU research paper.
Agricultural Monitoring and Event Detection (AMED)
Agricultural Monitoring and Event Detection (AMED) builds directly on top of the physical boundaries identified by ALU to provide historical and in-season crop monitoring.
- Functionality: AMED leverages high-frequency public satellite imagery to monitor activity within identified fields.
- Data sources: Public satellite imagery from Sentinel-1 and Sentinel-2.
- Resolution: Outputs are provided in a vectorized format at the field level (as defined by ALU boundaries). AMED inferences are based on satellites with a pixel resolution of 10–30 meters.
- Insights: It predicts crop seasons (corresponding to sowing and harvesting date ranges) and the crop grown on the field within this season.
- Cadence and history: AMED provides up to 6 years of historical monitoring data and refreshes every 15 days.
Research
Crop inferences rely on multispectral time-series imagery to track spectral shifts across planting and harvest cycles. For details on crop monitoring and prediction approaches, read the AMED research paper.
Supported crops
Supported crop types include: Bajra, Chilli, Corn, Cotton, Gram
(Bengal gram and Chickpeas), Groundnut, Mustard, Rice, Sorghum,
Soybeans, Sugarcane, and Wheat.
Crop predictions and confidence interpretation
In monitorLandscape, monitoring_prediction objects return per-crop
confidence (conf_1, conf_2, conf_3) corresponding to the top three
predicted crops. The confidence values are between 0 and 1. We suggest
thresholding your predictions based on the following confidence levels:
- High confidence: > 0.7
- Medium confidence: 0.5 - 0.7
- Low confidence: < 0.5
We also recommend evaluating the top two crop predictions in conjunction with the top prediction for better results.
Special cases:
UNKNOWN_CROP: Returned when crop signals indicate active cultivation but spectral signatures don't match supported crop classes.NO_PREDICTION: Returned when no cultivation is detected for the field in the given time range. For fields with no detected cultivation in the entire historical monitoring period, a singleNO_PREDICTIONresult is returned. Brief periods ofNO_PREDICTIONmay also be returned due to lack of usable data signals from cloud cover or missing satellite imagery data.