Utilisez l'API PageSpeed Insights pour:
- Mesurez les performances d'une page Web.
- Obtenez des suggestions pour améliorer les performances, l'accessibilité et le référencement de la page.
L'API PageSpeed Insights renvoie des données réelles issues du rapport d'expérience utilisateur Chrome et des données de laboratoire issues de Lighthouse.
API Explorer
Pour effectuer des appels à l'API PageSpeed Insights sans écrire de code, consultez API Explorer.
Obtenir et utiliser une clé API
Obtenir une cléVous pouvez également en créer un sur la page Identifiants.
Une fois la clé API obtenue, votre application peut ajouter le paramètre de requête key=yourAPIKey à toutes les URL de requête.
La clé API peut s'intégrer aux URL en toute sécurité et ne nécessite pas d'encodage.
curl
Pour essayer l'API PageSpeed Insights à partir de la ligne de commande:
- Ouvrez un terminal.
-
Exécutez la commande suivante : Remplacez
yourAPIKeypar votre clé API.curl https://www.googleapis.com/pagespeedonline/v5/runPagespeed?url=https://web.dev/&key=yourAPIKey
La réponse est un objet JSON. Consultez la section Réponse pour en savoir plus sur chacune des propriétés de l'objet de réponse.
{
 "captchaResult": "CAPTCHA_NOT_NEEDED",
 "kind": "pagespeedonline#result",
 "id": "https://developers.google.com/",
 "loadingExperience": {
  "id": "https://developers.google.com/",
  "metrics": {
   "FIRST_CONTENTFUL_PAINT_MS": {
    "percentile": 3482,
    "distributions": [
     {
      "min": 0,
      "max": 1000,
      "proportion": 0.37151728768042963
     },
     {
      "min": 1000,
      "max": 2500,
      "proportion": 0.4244153519077991
     },
     {
      "min": 2500,
      "proportion": 0.2040673604117713
     }
    ],
    "category": "SLOW"
   },
   "FIRST_INPUT_DELAY_MS": {
    "percentile": 36,
    "distributions": [
     {
      "min": 0,
      "max": 50,
      "proportion": 0.960628961482204
     },
     {
      "min": 50,
      "max": 250,
      "proportion": 0.02888834714773281
     },
     {
      "min": 250,
      "proportion": 0.010482691370063388
     }
    ],
    "category": "FAST"
   }
  },
  "overall_category": "SLOW",
  "initial_url": "https://developers.google.com/"
 },
 "originLoadingExperience": {
  "id": "https://developers.google.com",
  "metrics": {
   "FIRST_CONTENTFUL_PAINT_MS": {
    "percentile": 2761,
    "distributions": [
     {
      "min": 0,
      "max": 1000,
      "proportion": 0.4236433226493666
     },
     {
      "min": 1000,
      "max": 2500,
      "proportion": 0.45045120795679117
     },
     {
      "min": 2500,
      "proportion": 0.1259054693938423
     }
    ],
    "category": "SLOW"
   },
   "FIRST_INPUT_DELAY_MS": {
    "percentile": 45,
    "distributions": [
     {
      "min": 0,
      "max": 50,
      "proportion": 0.9537371485251699
     },
     {
      "min": 50,
      "max": 250,
      "proportion": 0.03044972719889055
     },
     {
      "min": 250,
      "proportion": 0.01581312427593959
     }
    ],
    "category": "FAST"
   }
  },
  "overall_category": "SLOW",
  "initial_url": "https://developers.google.com/"
 },
 "lighthouseResult": {
  "requestedUrl": "https://developers.google.com/",
  "finalUrl": "https://developers.google.com/",
  "lighthouseVersion": "3.2.0",
  "userAgent": "Mozilla/5.0 (X11; Linux x86_64) AppleWebKit/537.36 (KHTML, like Gecko) HeadlessChrome/72.0.3584.0 Safari/537.36",
  "fetchTime": "2018-11-01T03:03:58.394Z",
  "environment": {
   "networkUserAgent": "Mozilla/5.0 (Macintosh; Intel Mac OS X 10_12_6) AppleWebKit/537.36 (KHTML, like Gecko) Chrome/71.0.3559.0 Safari/537.36",
   "hostUserAgent": "Mozilla/5.0 (X11; Linux x86_64) AppleWebKit/537.36 (KHTML, like Gecko) HeadlessChrome/72.0.3584.0 Safari/537.36",
   "benchmarkIndex": 590.0
  },
  "runWarnings": [],
  "configSettings": {
   "emulatedFormFactor": "desktop",
   "locale": "en-US",
   "onlyCategories": [
    "performance"
   ]
  },
  "audits": {
   "estimated-input-latency": {
    "id": "estimated-input-latency",
    "title": "Estimated Input Latency",
    "description": "The score above is an estimate of how long your app takes to respond to user input, in milliseconds, during the busiest 5s window of page load. If your latency is higher than 50 ms, users may perceive your app as laggy. [Learn more](https://developers.google.com/web/tools/lighthouse/audits/estimated-input-latency).",
    "score": 1.0,
    "scoreDisplayMode": "numeric",
    "displayValue": "30 ms"
   },
   "uses-rel-preconnect": {
    "id": "uses-rel-preconnect",
    "title": "Preconnect to required origins",
    "description": "Consider adding preconnect or dns-prefetch resource hints to establish early connections to important third-party origins. [Learn more](https://developers.google.com/web/fundamentals/performance/resource-prioritization#preconnect).",
    "score": 1.0,
    "scoreDisplayMode": "numeric",
    "details": {
     "headings": [],
     "type": "opportunity",
     "items": [],
     "overallSavingsMs": 0.0
    }
   },
   ...
  },
  "categories": {
   "performance": {
    "id": "performance",
    "title": "Performance",
    "score": 0.96,
    "auditRefs": [
     {
      "id": "first-contentful-paint",
      "weight": 3.0,
      "group": "metrics"
     },
     {
      "id": "first-meaningful-paint",
      "weight": 1.0,
      "group": "metrics"
     },
     ...
    ]
   }
  },
  "categoryGroups": {
   "a11y-element-names": {
    "title": "Elements Have Discernible Names",
    "description": "These are opportunities to improve the semantics of the controls in your application. This may enhance the experience for users of assistive technology, like a screen reader."
   },
   "a11y-language": {
    "title": "Page Specifies Valid Language",
    "description": "These are opportunities to improve the interpretation of your content by users in different locales."
   },
   ...
  },
  "i18n": {
   "rendererFormattedStrings": {
    "varianceDisclaimer": "Values are estimated and may vary.",
    "opportunityResourceColumnLabel": "Opportunity",
    "opportunitySavingsColumnLabel": "Estimated Savings",
    "errorMissingAuditInfo": "Report error: no audit information",
    "errorLabel": "Error!",
    "warningHeader": "Warnings: ",
    "auditGroupExpandTooltip": "Show audits",
    "passedAuditsGroupTitle": "Passed audits",
    "notApplicableAuditsGroupTitle": "Not applicable",
    "manualAuditsGroupTitle": "Additional items to manually check",
    "toplevelWarningsMessage": "There were issues affecting this run of Lighthouse:",
    "scorescaleLabel": "Score scale:",
    "crcLongestDurationLabel": "Maximum critical path latency:",
    "crcInitialNavigation": "Initial Navigation",
    "lsPerformanceCategoryDescription": "[Lighthouse](https://developers.google.com/web/tools/lighthouse/) analysis of the current page on an emulated mobile network. Values are estimated and may vary.",
    "labDataTitle": "Lab Data"
   }
  }
 },
 "analysisUTCTimestamp": "2018-11-01T03:03:58.394Z"
}
JavaScript
Pour essayer l'API PageSpeed Insights à partir de JavaScript:
-
Copiez le code ci-dessous. Le code utilise l'API PageSpeed Insights pour mesurer les performances de
https://web.dev/, puis affiche les résultats./** * Fetches and displays PageSpeed Insights data. */ async function run() { const apiEndpoint = 'https://www.googleapis.com/pagespeedonline/v5/runPagespeed'; const targetUrl = 'https://web.dev/'; const url = new URL(apiEndpoint); url.searchParams.set('url', targetUrl); try { const response = await fetch(url); if (!response.ok) { throw new Error(`HTTP error! status: ${response.status}`); } const json = await response.json(); // See // https://developers.google.com/speed/docs/insights/v5/reference/pagespeedapi/runpagespeed#response // to learn more about each of the properties in the response object. showInitialContent(json.id); const cruxMetrics = { 'First Contentful Paint': json.loadingExperience.metrics.FIRST_CONTENTFUL_PAINT_MS?.category, 'Interaction to Next Paint': json.loadingExperience.metrics.INTERACTION_TO_NEXT_PAINT?.category, }; showCruxContent(cruxMetrics); const lighthouse = json.lighthouseResult; const lighthouseMetrics = { 'First Contentful Paint': lighthouse.audits['first-contentful-paint']?.displayValue, 'Speed Index': lighthouse.audits['speed-index']?.displayValue, 'Largest Contentful Paint': lighthouse.audits['largest-contentful-paint']?.displayValue, 'Total Blocking Time': lighthouse.audits['total-blocking-time']?.displayValue, 'Time To Interactive': lighthouse.audits['interactive']?.displayValue, }; showLighthouseContent(lighthouseMetrics); } catch (error) { console.error('Fetching PageSpeed Insights failed:', error); document.body.textContent = `Failed to fetch PageSpeed data. Check the console for errors.`; } } /** * Displays initial content, including the page ID. * @param {string} id The ID of the page being tested. */ function showInitialContent(id) { document.body.innerHTML = ''; // Clear previous content const title = document.createElement('h1'); title.textContent = 'PageSpeed Insights API Demo'; document.body.appendChild(title); const page = document.createElement('p'); page.textContent = `Page tested: ${id}`; document.body.appendChild(page); } /** * Displays CrUX metrics. * @param {!Object} cruxMetrics The CrUX metrics to display. */ function showCruxContent(cruxMetrics) { const cruxHeader = document.createElement('h2'); cruxHeader.textContent = 'Chrome User Experience Report Results'; document.body.appendChild(cruxHeader); for (const key in cruxMetrics) { const p = document.createElement('p'); p.textContent = `${key}: ${cruxMetrics[key]}`; document.body.appendChild(p); } } /** * Displays Lighthouse metrics. * @param {!Object} lighthouseMetrics The Lighthouse metrics to display. */ function showLighthouseContent(lighthouseMetrics) { const lighthouseHeader = document.createElement('h2'); lighthouseHeader.textContent = 'Lighthouse Results'; document.body.appendChild(lighthouseHeader); for (const key in lighthouseMetrics) { const p = document.createElement('p'); p.textContent = `${key}: ${lighthouseMetrics[key]}`; document.body.appendChild(p); } } run();
- Collez le code dans une balise
scriptdans un fichier HTML. -
Ouvrez le fichier HTML dans un navigateur. Une fois l'opération terminée, votre page ressemble à la figure 1.
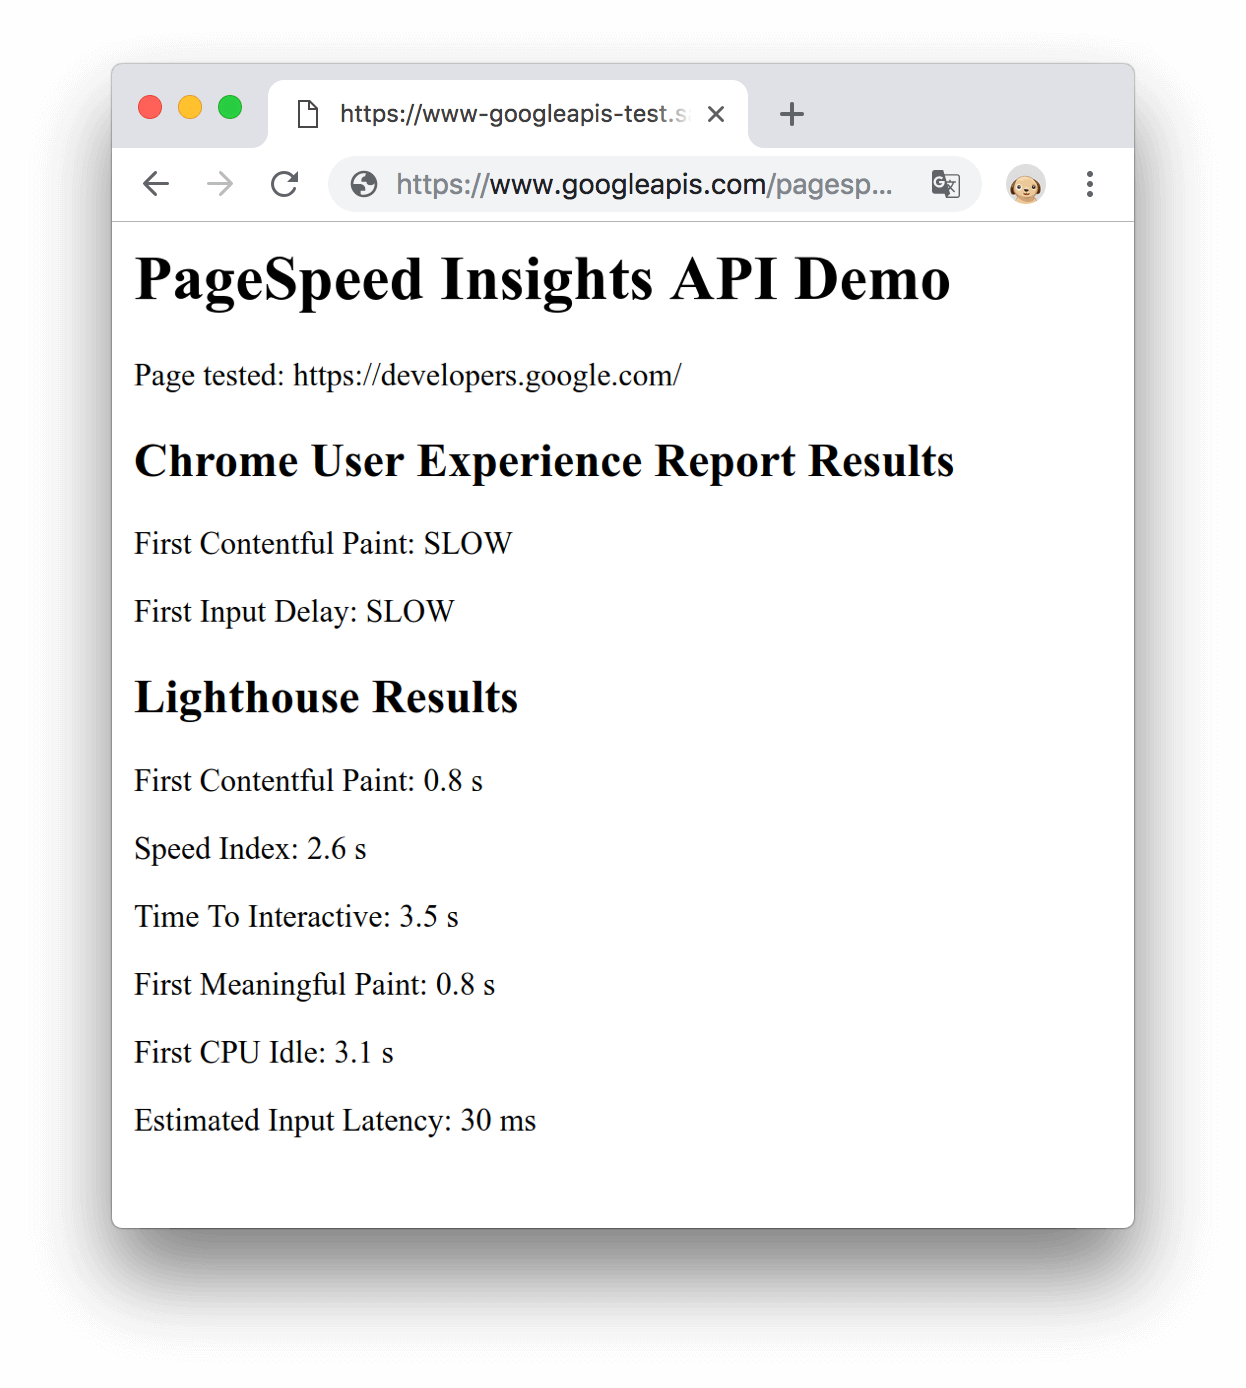
Figure 1. Démo JavaScript
Étapes suivantes
- Consultez Réponse pour en savoir plus sur chacune des propriétés de l'objet de réponse.
- Consultez À propos de l'API PageSpeed Insights pour en savoir plus sur le calcul des mesures de performances.
Commentaires
Cette page vous a-t-elle été utile ?