
এই পৃষ্ঠাটি বর্ণনা করে যে কীভাবে Google পত্রক থেকে বিদ্যমান চার্টগুলি নিতে হয় এবং সেগুলিকে Google স্লাইড উপস্থাপনায় যুক্ত করতে হয়৷
একটি প্রেজেন্টেশনে চার্ট যোগ করা আরও প্রভাব তৈরি করতে এবং আপনার শ্রোতাদের কাছে ডেটা অর্থপূর্ণ করতে সাহায্য করতে পারে। চার্টগুলি একটি ডেটা সেটে প্যাটার্ন বা প্রবণতা দেখানোর জন্য অনন্যভাবে শক্তিশালী টুল, এবং আপনাকে পরিমাণগত ডেটা সম্পর্কে স্পষ্টভাবে যোগাযোগ করতে সাহায্য করতে পারে।
উপরের ভিডিওতে আলোচনা করা হয়েছে কিভাবে স্প্রেডশীট ডেটা থেকে স্লাইড তৈরি করা যায়। এটি একটি সম্পূর্ণ উদাহরণ (পাইথন) অন্তর্ভুক্ত করে যা একটি স্লাইডে একটি চার্ট যোগ করে এবং একটি টেবিলে স্প্রেডশীট সেল ডেটা আমদানি করে।
চার্ট যোগ সম্পর্কে
যখনই আপনি পরিমাণগত তথ্য উপস্থাপন করছেন, ডেটা চার্ট আপনার উপস্থাপনাকে উন্নত করতে পারে। স্লাইডস API আপনাকে Google পত্রকগুলিতে তৈরি করতে পারেন এমন যেকোনো চার্ট অন্তর্ভুক্ত করতে দেয়: বার চার্ট, লাইন চার্ট, পাই চার্ট এবং আরও অনেক কিছু।
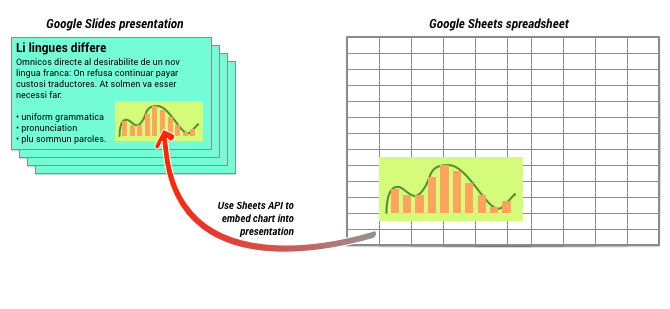
উপরের চিত্রে যেমন দেখানো হয়েছে, আপনাকে প্রথমে Google Sheets-এ চার্ট তৈরি করতে হবে। একবার চার্টটি উপস্থিত হলে, আপনি এটিকে আপনার উপস্থাপনায় এম্বেড করতে পারেন।
আপনার উপস্থাপনায় চার্ট পরিচালনার জন্য সাধারণ প্রক্রিয়া হল:
- Google পত্রকগুলিতে একটি চার্ট তৈরি করুন৷
- ফলস্বরূপ এমবেডেডচার্টের চার্ট আইডি পড়তে শীট API ব্যবহার করুন।
- এটি একটি স্লাইডে যোগ করতে একবার CreateSheetsChartRequest ব্যবহার করুন।
- এটিকে সোর্স ডেটাতে সিঙ্ক করতে প্রয়োজন অনুযায়ী RefreshSheetsChartRequest ব্যবহার করুন।
স্ট্যাটিক বনাম লিঙ্ক চার্ট
আপনি যখন আপনার উপস্থাপনায় একটি চার্ট যোগ করার জন্য API ব্যবহার করেন, তখন আপনি যে একটি প্যারামিটার নির্দিষ্ট করেন তা হল LinkingMode । এটি নির্ধারণ করে যে চার্টটি একটি স্ট্যাটিক ইমেজ হিসাবে বা একটি বস্তু হিসাবে যুক্ত করা হয়েছে যা ভবিষ্যতে রিফ্রেশ করা যেতে পারে।
LINKED মোড ব্যবহার করুন যদি:
- আপনি ভবিষ্যতে চার্টটি রিফ্রেশ করতে চান, অন্তর্নিহিত ডেটাতে পরিবর্তনগুলি প্রতিফলিত করে৷
- আপনি সহযোগীদের উৎস চার্ট ধারণকারী স্প্রেডশীট একটি লিঙ্ক চান.
NOT_LINKED_IMAGE (স্ট্যাটিক) মোড ব্যবহার করুন যদি:
- আপনি চার্টটি ভবিষ্যতে কখনই পরিবর্তন না করতে চান।
- আপনি উত্স স্প্রেডশীটের একটি লিঙ্ক দেখতে সহযোগীদের দেখতে চান না.
Google পত্রক অ্যাক্সেস করার সুযোগ
আপনি যখন আপনার স্লাইডে একটি চার্ট যোগ করেন, তখন স্লাইড API-এর Google পত্রকগুলিতে এটি অ্যাক্সেস করতে হবে। এর মানে হল আপনার অনুরোধকে অবশ্যই নিম্নলিখিত স্কোপের একটি ব্যবহার করতে হবে:
-
https://www.googleapis.com/auth/spreadsheets.readonly(পছন্দের) -
https://www.googleapis.com/auth/spreadsheets -
https://www.googleapis.com/auth/drive.readonly -
https://www.googleapis.com/auth/drive
spreadsheets.readonly স্কোপটি সাধারণত ব্যবহার করার জন্য সর্বোত্তম, কারণ এটি সবচেয়ে সীমাবদ্ধ। যাইহোক, যদি আপনার অ্যাপ ইতিমধ্যেই উপরে তালিকাভুক্ত অন্য স্কোপগুলির একটি ব্যবহার করে, তাহলে সেই সুযোগটি ব্যবহার করুন।
একটি চার্ট যোগ করা হচ্ছে
একটি চার্ট যোগ করতে, আপনাকে Google পত্রকের স্প্রেডশীট আইডি এবং চার্টের চার্ট আইডি জানতে হবে। তারপর আপনি চার্ট যোগ করতে একবার CreateSheetsChartRequest ব্যবহার করে batchUpdate পদ্ধতিতে কল করুন।
নিম্নলিখিত উদাহরণটি একটি চার্ট নেয় এবং এটিকে LINKED হিসাবে একটি স্লাইডে যোগ করে যাতে এটি পরে রিফ্রেশ করা যায়।
অ্যাপস স্ক্রিপ্ট
/**
 * Embed a Sheets chart (indicated by the spreadsheetId and sheetChartId) onto
 *   a page in the presentation. Setting the linking mode as 'LINKED' allows the
 *   chart to be refreshed if the Sheets version is updated.
 * @param {string} presentationId
 * @param {string} pageId
 * @param {string} shapeId
 * @param {string} sheetChartId
 * @returns {*}
 */
function createSheetsChart(presentationId, pageId, shapeId, sheetChartId) {
  const emu4M = {
    magnitude: 4000000,
    unit: 'EMU'
  };
  const presentationChartId = 'MyEmbeddedChart';
  const requests = [{
    createSheetsChart: {
      objectId: presentationChartId,
      spreadsheetId: shapeId,
      chartId: sheetChartId,
      linkingMode: 'LINKED',
      elementProperties: {
        pageObjectId: pageId,
        size: {
          height: emu4M,
          width: emu4M
        },
        transform: {
          scaleX: 1,
          scaleY: 1,
          translateX: 100000,
          translateY: 100000,
          unit: 'EMU'
        }
      }
    }
  }];

  // Execute the request.
  try {
    const batchUpdateResponse = Slides.Presentations.batchUpdate({
      requests: requests
    }, presentationId);
    console.log('Added a linked Sheets chart with ID: %s', presentationChartId);

    return batchUpdateResponse;
  } catch (err) {
    // TODO (Developer) - Handle exception
    console.log('Failed with error: %s', err.error);
  }
};
যাওয়া
// Embed a Sheets chart (indicated by the spreadsheetId and sheetChartId) onto
// a page in the presentation. Setting the linking mode as "LINKED" allows the
// chart to be refreshed if the Sheets version is updated.
emu4M := slides.Dimension{Magnitude: 4000000, Unit: "EMU"}
presentationChartId := "MyEmbeddedChart"
requests := []*slides.Request{{
	CreateSheetsChart: &slides.CreateSheetsChartRequest{
		ObjectId:      presentationChartId,
		SpreadsheetId: spreadsheetId,
		ChartId:       sheetChartId,
		LinkingMode:   "LINKED",
		ElementProperties: &slides.PageElementProperties{
			PageObjectId: pageId,
			Size: &slides.Size{
				Height: &emu4M,
				Width:  &emu4M,
			},
			Transform: &slides.AffineTransform{
				ScaleX:     1.0,
				ScaleY:     1.0,
				TranslateX: 100000.0,
				TranslateY: 100000.0,
				Unit:       "EMU",
			},
		},
	},
}}

// Execute the requests.
body := &slides.BatchUpdatePresentationRequest{Requests: requests}
response, _ := slidesService.Presentations.BatchUpdate(presentationId, body).Do()
fmt.Printf("Added a linked Sheets chart with ID %s", presentationChartId)
জাভা
import com.google.api.client.googleapis.json.GoogleJsonError;
import com.google.api.client.googleapis.json.GoogleJsonResponseException;
import com.google.api.client.http.HttpRequestInitializer;
import com.google.api.client.http.javanet.NetHttpTransport;
import com.google.api.client.json.gson.GsonFactory;
import com.google.api.services.slides.v1.Slides;
import com.google.api.services.slides.v1.SlidesScopes;
import com.google.api.services.slides.v1.model.AffineTransform;
import com.google.api.services.slides.v1.model.BatchUpdatePresentationRequest;
import com.google.api.services.slides.v1.model.BatchUpdatePresentationResponse;
import com.google.api.services.slides.v1.model.CreateSheetsChartRequest;
import com.google.api.services.slides.v1.model.Dimension;
import com.google.api.services.slides.v1.model.PageElementProperties;
import com.google.api.services.slides.v1.model.Request;
import com.google.api.services.slides.v1.model.Size;
import com.google.auth.http.HttpCredentialsAdapter;
import com.google.auth.oauth2.GoogleCredentials;

import java.io.IOException;
import java.util.ArrayList;
import java.util.Collections;
import java.util.List;

/* Class to demonstrate the use of Slides Create Chart API */
public class CreateSheetsChart {
  /**
   * Adds chart from spreadsheet to slides as linked.
   *
   * @param presentationId - id of the presentation.
   * @param pageId         - id of the page.
   * @param spreadsheetId  - id of the spreadsheet.
   * @param sheetChartId   - id of the chart in sheets.
   * @return presentation chart id
   * @throws IOException - if credentials file not found.
   */
  public static BatchUpdatePresentationResponse createSheetsChart(
      String presentationId, String pageId, String spreadsheetId, Integer sheetChartId)
      throws IOException {
        /* Load pre-authorized user credentials from the environment.
           TODO(developer) - See https://developers.google.com/identity for
            guides on implementing OAuth2 for your application. */
    GoogleCredentials credentials = GoogleCredentials.getApplicationDefault()
        .createScoped(Collections.singleton(SlidesScopes.PRESENTATIONS));
    HttpRequestInitializer requestInitializer = new HttpCredentialsAdapter(
        credentials);

    // Create the slides API client
    Slides service = new Slides.Builder(new NetHttpTransport(),
        GsonFactory.getDefaultInstance(),
        requestInitializer)
        .setApplicationName("Slides samples")
        .build();

    // Embed a Sheets chart (indicated by the spreadsheetId and sheetChartId) onto
    // a page in the presentation. Setting the linking mode as "LINKED" allows the
    // chart to be refreshed if the Sheets version is updated.
    List<Request> requests = new ArrayList<>();
    Dimension emu4M = new Dimension().setMagnitude(4000000.0).setUnit("EMU");
    String presentationChartId = "MyEmbeddedChart";
    requests.add(new Request()
        .setCreateSheetsChart(new CreateSheetsChartRequest()
            .setObjectId(presentationChartId)
            .setSpreadsheetId(spreadsheetId)
            .setChartId(sheetChartId)
            .setLinkingMode("LINKED")
            .setElementProperties(new PageElementProperties()
                .setPageObjectId(pageId)
                .setSize(new Size()
                    .setHeight(emu4M)
                    .setWidth(emu4M))
                .setTransform(new AffineTransform()
                    .setScaleX(1.0)
                    .setScaleY(1.0)
                    .setTranslateX(100000.0)
                    .setTranslateY(100000.0)
                    .setUnit("EMU")))));

    BatchUpdatePresentationResponse response = null;
    try {
      // Execute the request.
      BatchUpdatePresentationRequest body =
          new BatchUpdatePresentationRequest().setRequests(requests);
      response = service.presentations().batchUpdate(presentationId, body).execute();
      System.out.println("Added a linked Sheets chart with ID " + presentationChartId);
    } catch (GoogleJsonResponseException e) {
      // TODO(developer) - handle error appropriately
      GoogleJsonError error = e.getDetails();
      if (error.getCode() == 404) {
        System.out.printf("Presentation not found with id '%s'.\n", presentationId);
      } else {
        throw e;
      }
    }
    return response;
  }
}
জাভাস্ক্রিপ্ট
function createSheetsChart(presentationId, pageId, shapeId, sheetChartId, callback) {
  // Embed a Sheets chart (indicated by the spreadsheetId and sheetChartId) onto
  // a page in the presentation. Setting the linking mode as "LINKED" allows the
  // chart to be refreshed if the Sheets version is updated.
  const emu4M = {
    magnitude: 4000000,
    unit: 'EMU',
  };
  const presentationChartId = 'MyEmbeddedChart';
  const requests = [{
    createSheetsChart: {
      objectId: presentationChartId,
      spreadsheetId: shapeId,
      chartId: sheetChartId,
      linkingMode: 'LINKED',
      elementProperties: {
        pageObjectId: pageId,
        size: {
          height: emu4M,
          width: emu4M,
        },
        transform: {
          scaleX: 1,
          scaleY: 1,
          translateX: 100000,
          translateY: 100000,
          unit: 'EMU',
        },
      },
    },
  }];
  // Execute the request.
  try {
    gapi.client.slides.presentations.batchUpdate({
      presentationId: presentationId,
      requests: requests,
    }).then((batchUpdateResponse) => {
      console.log(`Added a linked Sheets chart with ID: ${presentationChartId}`);
      if (callback) callback(batchUpdateResponse.result);
    });
  } catch (err) {
    document.getElementById('content').innerText = err.message;
    return;
  }
}
Node.js
/**
 * Embeds a Sheets chart onto a page in a presentation.
 * @param {string} presentationId The presentation ID.
 * @param {string} pageId The page ID.
 * @param {string} spreadsheetId The spreadsheet ID.
 * @param {string} sheetChartId The sheet's chart ID.
 */
async function createSheetsChart(
    presentationId,
    pageId,
    spreadsheetId,
    sheetChartId,
) {
  const {GoogleAuth} = require('google-auth-library');
  const {google} = require('googleapis');

  const auth = new GoogleAuth({
    scopes: 'https://www.googleapis.com/auth/presentations',
  });

  const service = google.slides({version: 'v1', auth});

  // Embed a Sheets chart (indicated by the spreadsheetId and sheetChartId) onto
  // a page in the presentation. Setting the linking mode as "LINKED" allows the
  // chart to be refreshed if the Sheets version is updated.
  const emu4M = {
    magnitude: 4000000,
    unit: 'EMU',
  };
  const presentationChartId = 'MyEmbeddedChart';
  const requests = [
    {
      createSheetsChart: {
        objectId: presentationChartId,
        spreadsheetId: spreadsheetId,
        chartId: sheetChartId,
        linkingMode: 'LINKED',
        elementProperties: {
          pageObjectId: pageId,
          size: {
            height: emu4M,
            width: emu4M,
          },
          transform: {
            scaleX: 1,
            scaleY: 1,
            translateX: 100000,
            translateY: 100000,
            unit: 'EMU',
          },
        },
      },
    },
  ];

  // Execute the request.
  try {
    const batchUpdateResponse = await service.presentations.batchUpdate({
      presentationId,
      resource: {
        requests,
      },
    });
    console.log(`Added a linked Sheets chart with ID: ${presentationChartId}`);
    return batchUpdateResponse.data;
  } catch (err) {
    // TODO (developer) - Handle exception
    throw err;
  }
}
পিএইচপি
use Google\Client;
use Google\Service\Drive;
use Google\Service\Slides;
use Google\Service\Slides\Request;


function createSheetsChart($presentationId, $pageId, $spreadsheetId, $sheetChartId)
{
    /* Load pre-authorized user credentials from the environment.
       TODO(developer) - See https://developers.google.com/identity for
        guides on implementing OAuth2 for your application. */
    $client = new Google\Client();
    $client->useApplicationDefaultCredentials();
    $client->addScope(Google\Service\Drive::DRIVE);
    $slidesService = new Google_Service_Slides($client);
    // Embed a Sheets chart (indicated by the spreadsheet_id and sheet_chart_id) onto
    // a page in the presentation. Setting the linking mode as "LINKED" allows the
    // chart to be refreshed if the Sheets version is updated.
    try {
        //creating new presentaion chart
        $presentationChartId = 'MyEmbeddedChart';
        $emu4M = array('magnitude' => 4000000, 'unit' => 'EMU');
        $requests = array();
        $requests[] = new Google_Service_Slides_Request(
            array(
                'createSheetsChart' => array(
                    'spreadsheetId' => $spreadsheetId,
                    'chartId' => $sheetChartId,
                    'linkingMode' => 'LINKED',
                    'elementProperties' => array(
                        'pageObjectId' => $pageId,
                        'size' => array(
                            'height' => $emu4M,
                            'width' => $emu4M
                        ),
                        'transform' => array(
                            'scaleX' => 1,
                            'scaleY' => 1,
                            'translateX' => 100000,
                            'translateY' => 100000,
                            'unit' => 'EMU'
                        )
                    )
                )
            ));

        // Execute the request.
        $batchUpdateRequest = new Google_Service_Slides_BatchUpdatePresentationRequest(array(
            'requests' => $requests
        ));
        $response = $slidesService->presentations->batchUpdate($presentationId, $batchUpdateRequest);
        printf("Added a linked Sheets chart with ID: %s\n", $response->getPresentationId());
        return $response;
    } catch (Exception $e) {
        echo 'Message: ' . $e->getMessage();
    }
}
পাইথন
import google.auth
from googleapiclient.discovery import build
from googleapiclient.errors import HttpError


def create_sheets_chart(
    presentation_id, page_id, spreadsheet_id, sheet_chart_id
):
  """
  create_sheets_chart the user has access to.
  Load pre-authorized user credentials from the environment.
  TODO(developer) - See https://developers.google.com/identity
  for guides on implementing OAuth2 for the application.
  """
  creds, _ = google.auth.default()
  # pylint: disable=maybe-no-member
  try:
    slides_service = build("slides", "v1", credentials=creds)
    # Embed a Sheets chart (indicated by the spreadsheet_id and
    # sheet_chart_id) onto a page in the presentation.
    # Setting the linking mode as "LINKED" allows the
    # chart to be refreshed if the Sheets version is updated.

    emu4m = {"magnitude": 4000000, "unit": "EMU"}

    presentation_chart_id = "MyEmbeddedChart"
    requests = [
        {
            "createSheetsChart": {
                "objectId": presentation_chart_id,
                "spreadsheetId": spreadsheet_id,
                "chartId": sheet_chart_id,
                "linkingMode": "LINKED",
                "elementProperties": {
                    "pageObjectId": page_id,
                    "size": {"height": emu4m, "width": emu4m},
                    "transform": {
                        "scaleX": 1,
                        "scaleY": 1,
                        "translateX": 100000,
                        "translateY": 100000,
                        "unit": "EMU",
                    },
                },
            }
        }
    ]

    # Execute the request.
    body = {"requests": requests}
    response = (
        slides_service.presentations()
        .batchUpdate(presentationId=presentation_id, body=body)
        .execute()
    )
    print(f"Added a linked Sheets chart with ID: {presentation_chart_id}")
    return response
  except HttpError as error:
    print(f"An error occurred: {error}")
    return error


if __name__ == "__main__":
  # Put the presentation_id, Page_id of slides
  # spreadsheet_id and sheet_chart_id to be submitted.
  create_sheets_chart(
      "10QnVUx1X2qHsL17WUidGpPh_SQhXYx40CgIxaKk8jU4",
      "FIRSTSLIDE",
      "17eqFZl_WK4WVixX8PjvjfLD77DraoFwMDXeiHB3dvuM",
      "1107320627",
  )
রুবি
# Embed a Sheets chart (indicated by the spreadsheet_id and sheet_chart_id) onto
# a page in the presentation. Setting the linking mode as "LINKED" allows the
# chart to be refreshed if the Sheets version is updated.
emu4M = {
  magnitude: 4000000,
  unit:      'EMU'
}
presentation_chart_id = 'my_embedded_chart'
requests = [{
  create_sheets_chart: {
    object_id_prop:     presentation_chart_id,
    spreadsheet_id:     spreadsheet_id,
    chart_id:           sheet_chart_id,
    linking_mode:       'LINKED',
    element_properties: {
      page_object_id: page_id,
      size:           {
        height: emu4M,
        width:  emu4M
      },
      transform:      {
        scale_x:     1,
        scale_y:     1,
        translate_x: 100000,
        translate_y: 100000,
        unit:        'EMU'
      }
    }
  }
}]

# Execute the request.
req = Google::Apis::SlidesV1::BatchUpdatePresentationRequest.new(requests: requests)
response = slides_service.batch_update_presentation(presentation_id, req)

puts "Added a linked Sheets chart with ID: #{presentation_chart_id}"
একটি চার্ট রিফ্রেশ করা হচ্ছে
আপনি যদি আপনার উপস্থাপনায় একটি LINKED চার্ট এম্বেড করে থাকেন, তাহলে আপনি RefreshSheetsChartRequest ব্যবহার করে যে কোনো সময় এটি রিফ্রেশ করতে পারেন। এটি অন্তর্নিহিত পত্রক চার্ট এবং এটির উপর ভিত্তি করে থাকা ডেটার সাথে সিঙ্ক করতে চার্টটিকে আপডেট করে৷
নিম্নলিখিত উদাহরণ একটি বিদ্যমান চার্ট রিফ্রেশ করে:
অ্যাপস স্ক্রিপ্ট
/**
 * Refresh the sheets charts
 * @param {string} presentationId
 * @param {string} presentationChartId
 * @returns {*}
 */
function refreshSheetsChart(presentationId, presentationChartId) {
  const requests = [{
    refreshSheetsChart: {
      objectId: presentationChartId
    }
  }];

  // Execute the request.
  try {
    const batchUpdateResponse = Slides.Presentations.batchUpdate({
      requests: requests
    }, presentationId);
    console.log('Refreshed a linked Sheets chart with ID: %s', presentationChartId);

    return batchUpdateResponse;
  } catch (err) {
    // TODO (Developer) - Handle exception
    console.log('Failed with error: %s', err.error);
  }
};
যাওয়া
requests := []*slides.Request{{
	RefreshSheetsChart: &slides.RefreshSheetsChartRequest{
		ObjectId: presentationChartId,
	},
}}

// Execute the requests.
body := &slides.BatchUpdatePresentationRequest{Requests: requests}
response, _ := slidesService.Presentations.BatchUpdate(presentationId, body).Do()
fmt.Printf("Refreshed a linked Sheets chart with ID %s", presentationChartId)
জাভা
import com.google.api.client.googleapis.json.GoogleJsonError;
import com.google.api.client.googleapis.json.GoogleJsonResponseException;
import com.google.api.client.http.HttpRequestInitializer;
import com.google.api.client.http.javanet.NetHttpTransport;
import com.google.api.client.json.gson.GsonFactory;
import com.google.api.services.slides.v1.Slides;
import com.google.api.services.slides.v1.SlidesScopes;
import com.google.api.services.slides.v1.model.BatchUpdatePresentationRequest;
import com.google.api.services.slides.v1.model.BatchUpdatePresentationResponse;
import com.google.api.services.slides.v1.model.RefreshSheetsChartRequest;
import com.google.api.services.slides.v1.model.Request;
import com.google.auth.http.HttpCredentialsAdapter;
import com.google.auth.oauth2.GoogleCredentials;

import java.io.IOException;
import java.util.ArrayList;
import java.util.Collections;
import java.util.List;

/* Class to demonstrate the use of Slides Refresh Chart API */
public class RefreshSheetsChart {
  /**
   * Refresh the sheets charts.
   *
   * @param presentationId      - id of the presentation.
   * @param presentationChartId - id of the presentation chart.
   * @return presentation chart id
   * @throws IOException - if credentials file not found.
   */
  public static BatchUpdatePresentationResponse refreshSheetsChart(
      String presentationId, String presentationChartId) throws IOException {
        /* Load pre-authorized user credentials from the environment.
           TODO(developer) - See https://developers.google.com/identity for
            guides on implementing OAuth2 for your application. */
    GoogleCredentials credentials = GoogleCredentials.getApplicationDefault()
        .createScoped(Collections.singleton(SlidesScopes.PRESENTATIONS));
    HttpRequestInitializer requestInitializer = new HttpCredentialsAdapter(
        credentials);

    // Create the slides API client
    Slides service = new Slides.Builder(new NetHttpTransport(),
        GsonFactory.getDefaultInstance(),
        requestInitializer)
        .setApplicationName("Slides samples")
        .build();

    List<Request> requests = new ArrayList<>();

    // Refresh an existing linked Sheets chart embedded a presentation.
    requests.add(new Request()
        .setRefreshSheetsChart(new RefreshSheetsChartRequest()
            .setObjectId(presentationChartId)));

    BatchUpdatePresentationResponse response = null;
    try {
      // Execute the request.
      BatchUpdatePresentationRequest body =
          new BatchUpdatePresentationRequest().setRequests(requests);
      response = service.presentations().batchUpdate(presentationId, body).execute();
      System.out.println("Refreshed a linked Sheets chart with ID " + presentationChartId);
    } catch (GoogleJsonResponseException e) {
      // TODO(developer) - handle error appropriately
      GoogleJsonError error = e.getDetails();
      if (error.getCode() == 400) {
        System.out.printf("Presentation chart not found with id '%s'.\n", presentationChartId);
      } else if (error.getCode() == 404) {
        System.out.printf("Presentation not found with id '%s'.\n", presentationId);
      } else {
        throw e;
      }
    }
    return response;
  }
}
জাভাস্ক্রিপ্ট
function refreshSheetsChart(presentationId, presentationChartId, callback) {
  const requests = [{
    refreshSheetsChart: {
      objectId: presentationChartId,
    },
  }];
  // Execute the request.
  try {
    gapi.client.slides.presentations.batchUpdate({
      presentationId: presentationId,
      requests: requests,
    }).then((batchUpdateResponse) => {
      console.log(`Refreshed a linked Sheets chart with ID: ${presentationChartId}`);
      if (callback) callback(batchUpdateResponse.result);
    });
  } catch (err) {
    document.getElementById('content').innerText = err.message;
    return;
  }
}
Node.js
/**
 * Refreshes an embedded sheet chart.
 * @param {string} presentationId The presentation ID.
 * @param {string} presentationChartId The presentation's chart ID.
 */
async function refreshSheetsChart(presentationId, presentationChartId) {
  const {GoogleAuth} = require('google-auth-library');
  const {google} = require('googleapis');

  const auth = new GoogleAuth({
    scopes: 'https://www.googleapis.com/auth/presentations',
  });

  const service = google.slides({version: 'v1', auth});

  const requests = [
    {
      refreshSheetsChart: {
        objectId: presentationChartId,
      },
    },
  ];

  // Execute the request.
  try {
    const batchUpdateResponse = await service.presentations.batchUpdate({
      presentationId,
      resource: {
        requests,
      },
    });
    console.log(
        `Refreshed a linked Sheets chart with ID: ${presentationChartId}`,
    );
    return batchUpdateResponse.data;
  } catch (err) {
    // TODO (developer) - Handle exception
    throw err;
  }
}
পিএইচপি
use Google\Client;
use Google\Service\Drive;
use Google\Service\Slides;
use Google\Service\Slides\BatchUpdatePresentationRequest;

function refreshSheetsChart($presentationId, $presentationChartId)
{
    /* Load pre-authorized user credentials from the environment.
       TODO(developer) - See https://developers.google.com/identity for
        guides on implementing OAuth2 for your application. */
    $client = new Google\Client();
    $client->useApplicationDefaultCredentials();
    $client->addScope(Google\Service\Drive::DRIVE);
    $slidesService = new Google_Service_Slides($client);
    try {

        $requests = array();
        $requests[] = new Google_Service_Slides_Request(array(
            'refreshSheetsChart' => array(
                'objectId' => $presentationChartId
            )
        ));

        // Execute the request.
        $batchUpdateRequest = new Google_Service_Slides_BatchUpdatePresentationRequest(array(
            'requests' => $requests
        ));
        $response = $slidesService->presentations->batchUpdate($presentationId, $batchUpdateRequest);
        printf("Refreshed a linked Sheets chart with ID: %s\n", $response->getPresentationId());
        return $response;
    } catch (Exception $e) {
        echo 'Message: ' . $e->getMessage();
    }
}
পাইথন
import google.auth
from googleapiclient.discovery import build
from googleapiclient.errors import HttpError


def refresh_sheets_chart(presentation_id, presentation_chart_id):
  """
  refresh_sheets_chart the user has access to.
  Load pre-authorized user credentials from the environment.
  TODO(developer) - See https://developers.google.com/identity
  for guides on implementing OAuth2 for the application.
  """
  creds, _ = google.auth.default()
  # pylint: disable=maybe-no-member
  try:
    slides_service = build("slides", "v1", credentials=creds)
    # Refresh an existing linked Sheets chart embedded in a presentation.
    requests = [{"refreshSheetsChart": {"objectId": presentation_chart_id}}]

    # Execute the request.
    body = {"requests": requests}
    response = (
        slides_service.presentations()
        .batchUpdate(presentationId=presentation_id, body=body)
        .execute()
    )
    print(f"Refreshed a linked Sheets chart with ID:{presentation_chart_id}")
    return response
  except HttpError as error:
    print(f"An error occurred: {error}")
    return error


if __name__ == "__main__":
  # Put the presentation_id, presentation_chart_id
  # to be submitted.
  refresh_sheets_chart(
      "10QnVUx1X2qHsL17WUidGpPh_SQhXYx40CgIxaKk8jU4", "1107320627"
  )
রুবি
# Refresh an existing linked Sheets chart embedded in a presentation.
requests = [{
  refresh_sheets_chart: {
    object_id_prop: presentation_chart_id
  }
}]

# Execute the request.
req = Google::Apis::SlidesV1::BatchUpdatePresentationRequest.new(requests: requests)
response = slides_service.batch_update_presentation(presentation_id, req)

puts "Refreshed a linked Sheets chart with ID: #{presentation_chart_id}"