
คุณสามารถใช้การแสดงภาพข้อมูลจากชุมชนเป็นตัวกรองแผนภูมิ โดยกรอง รายงานผ่านการโต้ตอบด้วยการแสดงภาพข้อมูลจากชุมชน
วิธีการทำงานของตัวกรองแผนภูมิการแสดงภาพข้อมูลจากชุมชน
หากต้องการใช้การแสดงภาพข้อมูลจากชุมชนเป็นตัวกรองแผนภูมิ คุณจะต้องมีคุณสมบัติดังนี้
- กําหนดค่าพร็อพเพอร์ตี้
config.interactions - เขียนโค้ดที่เรียกใช้
dscc.sendInteraction()พร้อมข้อมูลตัวกรอง
การกำหนดการโต้ตอบ
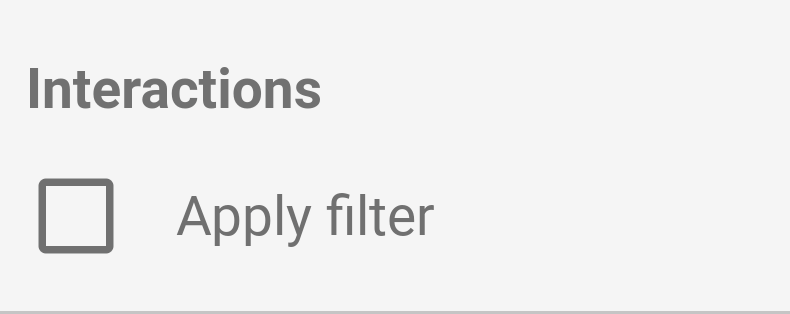
หากการแสดงภาพรองรับการโต้ตอบ คุณควร ในการกำหนดค่าของคุณ เมื่อกำหนดไว้ ช่องทำเครื่องหมายจะปรากฏใน แผงคุณสมบัติ
ตัวอย่าง config.interactions
{
  "data": ...,
  "style": ...,
  "interactions": [
    {
      "id": "interactionsConfigId",
      "supportedActions": ["FILTER"]
    }
  ]
}
กำลังเขียนโค้ดสำหรับตัวกรอง
ใช้ dscc.sendInteraction() เพื่อเชื่อมโยงการโต้ตอบของผู้ใช้กับการดำเนินการของตัวกรอง
ตัวอย่าง
const handleInteraction = () => {
  // this is the interactionId defined in the config
  const interactionId = "interactionConfigId";

  // the ID of the field you want to filter on
  const dimensionId = "qt_ky8sltutsb";

  // the value of the field you want to filter on
  const value = "USA";

  // the interaction type - only FILTER is supported right now
  const FILTER = dscc.InteractionType.FILTER;

  let interactionData = {
    concepts: [dimensionId],
    values: [[value]]
  };

  // send Looker Studio an instruction to filter other charts in the dashboard
  dscc.sendInteraction(interactionId, FILTER, interactionData);
};
Looker Studio จะไม่สนใจข้อความที่ส่งจาก dscc.sendInteraction หากรายงาน
ตัวแก้ไขยังไม่ได้เปิดใช้ "ตัวกรอง" การโต้ตอบหรือการแสดงภาพ
การติดตามสถานะตัวกรอง
ออบเจ็กต์ data ที่ Looker Studio ส่งไปยังการแสดงข้อมูลผ่านภาพจะให้ข้อมูล
เกี่ยวกับการโต้ตอบ
ตัวอย่าง data.interactions
"onClick": {
  "value": {
    "type": "FILTER",
      "data": {
      "concepts": [
        "qt_h6oibrb6wb",
        "qt_i6oibrb6wb"
      ],
        "values": [
          [
            "Afternoon",
            "Sunday"
          ],
          [
            "Afternoon",
            "Thursday"
          ],
          [
            "Morning",
            "Tuesday"
          ]
        ]
    }
  },
  "supportedActions": [
    "FILTER"
  ]
}
หากไม่ได้ระบุ value.data แสดงว่าขณะนี้การแสดงภาพกำลังกรองรายการอื่นๆ
ของแดชบอร์ดด้วย
ตัวอย่าง
const barHighlighting = (interactionsById) => {
  // the interactionId defined in the config
  const interactionId = "interactionConfigId";

  const interactionField = interactionsById[interactionId];

  // if filter is selected
  const filterSelected = interactionField.type === "FILTER";
  // if the viz is currently acting as a filter
  const filterHasData = "data" in interactionField;

  if (filterSelected && filterHasData){
    // call the highlightBar function on the selected data
    highlightBar(interactionField.data);
  } else {
    // clear highlighting if no data selected
    clearHighlight()
  }
}
กำลังสร้าง interactionData
ออบเจ็กต์ interactionData กําหนดวิธีที่ Looker Studio จะกรอง
หน้าแดชบอร์ด
ตัวกรองมิติข้อมูลเดียว
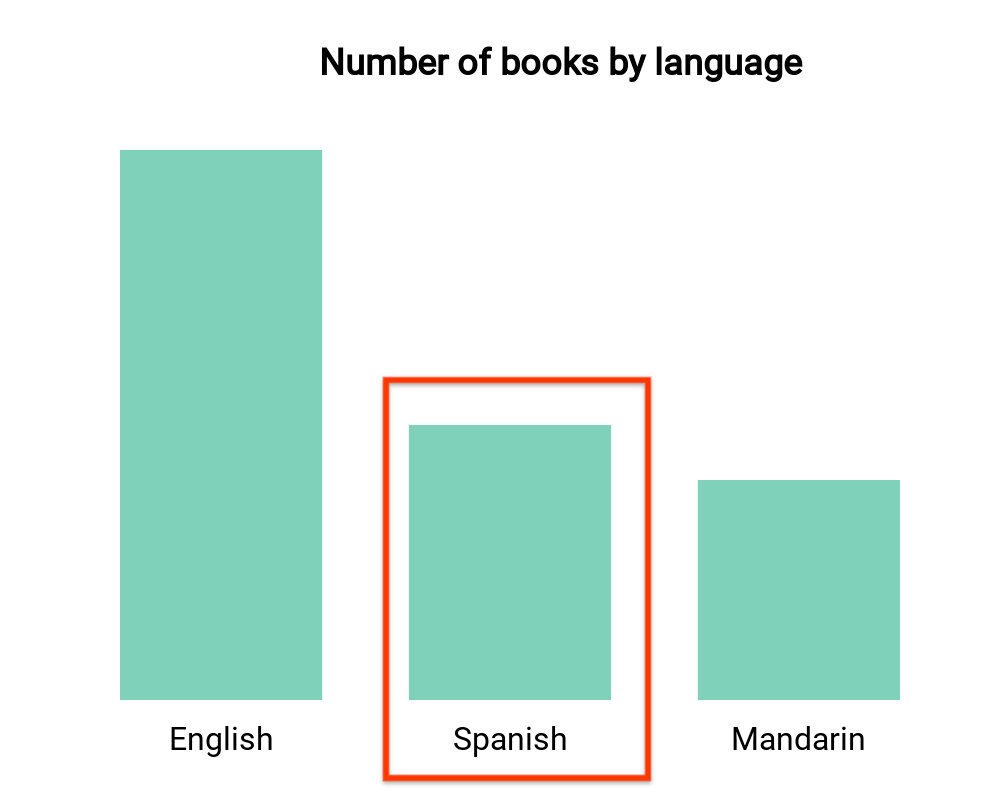
แผนภูมิแท่งนี้จะแสดงจำนวนหนังสือตามภาษา (1 มิติและ 1 รายการ
) สมมติว่าผู้ใช้เลือกแถบที่ตรงกับหนังสือภาษาสเปนและ
คุณต้องการเลือกกรองส่วนที่เหลือในแดชบอร์ด บัญชี
interactionData จะมีลักษณะดังนี้
var interactionData = {
  "concepts": ["languageDimensionId"],
  "values": [["Spanish"]]
}
ตัวกรองมิติข้อมูลหลายรายการ
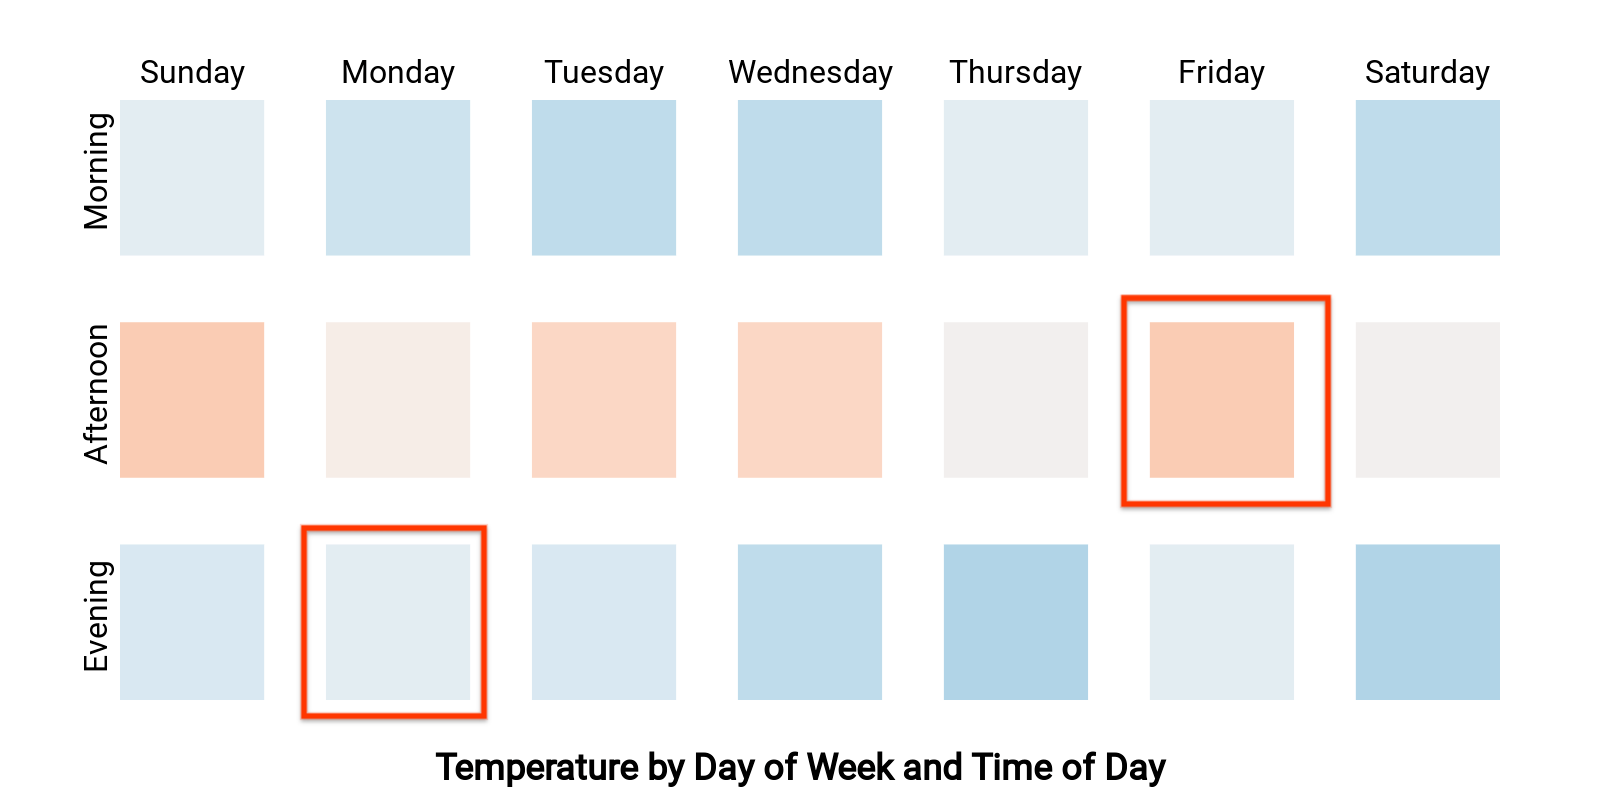
แผนที่ความหนาแน่นนี้แสดงอุณหภูมิตามวันในสัปดาห์และเวลาของวัน (2 มิติ
และเมตริก 1 รายการ) สมมติว่าผู้ใช้เลือกเซลล์ที่ตรงกับ "Monday
ตอนเย็น" และ "บ่ายวันศุกร์" และต้องการกรองส่วนที่เหลือของ
หน้าแดชบอร์ดเพื่อแสดงเฉพาะข้อมูลจาก "เย็นวันจันทร์" หรือ "วันศุกร์
บ่าย"interactionData ของคุณจะมีลักษณะดังนี้
var interactionData = {
  "concepts": ["dayOfWeekDimensionId", "timeOfDayDimensionId"],
  "values": [
    ["Monday", "evening"],
    ["Friday", "afternoon"]
  ]
}