Page Summary
-
The dataset provides 15-day atmospheric forecasts from ECMWF IFS at 0.25-degree resolution, updated every 12 hours and available since 2024-11-12.
-
It includes numerous atmospheric and land surface variables like wind, temperature, humidity, pressure, precipitation, and soil properties at various levels and depths.
-
Data is available through ECMWF Open Data and Google Cloud, licensed under CC-BY-4.0 for commercial use with attribution.
-
The dataset can be explored and analyzed using Google Earth Engine, with examples provided for accessing and visualizing the data.
- Dataset Availability
- 2024-11-12T12:00:00Z–2026-06-24T06:00:00Z
- Dataset Producer
- ECMWF
- Cadence
- 12 Hours
- Tags
Description
This dataset contains 15-day forecasts of the atmospheric model variables generated by the ECMWF Integrated Forecasting System (IFS) at 0.25 degree resolution. We refer to these as Near-Realtime (NRT) because new products are released twice a day after the release of the ECMWF realtime forecast data, of which this is a subset. Data may be distributed and used commercially with proper attribution.
Products are available in Earth Engine starting with the implementation of Cycle 49r1 on 2024/11/12; earlier products are not included. For general information about how to use ECMWF NRT datasets, see their user documentation. Sources files are available in the Google Cloud marketplace.
Bands
Bands
Pixel size: 28000 meters (all bands)
| Name | Units | Min | Max | Pixel Size | Description |
|---|---|---|---|---|---|
u_component_of_wind_100m_sfc |
m/s | -53.36* | 53.26* | 28000 meters | The horizontal speed of air moving towards the east, at a height of 100 meters above the surface of the Earth. |
v_component_of_wind_100m_sfc |
m/s | -49.45* | 63.75* | 28000 meters | The horizontal speed of air moving towards the north, at a height of 100 meters above the surface of the Earth. |
u_component_of_wind_10m_sfc |
m/s | -46.87* | 46.25* | 28000 meters | The horizontal speed of air moving towards the east, at a height of 10 meters above the surface of the Earth. |
v_component_of_wind_10m_sfc |
m/s | -43.74* | 57.4* | 28000 meters | The horizontal speed of air moving towards the north, at a height of 10 meters above the surface of the Earth. |
dewpoint_temperature_2m_sfc |
°C | -79.58* | 30.25* | 28000 meters | The temperature to which the air, at 2 meters above the surface of the Earth, would have to be cooled for saturation to occur. |
temperature_2m_sfc |
°C | -79.58* | 46.33* | 28000 meters | The temperature of air at 2m above the surface of land, sea or in-land waters. |
snow_albedo_sfc |
Dimensionless | 0.5* | 0.85* | 28000 meters | The fraction of solar (shortwave) radiation reflected by snow across the solar spectrum. |
eastward_turbulent_surface_stress_sfc |
Pa s | -1.23116e+07* | 1.49405e+07* | 28000 meters | The accumulated stress on the Earth's surface in the eastward direction due to both the turbulent interactions between the atmosphere and the surface, and to turbulent orographic form drag. |
divergence_pl100 |
Pa s | -0.0012* | 0.002* | 28000 meters | The rate at which air is spreading out horizontally from a point, per square meter, measured at a pressure level of 100 hPa. This parameter is positive for air that is spreading out, or diverging, and negative for the opposite, for air that is concentrating, or converging. |
divergence_pl1000 |
Pa s | -0.0018* | 0.0001* | 28000 meters | The rate at which air is spreading out horizontally from a point, per square meter, measured at a pressure level of 1000 hPa. This parameter is positive for air that is spreading out, or diverging, and negative for the opposite, for air that is concentrating, or converging. |
divergence_pl150 |
Pa s | -0.001* | 0.0016* | 28000 meters | The rate at which air is spreading out horizontally from a point, per square meter, measured at a pressure level of 150 hPa. This parameter is positive for air that is spreading out, or diverging, and negative for the opposite, for air that is concentrating, or converging. |
divergence_pl200 |
Pa s | -0.001* | 0.0012* | 28000 meters | The rate at which air is spreading out horizontally from a point, per square meter, measured at a pressure level of 200 hPa. This parameter is positive for air that is spreading out, or diverging, and negative for the opposite, for air that is concentrating, or converging. |
divergence_pl250 |
Pa s | -0.001* | 0.0011* | 28000 meters | The rate at which air is spreading out horizontally from a point, per square meter, measured at a pressure level of 250 hPa. This parameter is positive for air that is spreading out, or diverging, and negative for the opposite, for air that is concentrating, or converging. |
divergence_pl300 |
Pa s | -0.0014* | 0.0011* | 28000 meters | The rate at which air is spreading out horizontally from a point, per square meter, measured at a pressure level of 300 hPa. This parameter is positive for air that is spreading out, or diverging, and negative for the opposite, for air that is concentrating, or converging. |
divergence_pl400 |
Pa s | -0.001* | 0.001* | 28000 meters | The rate at which air is spreading out horizontally from a point, per square meter, measured at a pressure level of 400 hPa. This parameter is positive for air that is spreading out, or diverging, and negative for the opposite, for air that is concentrating, or converging. |
divergence_pl50 |
Pa s | -0.0013* | 0.001* | 28000 meters | The rate at which air is spreading out horizontally from a point, per square meter, measured at a pressure level of 50 hPa. This parameter is positive for air that is spreading out, or diverging, and negative for the opposite, for air that is concentrating, or converging. |
divergence_pl500 |
Pa s | -0.001* | 0.001* | 28000 meters | The rate at which air is spreading out horizontally from a point, per square meter, measured at a pressure level of 500 hPa. This parameter is positive for air that is spreading out, or diverging, and negative for the opposite, for air that is concentrating, or converging. |
divergence_pl600 |
Pa s | -0.0011* | 0.001* | 28000 meters | The rate at which air is spreading out horizontally from a point, per square meter, measured at a pressure level of 600 hPa. This parameter is positive for air that is spreading out, or diverging, and negative for the opposite, for air that is concentrating, or converging. |
divergence_pl700 |
Pa s | -0.0012* | 0.0009* | 28000 meters | The rate at which air is spreading out horizontally from a point, per square meter, measured at a pressure level of 700 hPa. This parameter is positive for air that is spreading out, or diverging, and negative for the opposite, for air that is concentrating, or converging. |
divergence_pl850 |
Pa s | -0.0011* | 0.001* | 28000 meters | The rate at which air is spreading out horizontally from a point, per square meter, measured at a pressure level of 850 hPa. This parameter is positive for air that is spreading out, or diverging, and negative for the opposite, for air that is concentrating, or converging. |
divergence_pl925 |
Pa s | -0.0016* | 0.0011* | 28000 meters | The rate at which air is spreading out horizontally from a point, per square meter, measured at a pressure level of 925 hPa. This parameter is positive for air that is spreading out, or diverging, and negative for the opposite, for air that is concentrating, or converging. |
geopotential_height_pl100 |
gpm | 14693.9* | 16815.5* | 28000 meters | A measure of the height of a point in the atmosphere in relation to its potential energy, at a pressure level of 100 hPa. It is calculated by dividing the geopotential by the Earth's mean gravitational acceleration, g. |
geopotential_height_pl1000 |
gpm | -647.25* | 452.31* | 28000 meters | A measure of the height of a point in the atmosphere in relation to its potential energy, at a pressure level of 1000 hPa. It is calculated by dividing the geopotential by the Earth's mean gravitational acceleration, g. |
geopotential_height_pl150 |
gpm | 12279.1* | 14446* | 28000 meters | A measure of the height of a point in the atmosphere in relation to its potential energy, at a pressure level of 150 hPa. It is calculated by dividing the geopotential by the Earth's mean gravitational acceleration, g. |
geopotential_height_pl200 |
gpm | 10524.5* | 12608.8* | 28000 meters | A measure of the height of a point in the atmosphere in relation to its potential energy, at a pressure level of 200 hPa. It is calculated by dividing the geopotential by the Earth's mean gravitational acceleration, g. |
geopotential_height_pl250 |
gpm | 9148.03* | 11099.8* | 28000 meters | A measure of the height of a point in the atmosphere in relation to its potential energy, at a pressure level of 250 hPa. It is calculated by dividing the geopotential by the Earth's mean gravitational acceleration, g. |
geopotential_height_pl300 |
gpm | 7999.95* | 9810.31* | 28000 meters | A measure of the height of a point in the atmosphere in relation to its potential energy, at a pressure level of 300 hPa. It is calculated by dividing the geopotential by the Earth's mean gravitational acceleration, g. |
geopotential_height_pl400 |
gpm | 6111.43* | 7694.22* | 28000 meters | A measure of the height of a point in the atmosphere in relation to its potential energy, at a pressure level of 400 hPa. It is calculated by dividing the geopotential by the Earth's mean gravitational acceleration, g. |
geopotential_height_pl50 |
gpm | 18601.5* | 20939.8* | 28000 meters | A measure of the height of a point in the atmosphere in relation to its potential energy, at a pressure level of 50 hPa. It is calculated by dividing the geopotential by the Earth's mean gravitational acceleration, g. |
geopotential_height_pl500 |
gpm | 4627.77* | 5974.44* | 28000 meters | A measure of the height of a point in the atmosphere in relation to its potential energy, at a pressure level of 500 hPa. It is calculated by dividing the geopotential by the Earth's mean gravitational acceleration, g. |
geopotential_height_pl600 |
gpm | 3384.05* | 4526.21* | 28000 meters | A measure of the height of a point in the atmosphere in relation to its potential energy, at a pressure level of 600 hPa. It is calculated by dividing the geopotential by the Earth's mean gravitational acceleration, g. |
geopotential_height_pl700 |
gpm | 2251.74* | 3281.08* | 28000 meters | A measure of the height of a point in the atmosphere in relation to its potential energy, at a pressure level of 700 hPa. It is calculated by dividing the geopotential by the Earth's mean gravitational acceleration, g. |
geopotential_height_pl850 |
gpm | 742.93* | 1711.14* | 28000 meters | A measure of the height of a point in the atmosphere in relation to its potential energy, at a pressure level of 850 hPa. It is calculated by dividing the geopotential by the Earth's mean gravitational acceleration, g. |
geopotential_height_pl925 |
gpm | 32.27* | 1057.44* | 28000 meters | A measure of the height of a point in the atmosphere in relation to its potential energy, at a pressure level of 925 hPa. It is calculated by dividing the geopotential by the Earth's mean gravitational acceleration, g. |
land_sea_mask_sfc |
Dimensionless | 0 | 1 | 28000 meters | The proportion of land, as opposed to ocean or inland waters (lakes, reservoirs, rivers and coastal waters). |
mean_sea_level_pressure_sfc |
Pa | 92686.5* | 106341* | 28000 meters | A measure of the weight that all the air in a column vertically above the area of Earth's surface would have at that point, if the point were located at the mean sea level, calculated over all surfaces. |
most_unstable_convective_available_potential_energy_sfc |
J/kg | 0* | 9833.5* | 28000 meters | The parcel with the most Convective Available Potential Energy (CAPE, the amount of energy available for convection) found in the atmosphere from the surface up to 350 hPa. |
northward_turbulent_surface_stress_sfc |
Pa s | -6.43163e+06* | 8.478e+06* | 28000 meters | The accumulated stress on the Earth's surface in the northward direction due to both the turbulent interactions between the atmosphere and the surface, and to turbulent orographic form drag. |
precipitation_type_sfc |
0 | 12 | 28000 meters | The type of precipitation at the surface:
|
|
specific_humidity_pl100 |
Mass fraction | 0* | 2.5e-05* | 28000 meters | The mass of water vapour per kilogram of moist air (the sum of the dry air, water vapour, cloud liquid, cloud ice, rain and falling snow) at a pressure level of 100 hPa. |
specific_humidity_pl1000 |
Mass fraction | 0* | 0.027* | 28000 meters | The mass of water vapour per kilogram of moist air (the sum of the dry air, water vapour, cloud liquid, cloud ice, rain and falling snow) at a pressure level of 1000 hPa. |
specific_humidity_pl150 |
Mass fraction | 0* | 0.00017* | 28000 meters | The mass of water vapour per kilogram of moist air (the sum of the dry air, water vapour, cloud liquid, cloud ice, rain and falling snow) at a pressure level of 150 hPa. |
specific_humidity_pl200 |
Mass fraction | 0* | 0.00089* | 28000 meters | The mass of water vapour per kilogram of moist air (the sum of the dry air, water vapour, cloud liquid, cloud ice, rain and falling snow) at a pressure level of 200 hPa. |
specific_humidity_pl250 |
Mass fraction | 0* | 0.0024* | 28000 meters | The mass of water vapour per kilogram of moist air (the sum of the dry air, water vapour, cloud liquid, cloud ice, rain and falling snow) at a pressure level of 250 hPa. |
specific_humidity_pl300 |
Mass fraction | 0* | 0.0044* | 28000 meters | The mass of water vapour per kilogram of moist air (the sum of the dry air, water vapour, cloud liquid, cloud ice, rain and falling snow) at a pressure level of 300 hPa. |
specific_humidity_pl400 |
Mass fraction | 0* | 0.0064* | 28000 meters | The mass of water vapour per kilogram of moist air (the sum of the dry air, water vapour, cloud liquid, cloud ice, rain and falling snow) at a pressure level of 400 hPa. |
specific_humidity_pl50 |
Mass fraction | 0* | 7.3e-06* | 28000 meters | The mass of water vapour per kilogram of moist air (the sum of the dry air, water vapour, cloud liquid, cloud ice, rain and falling snow) at a pressure level of 50 hPa. |
specific_humidity_pl500 |
Mass fraction | 0* | 0.0097* | 28000 meters | The mass of water vapour per kilogram of moist air (the sum of the dry air, water vapour, cloud liquid, cloud ice, rain and falling snow) at a pressure level of 500 hPa. |
specific_humidity_pl600 |
Mass fraction | 0* | 0.012* | 28000 meters | The mass of water vapour per kilogram of moist air (the sum of the dry air, water vapour, cloud liquid, cloud ice, rain and falling snow) at a pressure level of 600 hPa. |
specific_humidity_pl700 |
Mass fraction | 0* | 0.015* | 28000 meters | The mass of water vapour per kilogram of moist air (the sum of the dry air, water vapour, cloud liquid, cloud ice, rain and falling snow) at a pressure level of 700 hPa. |
specific_humidity_pl850 |
Mass fraction | 0* | 0.019* | 28000 meters | The mass of water vapour per kilogram of moist air (the sum of the dry air, water vapour, cloud liquid, cloud ice, rain and falling snow) at a pressure level of 850 hPa. |
specific_humidity_pl925 |
Mass fraction | 0* | 0.024* | 28000 meters | The mass of water vapour per kilogram of moist air (the sum of the dry air, water vapour, cloud liquid, cloud ice, rain and falling snow) at a pressure level of 925 hPa. |
relative_humidity_pl100 |
% | -6.15* | 137.32* | 28000 meters | The water vapour pressure as a percentage of the value at which the air becomes saturated (the point at which water vapour begins to condense into liquid water or deposition into ice) at a pressure level of 100 hPa. |
relative_humidity_pl1000 |
% | -8.75* | 131.46* | 28000 meters | The water vapour pressure as a percentage of the value at which the air becomes saturated (the point at which water vapour begins to condense into liquid water or deposition into ice) at a pressure level of 1000 hPa. |
relative_humidity_pl150 |
% | -5.93* | 160.47* | 28000 meters | The water vapour pressure as a percentage of the value at which the air becomes saturated (the point at which water vapour begins to condense into liquid water or deposition into ice) at a pressure level of 150 hPa. |
relative_humidity_pl200 |
% | -6.54* | 145.93* | 28000 meters | The water vapour pressure as a percentage of the value at which the air becomes saturated (the point at which water vapour begins to condense into liquid water or deposition into ice) at a pressure level of 200 hPa. |
relative_humidity_pl250 |
% | -7.08* | 143.48* | 28000 meters | The water vapour pressure as a percentage of the value at which the air becomes saturated (the point at which water vapour begins to condense into liquid water or deposition into ice) at a pressure level of 250 hPa. |
relative_humidity_pl300 |
% | -8.08* | 136.92* | 28000 meters | The water vapour pressure as a percentage of the value at which the air becomes saturated (the point at which water vapour begins to condense into liquid water or deposition into ice) at a pressure level of 300 hPa. |
relative_humidity_pl400 |
% | -12.31* | 136.92* | 28000 meters | The water vapour pressure as a percentage of the value at which the air becomes saturated (the point at which water vapour begins to condense into liquid water or deposition into ice) at a pressure level of 400 hPa. |
relative_humidity_pl50 |
% | 0.021* | 140.17* | 28000 meters | The water vapour pressure as a percentage of the value at which the air becomes saturated (the point at which water vapour begins to condense into liquid water or deposition into ice) at a pressure level of 50 hPa. |
relative_humidity_pl500 |
% | -10.16* | 126.13* | 28000 meters | The water vapour pressure as a percentage of the value at which the air becomes saturated (the point at which water vapour begins to condense into liquid water or deposition into ice) at a pressure level of 500 hPa. |
relative_humidity_pl600 |
% | -8.73* | 132.07* | 28000 meters | The water vapour pressure as a percentage of the value at which the air becomes saturated (the point at which water vapour begins to condense into liquid water or deposition into ice) at a pressure level of 600 hPa. |
relative_humidity_pl700 |
% | -8.6* | 131.5* | 28000 meters | The water vapour pressure as a percentage of the value at which the air becomes saturated (the point at which water vapour begins to condense into liquid water or deposition into ice) at a pressure level of 700 hPa. |
relative_humidity_pl850 |
% | -7.04* | 131.48* | 28000 meters | The water vapour pressure as a percentage of the value at which the air becomes saturated (the point at which water vapour begins to condense into liquid water or deposition into ice) at a pressure level of 850 hPa. |
relative_humidity_pl925 |
% | -9.61* | 132.04* | 28000 meters | The water vapour pressure as a percentage of the value at which the air becomes saturated (the point at which water vapour begins to condense into liquid water or deposition into ice) at a pressure level of 925 hPa. |
runoff_sfc |
m | 0* | 1.85* | 28000 meters | A cumulative measurement (since forecast hour 0) of the amount of water not absorbed by the soil from rainfall, snow melt, etc. It is the depth the water would have if it were spread evenly over the grid box. |
sea_ice_thickness_sfc |
m | 0* | 9999* | 28000 meters | Sea ice thickness. |
skin_temperature_sfc |
°C | -82.08* | 69.6* | 28000 meters | The temperature of the surface of the Earth. It represents the temperature of the uppermost surface layer, which has no heat capacity and so can respond instantaneously to changes in surface fluxes. |
soil_temperature_sol1 |
K | 214.05* | 330.78* | 28000 meters | The temperature of the soil at the middle of layer 1, 0-7 cm below the surface. |
soil_temperature_sol2 |
K | 214.06* | 318.86* | 28000 meters | The temperature of the soil at the middle of layer 2, 7-28 cm below the surface. |
soil_temperature_sol3 |
K | 214.1* | 314.26* | 28000 meters | The temperature of the soil at the middle of layer 3, 28-100 cm below the surface. |
soil_temperature_sol4 |
K | 214.17* | 314.41* | 28000 meters | The temperature of the soil at the middle of layer 4, 100-289 cm below the surface. |
surface_pressure_sfc |
Pa | 47324* | 107445* | 28000 meters | The pressure (force per unit area) of the atmosphere on the surface of land, sea and in-land water. It is a measure of the weight of all the air in a column vertically above the area of the Earth's surface represented at a fixed point. |
surface_net_solar_radiation_sfc |
J/m^2 | 0* | 4.92012e+08* | 28000 meters | A cumulative measurement (since forecast hour 0) of the amount of solar radiation that reaches a horizontal plane at the surface of the Earth (both direct and diffuse) minus the amount reflected by the Earth's surface. |
surface_solar_radiation_downwards_sfc |
J/m^2 | 0* | 6.11336e+08* | 28000 meters | A cumulative measurement (since forecast hour 0) of the amount of solar radiation that reaches a horizontal plane at the surface of the Earth (both direct and diffuse). |
surface_net_thermal_radiation_sfc |
J/m^2 | -2.87438e+08* | 1.48574e+07* | 28000 meters | A cumulative measurement (since forecast hour 0) of the difference between the download and upward thermal radiation at the surface of the Earth, where thermal radiation refers to radiation emitted by the atmosphere, clouds and the surface. |
surface_thermal_radiation_downwards_sfc |
J/m^2 | 0* | 5.89143e+08* | 28000 meters | A cumulative measurement (since forecast hour 0) of the amount of thermal radiation emitted by the atmosphere and clouds that reaches a horizontal plane at the surface of the Earth. |
eastward_surface_sea_water_velocity_sfc |
m/s | -3.77* | 2.03* | 28000 meters | The velocity of sea water moving east. |
northward_surface_sea_water_velocity_sfc |
m/s | -2.74* | 1.82* | 28000 meters | The velocity of sea water moving north. |
temperature_pl100 |
°C | -90.11* | -31.75* | 28000 meters | The temperature of the atmoshere at a pressure level of 100 hPa. |
temperature_pl1000 |
°C | -52.05* | 46.79* | 28000 meters | The temperature of the atmoshere at a pressure level of 1000 hPa. |
temperature_pl150 |
°C | -85.44* | -34.15* | 28000 meters | The temperature of the atmoshere at a pressure level of 150 hPa. |
temperature_pl200 |
°C | -79.16* | -32.29* | 28000 meters | The temperature of the atmoshere at a pressure level of 200 hPa. |
temperature_pl250 |
°C | -74.3* | -23.39* | 28000 meters | The temperature of the atmoshere at a pressure level of 250 hPa. |
temperature_pl300 |
°C | -68.69* | -13.95* | 28000 meters | The temperature of the atmoshere at a pressure level of 300 hPa. |
temperature_pl400 |
°C | -60.07* | -2.25* | 28000 meters | The temperature of the atmoshere at a pressure level of 400 hPa. |
temperature_pl50 |
°C | -91.63* | -18.46* | 28000 meters | The temperature of the atmoshere at a pressure level of 50 hPa. |
temperature_pl500 |
°C | -53.27* | 8.57* | 28000 meters | The temperature of the atmoshere at a pressure level of 500 hPa. |
temperature_pl600 |
°C | -70.11* | 18.69* | 28000 meters | The temperature of the atmoshere at a pressure level of 600 hPa. |
temperature_pl700 |
°C | -69.81* | 24.5* | 28000 meters | The temperature of the atmoshere at a pressure level of 700 hPa. |
temperature_pl850 |
°C | -54.99* | -35.58* | 28000 meters | The temperature of the atmoshere at a pressure level of 850 hPa. |
temperature_pl925 |
°C | -52.38* | 42.02* | 28000 meters | The temperature of the atmoshere at a pressure level of 925 hPa. |
total_column_water_sfc |
kg/m^2 | 0.05* | 127.04* | 28000 meters | The sum of water vapour, liquid water, cloud ice, rain and snow in a column extending from the surface of the Earth to the top of the atmosphere. |
total_column_water_vapour_sfc |
kg/m^2 | 0.05* | 83.54* | 28000 meters | The total amount of water vapour in a column extending from the surface of the Earth to the top of the atmosphere. |
total_precipitation_sfc |
m | 0* | 1.86* | 28000 meters | Cumulative measurement (since forecast hour 0) of the amount of liquid and frozen water, comprising rain and snow, that falls to the Earth's surface. It is the depth the water would have if it were spread evenly over the grid box. |
total_precipitation_rate_sfc |
m/s | 0* | 0.023* | 28000 meters | The mean rate of total precipitation as the water equivalent in meters (the depth it would have if it were spread evenly over the grid box) which falls per second. |
top_net_thermal_radiation_sfc |
J/m^2 | -4.25199e+08* | 28000 meters | Cumulative measurement (since forecast hour 0) of negative Outgoing Longwave Radiation (OLR), the thermal radiation emitted to space at the top of the atmosphere. |
|
u_component_of_wind_pl100 |
m/s | -47.11* | 86.87* | 28000 meters | The horizontal speed of air moving towards the east at a pressure level of 100 hPa. |
u_component_of_wind_pl1000 |
m/s | -38.74* | 39.05* | 28000 meters | The horizontal speed of air moving towards the east at a pressure level of 1000 hPa. |
u_component_of_wind_pl150 |
m/s | -50.5* | 102.75* | 28000 meters | The horizontal speed of air moving towards the east at a pressure level of 150 hPa. |
u_component_of_wind_pl200 |
m/s | -58.21* | 120* | 28000 meters | The horizontal speed of air moving towards the east at a pressure level of 200 hPa. |
u_component_of_wind_pl250 |
m/s | -58.35* | 120.48* | 28000 meters | The horizontal speed of air moving towards the east at a pressure level of 250 hPa. |
u_component_of_wind_pl300 |
m/s | -58.68* | 119.08* | 28000 meters | The horizontal speed of air moving towards the east at a pressure level of 300 hPa. |
u_component_of_wind_pl400 |
m/s | -57.09* | 96.34* | 28000 meters | The horizontal speed of air moving towards the east at a pressure level of 400 hPa. |
u_component_of_wind_pl50 |
m/s | -62.03* | 77.22* | 28000 meters | The horizontal speed of air moving towards the east at a pressure level of 50 hPa. |
u_component_of_wind_pl500 |
m/s | -58.43* | 83.02* | 28000 meters | The horizontal speed of air moving towards the east at a pressure level of 500 hPa. |
u_component_of_wind_pl600 |
m/s | -57.8* | 65.01* | 28000 meters | The horizontal speed of air moving towards the east at a pressure level of 600 hPa. |
u_component_of_wind_pl700 |
m/s | -57.72* | 56.19* | 28000 meters | The horizontal speed of air moving towards the east at a pressure level of 700 hPa. |
u_component_of_wind_pl850 |
m/s | -60.52* | 57.48* | 28000 meters | The horizontal speed of air moving towards the east at a pressure level of 850 hPa. |
u_component_of_wind_pl925 |
m/s | -56.88* | 55.04* | 28000 meters | The horizontal speed of air moving towards the east at a pressure level of 925 hPa. |
v_component_of_wind_pl100 |
m/s | -57.62* | 49.17* | 28000 meters | The horizontal speed of air moving towards the north at a pressure level of 100 hPa. |
v_component_of_wind_pl1000 |
m/s | -40.45* | 43.98* | 28000 meters | The horizontal speed of air moving towards the north at a pressure level of 1000 hPa. |
v_component_of_wind_pl150 |
m/s | -61.4* | 64.33* | 28000 meters | The horizontal speed of air moving towards the north at a pressure level of 150 hPa. |
v_component_of_wind_pl200 |
m/s | -76.17* | 82.86* | 28000 meters | The horizontal speed of air moving towards the north at a pressure level of 200 hPa. |
v_component_of_wind_pl250 |
m/s | -86.18* | 94.55* | 28000 meters | The horizontal speed of air moving towards the north at a pressure level of 250 hPa. |
v_component_of_wind_pl300 |
m/s | -87.37* | 91.05* | 28000 meters | The horizontal speed of air moving towards the north at a pressure level of 300 hPa. |
v_component_of_wind_pl400 |
m/s | -73.27* | 83.39* | 28000 meters | The horizontal speed of air moving towards the north at a pressure level of 400 hPa. |
v_component_of_wind_pl50 |
m/s | -74.6* | 71.44* | 28000 meters | The horizontal speed of air moving towards the north at a pressure level of 50 hPa. |
v_component_of_wind_pl500 |
m/s | -62.97* | 71.87* | 28000 meters | The horizontal speed of air moving towards the north at a pressure level of 500 hPa. |
v_component_of_wind_pl600 |
m/s | -52.43* | 63.38* | 28000 meters | The horizontal speed of air moving towards the north at a pressure level of 600 hPa. |
v_component_of_wind_pl700 |
m/s | -57.63* | 57.62* | 28000 meters | The horizontal speed of air moving towards the north at a pressure level of 700 hPa. |
v_component_of_wind_pl850 |
m/s | -60.95* | 62.67* | 28000 meters | The horizontal speed of air moving towards the north at a pressure level of 850 hPa. |
v_component_of_wind_pl925 |
m/s | -59.31* | 59.9* | 28000 meters | The horizontal speed of air moving towards the north at a pressure level of 925 hPa. |
vorticity_pl100 |
1/s | -0.001* | 0.0012* | 28000 meters | The rotation of air in the horizontal, around a vertical axis, relative to a fixed point on the surface of the Earth at a pressure level of 100 hPa. |
vorticity_pl1000 |
1/s | -0.0033* | 0.002* | 28000 meters | The rotation of air in the horizontal, around a vertical axis, relative to a fixed point on the surface of the Earth at a pressure level of 1000 hPa. |
vorticity_pl150 |
1/s | -0.0012* | 0.0012* | 28000 meters | The rotation of air in the horizontal, around a vertical axis, relative to a fixed point on the surface of the Earth at a pressure level of 150 hPa. |
vorticity_pl200 |
1/s | -0.0018* | 0.0009* | 28000 meters | The rotation of air in the horizontal, around a vertical axis, relative to a fixed point on the surface of the Earth at a pressure level of 200 hPa. |
vorticity_pl250 |
1/s | -0.0021* | 0.0012* | 28000 meters | The rotation of air in the horizontal, around a vertical axis, relative to a fixed point on the surface of the Earth at a pressure level of 250 hPa. |
vorticity_pl300 |
1/s | -0.0026* | 0.0017* | 28000 meters | The rotation of air in the horizontal, around a vertical axis, relative to a fixed point on the surface of the Earth at a pressure level of 300 hPa. |
vorticity_pl400 |
1/s | -0.0031* | 0.0019* | 28000 meters | The rotation of air in the horizontal, around a vertical axis, relative to a fixed point on the surface of the Earth at a pressure level of 400 hPa. |
vorticity_pl50 |
1/s | -0.001* | 0.0011* | 28000 meters | The rotation of air in the horizontal, around a vertical axis, relative to a fixed point on the surface of the Earth at a pressure level of 50 hPa. |
vorticity_pl500 |
1/s | -0.0033* | 0.0022* | 28000 meters | The rotation of air in the horizontal, around a vertical axis, relative to a fixed point on the surface of the Earth at a pressure level of 500 hPa. |
vorticity_pl600 |
1/s | -0.0033* | 0.0022* | 28000 meters | The rotation of air in the horizontal, around a vertical axis, relative to a fixed point on the surface of the Earth at a pressure level of 600 hPa. |
vorticity_pl700 |
1/s | -0.0038* | 0.0022* | 28000 meters | The rotation of air in the horizontal, around a vertical axis, relative to a fixed point on the surface of the Earth at a pressure level of 700 hPa. |
vorticity_pl850 |
1/s | -0.0039* | 0.0023* | 28000 meters | The rotation of air in the horizontal, around a vertical axis, relative to a fixed point on the surface of the Earth at a pressure level of 850 hPa. |
vorticity_pl925 |
1/s | -0.0045* | 0.0025* | 28000 meters | The rotation of air in the horizontal, around a vertical axis, relative to a fixed point on the surface of the Earth at a pressure level of 925 hPa. |
volumetric_soil_moisture_sol1 |
Volume fraction | 0* | 0.77* | 28000 meters | The volume of water in soil layer 1, 0-7 cm below the surface. |
volumetric_soil_moisture_sol2 |
Volume fraction | 0* | 0.77* | 28000 meters | The volume of water in soil layer 2, 7-28 cm below the surface. |
volumetric_soil_moisture_sol3 |
Volume fraction | 0* | 0.77* | 28000 meters | The volume of water in soil layer 3, 28-100 cm below the surface. |
volumetric_soil_moisture_sol4 |
Volume fraction | 0* | 0.77* | 28000 meters | The volume of water in soil layer 4, 100-289 cm below the surface. |
vertical_velocity_pl100 |
Pa s | -5.59* | 3.23* | 28000 meters | The speed of air motion in the upward or downward direction, at a pressure level of 100 hPa. |
vertical_velocity_pl1000 |
Pa s | -5.17* | 11.18* | 28000 meters | The speed of air motion in the upward or downward direction, at a pressure level of 1000 hPa. |
vertical_velocity_pl150 |
Pa s | -13.48* | 4.36* | 28000 meters | The speed of air motion in the upward or downward direction, at a pressure level of 150 hPa. |
vertical_velocity_pl200 |
Pa s | -17.38* | 5.35* | 28000 meters | The speed of air motion in the upward or downward direction, at a pressure level of 200 hPa. |
vertical_velocity_pl250 |
Pa s | -19.85* | 5.28* | 28000 meters | The speed of air motion in the upward or downward direction, at a pressure level of 250 hPa. |
vertical_velocity_pl300 |
Pa s | -21.45* | 6.63* | 28000 meters | The speed of air motion in the upward or downward direction, at a pressure level of 300 hPa. |
vertical_velocity_pl400 |
Pa s | -21.25* | 14.18* | 28000 meters | The speed of air motion in the upward or downward direction, at a pressure level of 400 hPa. |
vertical_velocity_pl50 |
Pa s | -2.38* | 1.92* | 28000 meters | The speed of air motion in the upward or downward direction, at a pressure level of 50 hPa. |
vertical_velocity_pl500 |
Pa s | -23.23* | 15.84* | 28000 meters | The speed of air motion in the upward or downward direction, at a pressure level of 500 hPa. |
vertical_velocity_pl600 |
Pa s | -27.57* | 15.58* | 28000 meters | The speed of air motion in the upward or downward direction, at a pressure level of 600 hPa. |
vertical_velocity_pl700 |
Pa s | -27.71* | 14.34* | 28000 meters | The speed of air motion in the upward or downward direction, at a pressure level of 700 hPa. |
vertical_velocity_pl850 |
Pa s | -20.67* | 15.34* | 28000 meters | The speed of air motion in the upward or downward direction, at a pressure level of 850 hPa. |
vertical_velocity_pl925 |
Pa s | -12.33* | 12.63* | 28000 meters | The speed of air motion in the upward or downward direction, at a pressure level of 925 hPa. |
sea_surface_height_sfc |
m | -2.12* | 9999* | 28000 meters | Sea surface height. |
max_10m_wind_gust_since_last_post_processing_sfc |
m/s | 0* | 72.95* | 28000 meters | Maximum 3 second wind at 10 m height as defined by World Meteorological Organization. Available at forecast hours 0-90 and 150-360. |
max_10m_wind_gust_last_3h_sfc |
m/s | 0* | 76.4* | 28000 meters | The maximum wind gust in the last 3 hours at a height of ten meters above the surface of the Earth. Available at forecast hours 93-144. |
min_2m_temperature_last_3h_sfc |
°C | -273.15* | 44.05* | 28000 meters | The lowest value of 2 meter temperature in the previous 3 hour period. Available at forecast hours 0-144. |
min_2m_temperature_last_6h_sfc |
°C | -79.94* | 44.01* | 28000 meters | The lowest value of 2 meter temperature in the previous 6 hour period. Available at forecast hours 150-360. |
max_2m_temperature_last_3h_sfc |
°C | -273.15* | 47.31* | 28000 meters | The highest value of 2 meter temperature in the previous 3 hour period. Available at forecast hours 0-144. |
max_2m_temperature_last_6h_sfc |
°C | -77.58* | 50.39* | 28000 meters | The highest value of 2 meter temperature in the previous 6 hour period. Available at forecast hours 150-360. |
Image Properties
Image Properties
| Name | Type | Description |
|---|---|---|
| creation_day | INT | Day of the month when the forecast was created. |
| creation_doy | INT | Day of the year when the forecast was created. |
| creation_hour | INT | Hour of the day when the forecast was created. |
| creation_month | INT | Month of the year when the forecast was created. |
| creation_time | INT | Time, in unix epoch milliseconds, when forecast was created. |
| creation_year | INT | Year when the forecast was created. |
| forecast_hours | INT | Hours into the future, relative to |
| forecast_time | INT | Time, in unix epoch milliseconds, of the forecast. |
| model | STRING | The ECMWF forecasting model:
|
| stream | STRING | The stream from which the variables were fetched. See the full list here. |
Terms of Use
Terms of Use
DOIs
Explore with Earth Engine
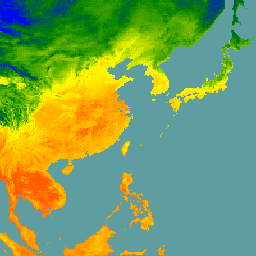
Code Editor (JavaScript)
// Get temperature forecasts created on 2025/03/26T12:00:00Z.
var forecasts = ee.ImageCollection('ECMWF/NRT_FORECAST/IFS/OPER')
                    .filter(ee.Filter.eq('creation_time', 1742990400000))
                    .select('temperature_2m_sfc')
                    .sort('forecast_hours');

// Chart the average forecasted temperature for all of Japan over the next 15
// days.
var japan = ee.FeatureCollection('WM/geoLab/geoBoundaries/600/ADM0')
                .filter(ee.Filter.eq('shapeName', 'Japan'))
                .first()
                .geometry();
print(ui.Chart.image.series({
  'imageCollection': forecasts,
  'region': japan,
  'xProperty': 'forecast_hours',
}));

// Also display the temperature forecast at hour 0.
Map.centerObject(japan);
Map.addLayer(
    forecasts.first().clip(japan), {
      min: -20,
      max: 40,
      palette: ['blue', 'green', 'yellow', 'orange', 'red'],
    },
    'Temperature at forecast hour 0 (deg C)');