Using your visualization
Stay organized with collections
Save and categorize content based on your preferences.
Note: The Community Visualization feature is in Developer Preview. To learn more about upcoming features and improvements during this period, visit the Developer Preview page.
To load a community visualization you've developed, use the location of the
manifest file prefixed by gs://.
- Edit your report
- In the toolbar, click Community visualizations and components
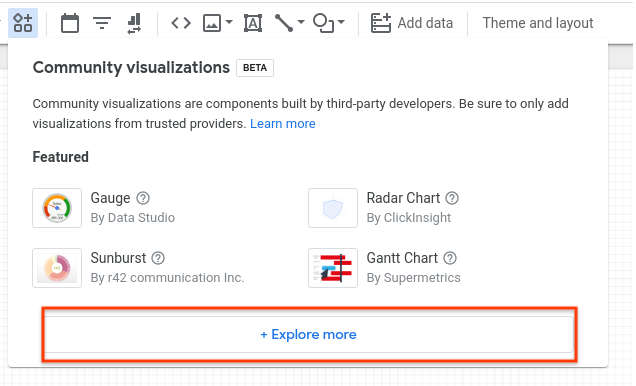
- In the dialog, click Explore more to open the Community Gallery shade
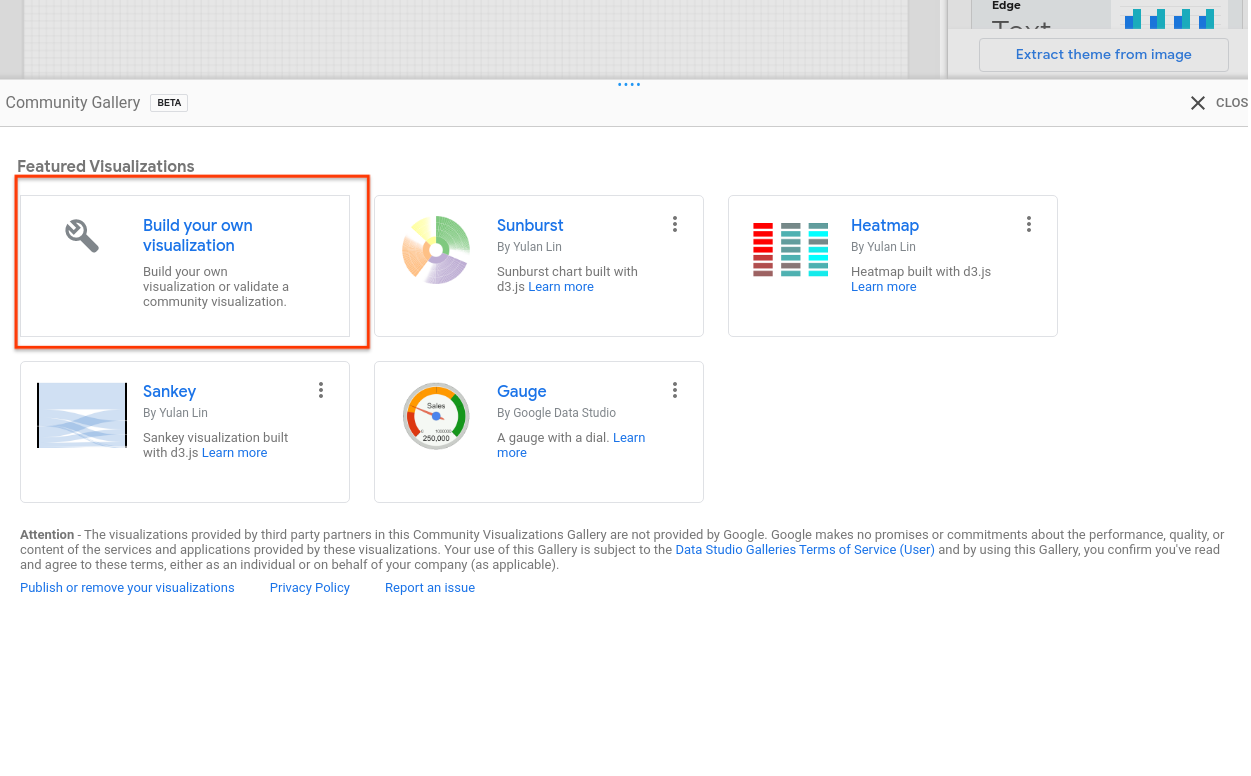
- Click Build your own visualization
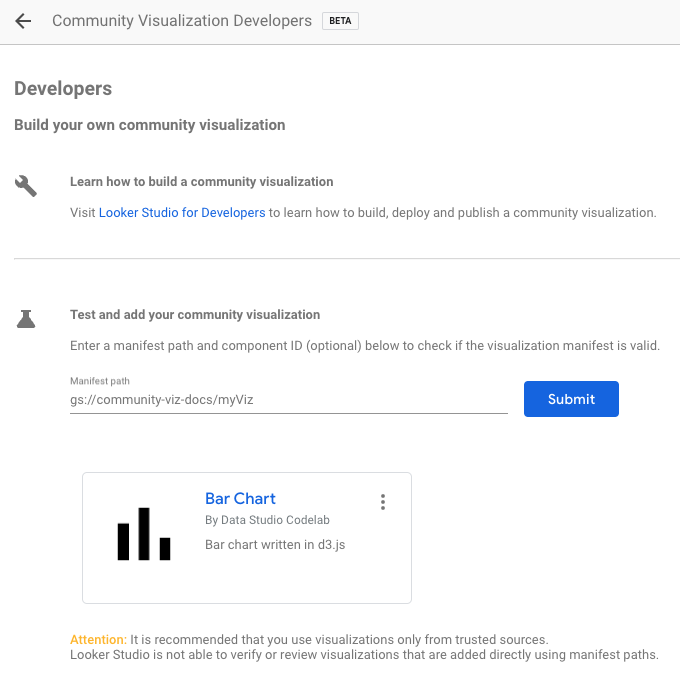
- Enter your Manifest Path and click Submit. One visualization icon
will be rendered for each component in your manifest. Click a visualization
icon to add it to your report.
Next steps
Now that you have written and deployed a community visualization, share the
visualizations that you build.
Except as otherwise noted, the content of this page is licensed under the Creative Commons Attribution 4.0 License, and code samples are licensed under the Apache 2.0 License. For details, see the Google Developers Site Policies. Java is a registered trademark of Oracle and/or its affiliates.
Last updated 2026-05-13 UTC.
[[["Easy to understand","easyToUnderstand","thumb-up"],["Solved my problem","solvedMyProblem","thumb-up"],["Other","otherUp","thumb-up"]],[["Missing the information I need","missingTheInformationINeed","thumb-down"],["Too complicated / too many steps","tooComplicatedTooManySteps","thumb-down"],["Out of date","outOfDate","thumb-down"],["Samples / code issue","samplesCodeIssue","thumb-down"],["Other","otherDown","thumb-down"]],["Last updated 2026-05-13 UTC."],[],[]]
