데이터 시각화 도구를 사용하면 Ads Data Hub에서 얻은 데이터를 이해할 수 있습니다. 또한 그래프 및 기타 시각적 표현이 포함된 보고서를 사용하면 숫자에 비해 데이터 관련 동향과 통계를 더 효과적으로 이해할 수 있습니다.
데이터 스튜디오는 차트와 양방향 데이터 시각화를 만드는 무료 도구입니다. Ads Data Hub는 기본적으로 데이터 스튜디오와 통합되어 데이터 스튜디오에서 결과를 쉽게 확인할 수 있습니다. Ads Data Hub에서 쿼리를 실행한 후 결과를 데이터 스튜디오에서 직접 열 수 있습니다.
목표
이 튜토리얼에서는 다음 방법을 알아봅니다.
- Ads Data Hub에서 템플릿 쿼리 실행
- 데이터 스튜디오에서 쿼리 결과 열기
- 데이터 스튜디오를 사용하여 보고서 만들기
시작하기 전에
이 튜토리얼의 모든 단계를 완료하려면 다음 사항이 필요합니다.
- Ads Data Hub 계정에 대한 액세스 권한
- Ads Data Hub 계정에서 쿼리를 실행할 수 있는 권한
시각화할 결과 생성
이 섹션에서는 Google Ads 인구통계 쿼리를 실행하는 과정을 안내합니다. 다른 쿼리를 사용할 경우 아래 '결과 시각화'의 단계가 적용되지 않습니다.
- Ads Data Hub UI로 이동합니다.
- + 쿼리 만들기를 클릭합니다.
- '분석'에서 템플릿 선택을 클릭합니다.
- Google Ads 섹션에서 '인구통계' 옆의 실행을 클릭합니다.
- '대상 테이블'에서 결과를 쓸 데이터 세트의 정보를 입력합니다.
- '기간'에서 쿼리할 날짜를 선택합니다.
- 실행을 클릭합니다.
결과 시각화
- '작업' 페이지로 이동합니다.
- 방금 실행한 작업을 클릭합니다.
- 탐색 드롭다운을 엽니다.
- 데이터 스튜디오로 탐색을 클릭합니다.
계산된 필드를 사용하여 열 차트 만들기
- 필요한 경우 페이지 상단의 제목을 클릭하여 보고서 이름을 변경합니다.
- '차트' 메뉴에서 막대를 클릭합니다.
gender_id필드는 '측정기준'에 이미 선택되어 있지만, 선택되지 않은 경우 추가합니다.- '세부 측정기준'에서 측정기준 추가를 클릭합니다.
- 메뉴에서
age_group_id를 선택합니다.
- 메뉴에서
- '측정항목'에서 레코드 수를 클릭합니다.
- 필드 만들기를 클릭합니다.
- 필드 이름을 지정합니다(예:
aggregated_users). - 수식에
SUM(aggregated_users)을 입력합니다. - 적용을 클릭합니다.
- 필드 이름을 지정합니다(예:
- 필드 만들기를 클릭합니다.
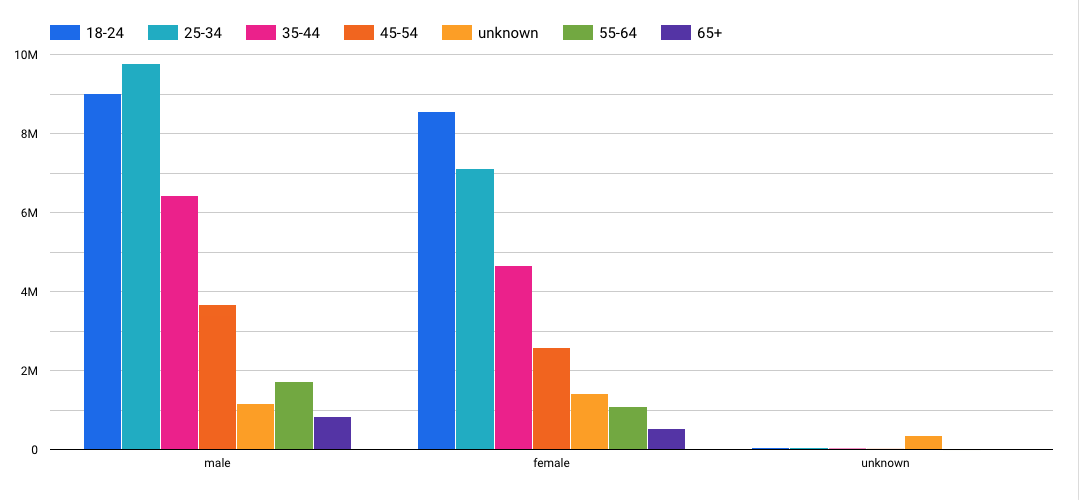
- 아래와 유사한 보고서가 표시됩니다.

다음 단계
- 데이터 스튜디오 보고서를 공유하는 방법을 알아보세요.
