
DevTools
Chrome DevTools is a set of web developer tools built directly into the Google Chrome browser. DevTools lets you edit pages on-the-fly and diagnose problems quickly, which helps you build better websites, faster.
Open DevTools
All of the ways that you can open Chrome DevTools.
What's new in DevTools
Stay up to date with the latest DevTools changes.
DevTools Tips
A series of bite-size videos to help you to learn features in DevTools.
Commands and shortcuts
Quickly accomplish tasks.
Run commands in the command menu
Open the command menu, run commands, open files, see other actions, and more.
Keyboard shortcuts
A comprehensive reference of keyboard shortcuts.
Disable JavaScript
See how a web page looks and behaves when JavaScript is disabled.
Simulate mobile devices with device mode
Simulate devices to build mobile-first websites.
Search across loaded resources
Find text across all loaded resources with the Search panel.
Panels
Discover the power of each DevTools panel.
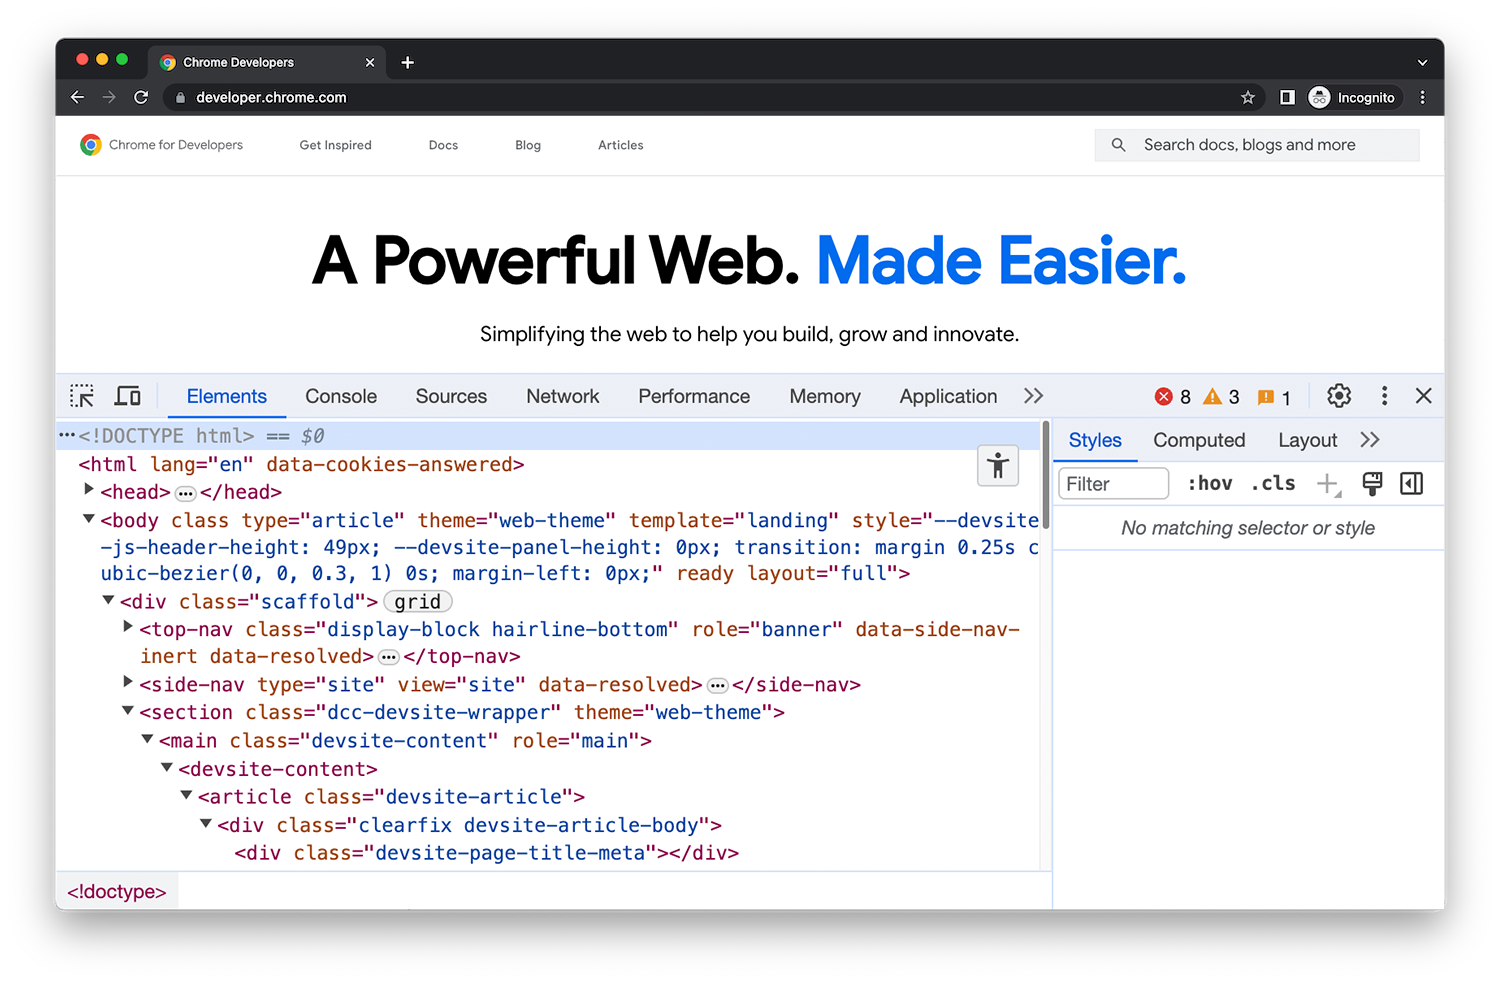
Elements - DOM
Learn how to view and change a page's DOM.
Elements - CSS
Learn how to view and change a page's CSS.
Console
Log messages and run JavaScript.
Sources
View and edit files, create snippets, debug JavaScript, and set up a workspace.
Network
Log network requests.
Performance
Evaluate website performance.
Memory
Find memory issues that affect page performance, including memory leaks, and more.
Application
Inspect, modify, and debug web apps, test cache, view storage, and more.
Recorder
Record, replay, measure user flows, and edit their steps.
Rendering
Discover a collection of options that affect web content rendering.
Autofill
Inspect and debug saved addresses.
Issues
Find and fix problems with your website.
Security
Make sure that a page is fully protected by HTTPS.
Memory inspector
Inspect an ArrayBuffer, TypedArray, or DataView in JavaScript, as well as WebAssembly and memory of C++ Wasm apps.
Network conditions
Override the user agent string.
Media
View information and debug media players per browser tab.
Animations
Inspect and modify animations.
Changes
Track changes to HTML, CSS, and JavaScript.
Coverage
Find and analyze unused JavaScript and CSS code.
Developer resources
Check if source maps load successfully and load them manually.
CSS Overview
Identify potential CSS improvements.
Lighthouse
Optimize website speed with the Lighthouse panel.
Performance insights
Get actionable insights on your website's performance.
Sensors
Emulate device sensors.
WebAuthn
Emulate authenticators.