This section covers how to use Meridian for scenario planning, including how to
incorporate data and assumptions about the future into budget optimization
scenarios.
As part of future budget optimization, Meridian forecasts incremental outcome
under a set of assumptions about the future. Meridian does not predict the
future outcome value itself, only the incremental portion. More detail is
provided in [Why Meridian doesn't forecast
outcome](https://developers.google.com/meridian/docs/post-modeling/scenario-planning-and-future-budget-optimization#why_meridian_doesnt_forecast_outcome).
## What is scenario planning?
Scenario planning is MMM analysis that can incorporate assumptions about the
future. For post-modeling analysis such as ROI, response curves, and budget
optimization, Meridian uses historical data to make default assumptions.
Sometimes these assumptions are reasonable for future planning, but not always.
New data can be incorporated into the analysis to modify the assumptions as
needed.
The following are some ways future strategies may differ from historical.
- **Cost per media unit:** The cost per media unit on a channel may have changed or be expected to change. (See Coding [Example 1](https://developers.google.com/meridian/docs/post-modeling/scenario-planning-and-future-budget-optimization#example_1_-_new_cost_per_media_unit_for_a_single_channel) and [Example 2](https://developers.google.com/meridian/docs/post-modeling/scenario-planning-and-future-budget-optimization#example_2_-_new_cost_per_media_for_all_channels))
- **Revenue per KPI unit:** The revenue per KPI (e.g. unit price or lifetime value) may have changed or be expected to change. (See Coding [Example 3](https://developers.google.com/meridian/docs/post-modeling/scenario-planning-and-future-budget-optimization#example_3_-_new_revenue_per_kpi))
- **Flighting Pattern:** Your historical and future flighting patterns may not match. For example, you may have introduced a new media channel during the model training window. The historical flighting pattern of the new channel might contain zeros or show a "ramping up" trend that is not expected to continue. (See Coding [Example 4](https://developers.google.com/meridian/docs/post-modeling/scenario-planning-and-future-budget-optimization#example_4_-_new_flighting_pattern))
## Post-modeling analysis metrics
Scenario planning affects *metric definitions* but not *parameter estimation*.
To illustrate these concepts, consider a hypothetical case where ordinary least
squares is used to estimate the treatment effect of a drug where we hypothesize
that the dosage in mg (X) linearly affects the outcome (Y) such as in the model,
\\\[
Y = \\alpha + X \\beta + \\epsilon \\ .
\\\]
The treatment effect depends on the dosage coefficient $\\beta$, which is a
*parameter estimated* from an observed dataset. The treatment effect can have
many possible *metric definitions*. For example, you could define the effect of
a drug as the expected change in outcome caused by a 10 mg dose ($10 \\beta$) or
a 15 mg dose ($15 \\beta$). You can estimate both treatment effect definitions
using the same model and coefficient estimate $\\hat{\\beta}$.
In Meridian, the *definition* of post-modeling analysis metrics depends on
certain data characteristics. For example, the ROI depends on a specified time
range, set of geos, flighting pattern (relative distribution of media units
across geos and time periods), total media units per channel, cost per media
unit, and revenue per KPI. Other post-modeling analysis metrics include expected
outcome, incremental outcome, marginal ROI, CPIK, response curves, and optimal
budget allocation. By default, these metrics are defined using the `input_data`
passed to [`Meridian`](https://developers.google.com/meridian/reference/api/meridian/model/model/Meridian);
however, `new_data` can be provided to specify alternative metric definitions. A
table indicating which of the data properties affect each metric's definition is
provided in Table 1.
**Table 1:** List of data properties that affect the metric definition of each method.
| | Time range | Set of geos | Flighting pattern | Total media Units per channel | Cost per media unit | Revenue per KPI (if applicable) | Control values |
|---|---|---|---|---|---|---|---|
| [`expected_outcome`](https://developers.google.com/meridian/reference/api/meridian/analysis/analyzer/Analyzer#expected_outcome) | X | X | X | X | | X | X |
| [`incremental_outcome`](https://developers.google.com/meridian/reference/api/meridian/analysis/analyzer/Analyzer#incremental_outcome) | X | X | X | X | | X | |
| [`roi`](https://developers.google.com/meridian/reference/api/meridian/analysis/analyzer/Analyzer#roi), [`marginal_roi`](https://developers.google.com/meridian/reference/api/meridian/analysis/analyzer/Analyzer#marginal_roi), [`cpik`](https://developers.google.com/meridian/reference/api/meridian/analysis/analyzer/Analyzer#cpik) | X | X | X | X | X | X | |
| [`response_curves`](https://developers.google.com/meridian/reference/api/meridian/analysis/analyzer/Analyzer#response_curves) | X | X | X | | X | X | |
| [`BudgetOptimizer.optimize`](https://developers.google.com/meridian/reference/api/meridian/analysis/optimizer/BudgetOptimizer#optimize) | X | X | X | ‡ | X | X | |
> ‡ Budget optimization uses the total media units per channel (in
> combination with the fixed flighting pattern and cost per media unit
> assumptions) to assign a default total budget (fixed budget optimization only)
> and channel-level budget constraints. If these settings are overridden using
> the `budget` and `pct_of_spend` arguments of `BudgetOptimizer.optimize`, then
> the total media units per channel does not affect the optimization.
The *estimation* of each post-modeling analysis metric depends on the posterior
distribution of the model parameters. The posterior distribution is conditional
on the `input_data` passed to the `Meridian` object constructor (excluding the
KPI for geos and time periods specified in `ModelSpec.holdout`). The
posterior distribution is estimated when `sample_posterior` is called, and this
estimate is used for all post-modeling analysis.
> [!NOTE]
> **Note:** `ModelSpec.holdout` affects parameter estimation, but it does not affect post-modeling analysis metric definitions. `ModelSpec.holdout` only holds out observed KPI values from the model estimation, and none of the analysis metric definitions depend on the observed KPI values.
## The `new_data` argument
The default value for each data property in Table 1 is derived from the
`input_data` passed to
[`Meridian`](https://developers.google.com/meridian/reference/api/meridian/model/model/Meridian). In
post-modeling analysis, the user can override the input data using the
`new_data` argument available in most methods. Each method uses only a subset of
the `new_data` attributes. Table 2 indicates which `new_data` attributes are
used by each method.
**Table 2:** List of `new_data` attributes used by each method.
| | `media`, `reach`, `frequency` | `revenue_per_kpi` | `media_spend`, `rf_spend` | `organic_media`, `organic_reach`, `organic_frequency`, `non_media_treatments` | `controls` | `time` | Time dimension must match `input_data` |
|---|---|---|---|---|---|---|---|
| [`expected_outcome`](https://developers.google.com/meridian/reference/api/meridian/analysis/analyzer/Analyzer#expected_outcome) | X | X | | X | X | | yes |
| [`incremental_outcome`](https://developers.google.com/meridian/reference/api/meridian/analysis/analyzer/Analyzer#incremental_outcome) | X | X | | X | | | no |
| [`roi`](https://developers.google.com/meridian/reference/api/meridian/analysis/analyzer/Analyzer#roi), [`cpik`](https://developers.google.com/meridian/reference/api/meridian/analysis/analyzer/Analyzer#cpik), [`marginal_roi`](https://developers.google.com/meridian/reference/api/meridian/analysis/analyzer/Analyzer#marginal_roi) | X | X | X | | | | no |
| [`response_curves`](https://developers.google.com/meridian/reference/api/meridian/analysis/analyzer/Analyzer#response_curves) | X | X | X | | | X | no |
| [`BudgetOptimizer.optimize`](https://developers.google.com/meridian/reference/api/meridian/analysis/optimizer/BudgetOptimizer#optimize) | X | X | X | | | X | no |
The data properties are derived from the `new_data` in the same way as from the
input data. For example, cost per media unit is calculated for each geo and time
period by dividing the spend by the media units.
If the time range of the `new_data` matches the time range of the input data,
then you don't need to specify all of the `new_data` attributes used by the
method you are calling. You can provide any subset of the attributes, and the
remaining attributes will be obtained from the input data.
However, if the time range of the `new_data` is different from the input data,
then you must pass all the `new_data` attributes used by the method you are
calling. All of the `new_data` attributes must have the same time dimension.
Only the `expected_outcome` method requires that the time dimension must match
the input data.
The `response_curves` and `optimize` methods additionally require date labels to
be passed to `new_data.time` if the time dimension does not match the input
data. The date labels don't affect the calculations, but they are used for axis
labels in certain visualizations.
> [!NOTE]
> **Note:** The parameter posterior distribution does not change when `new_data` is provided. The posterior distribution is conditional on the original input data, not the `new_data`.
## Helper method to create `new_data` for budget optimization
It may seem counterintuitive that channel level spend is both an output and a
`new_data` input of `BudgetOptimizer.optimize`. The output is the optimal spend
allocation, whereas the input spend is used together with the media units input
to set an assumed cost per media unit for each geo and time period. The spend
input is also used to set the total budget for a fixed budget optimization
scenario and to set the channel-level budget constraints, but these can be
overridden using the `budget` and `pct_of_spend` arguments.
The `optimizer.create_optimization_tensors` method is available for users who
prefer to input the cost per media unit data directly. This method creates a
`new_data` object specifically to be passed to the `BudgetOptimizer.optimize`
method using the following input data options.
Non-R\&F channels:
1. media units and cost per media unit
2. spend and cost per media unit
R\&F channels when `use_optimal_frequency=True`:
1. impressions and cost per impression
2. spend and cost per impression
R\&F channels when `use_optimal_frequency=False`:
1. impressions, frequency, and cost per impression
2. spend, frequency, and cost per impression
## Illustrative examples
The purpose of this section is to explain how the calculations are done for the
most important post-modeling analysis functions:
[`Analyzer.incremental_outcome`](https://developers.google.com/meridian/reference/api/meridian/analysis/analyzer/Analyzer#incremental_outcome),
[`Analyzer.roi`](https://developers.google.com/meridian/reference/api/meridian/analysis/analyzer/Analyzer#roi),
[`Analyzer.response_curves`](https://developers.google.com/meridian/reference/api/meridian/analysis/analyzer/Analyzer#response_curves),
and
[`BudgetOptimizer.optimize`](https://developers.google.com/meridian/reference/api/meridian/analysis/optimizer/BudgetOptimizer#optimize).
In particular, these examples show how the calculation of each method is done
using `input_data` and `new_data`. In these examples, the `input_data` includes
a "pre-modeling window" for the media units data, whereas the `new_data` does
not. The "pre-modeling window" contains media unit data prior to the first time
"modeling window" time period, which allows the model to properly take into
account the lagged effect of these units. When the `new_data` covers a different
time range than the `input_data` (as is the case in these examples), the media
units data are required to have the same number of time periods as all the other
new data.
In addition to `new_data`, each of these methods has a `selected_times`
argument. These arguments customize the *definition* of the output metric, not
the *parameter estimation* (see [What is scenario
planning?](https://developers.google.com/meridian/docs/post-modeling/scenario-planning-and-future-budget-optimization#what_is_scenario_planning)
for more information).
The `Analyzer.incremental_outcome` method also has a `media_selected_times`
argument which allows the incremental outcome definition to be further
customized. This argument gives `Analyzer.incremental_outcome` more flexibility
than the other methods. The other methods don't have this argument because their
calculations involve matching incremental outcome to some associated cost, which
can be ambiguous when both `selected_times` and `media_selected_times` are
customizable. However, you can manually pair `incremental_outcome` output with
cost data to create customized ROI definitions, for example.
In a geo-level model, each geo has its own incremental outcome, ROI, and
response curve. You can think of each example as representing a single geo.
National-level results are obtained by aggregating across geos. Each of these
methods has a `selected_geos` argument, which allows the user to specify a
subset of geos to include in the metric definition.
### Incremental outcome
For each media channel, the `incremental_outcome` method compares the expected
outcome under two counterfactual scenarios. In one scenario, the media units are
set to the historical values. In the other scenario, the media units are set
to zero for some or all time periods.
The `media_selected_times` argument determines the time periods over which the
media units are set to zero.
The `selected_times` argument determines the time range over which the
incremental outcome is measured.
#### Using `input_data`
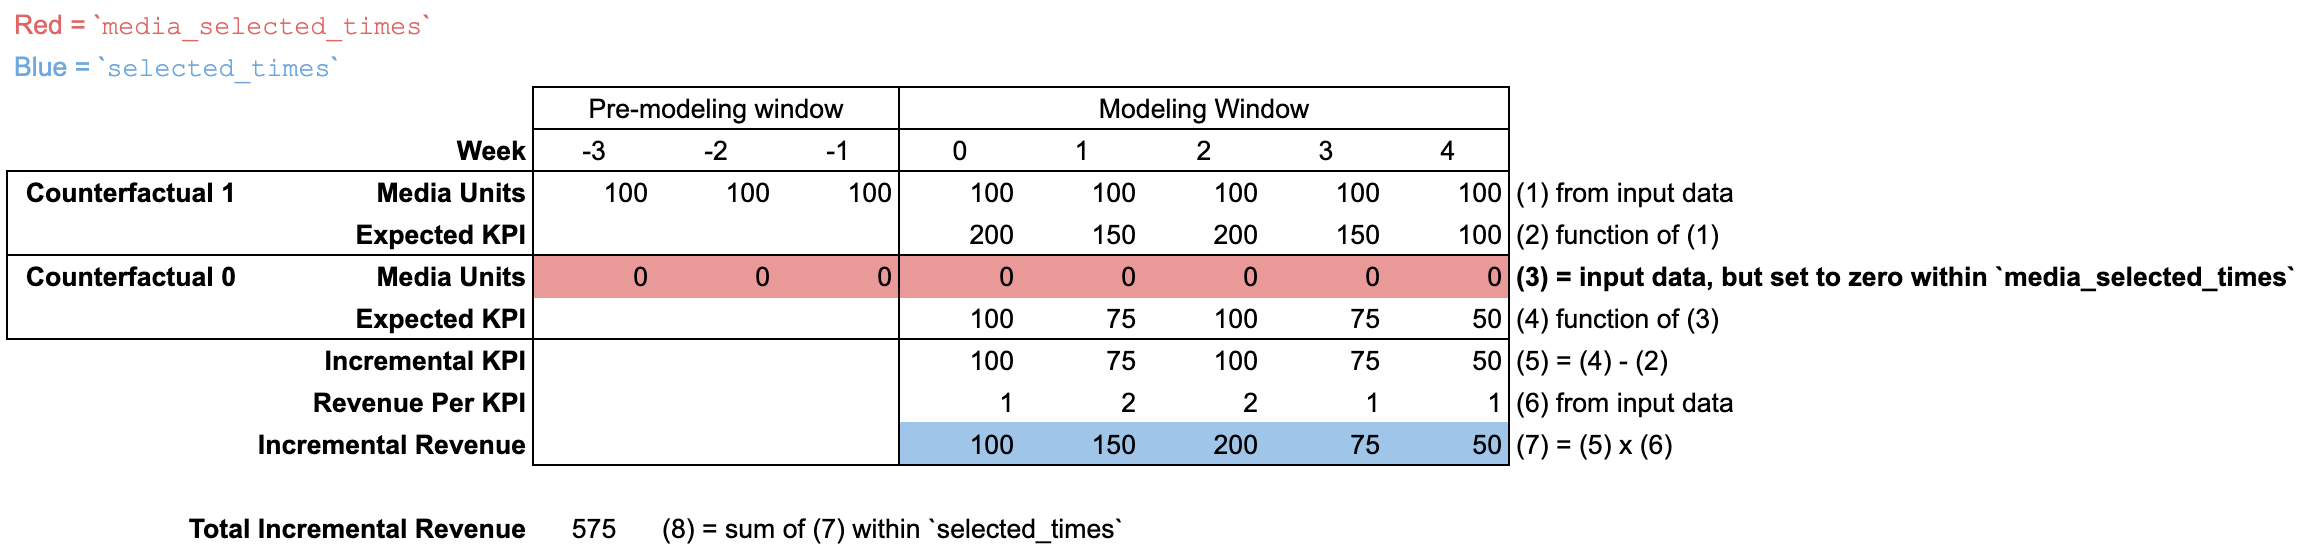
The default incremental outcome definition sets `media_selected_times` to be all
time periods, including both the "modeling window" and "pre-modeling window".
(The `input_data` media units can optionally include a "pre-modeling window",
which allows the model to properly take into account the lagged effect of these
units.)
The default `selected_times` is all time periods in the "modeling window", which
means that the incremental outcome is aggregated over all time periods in the
"modeling window".
The `input_data` may contain media units during a "pre-modeling window" to
account for lagged effects. The "pre-modeling window" does not contain any data
besides media units, which is why cells are blank in the illustration.
#### Using `input_data` with modified `selected_times` and `media_selected_times`
In order to understand the use of `new_data` in `incremental_outcome` and other
methods, it is important to understand the `selected_times` and
`media_selected_times` arguments.
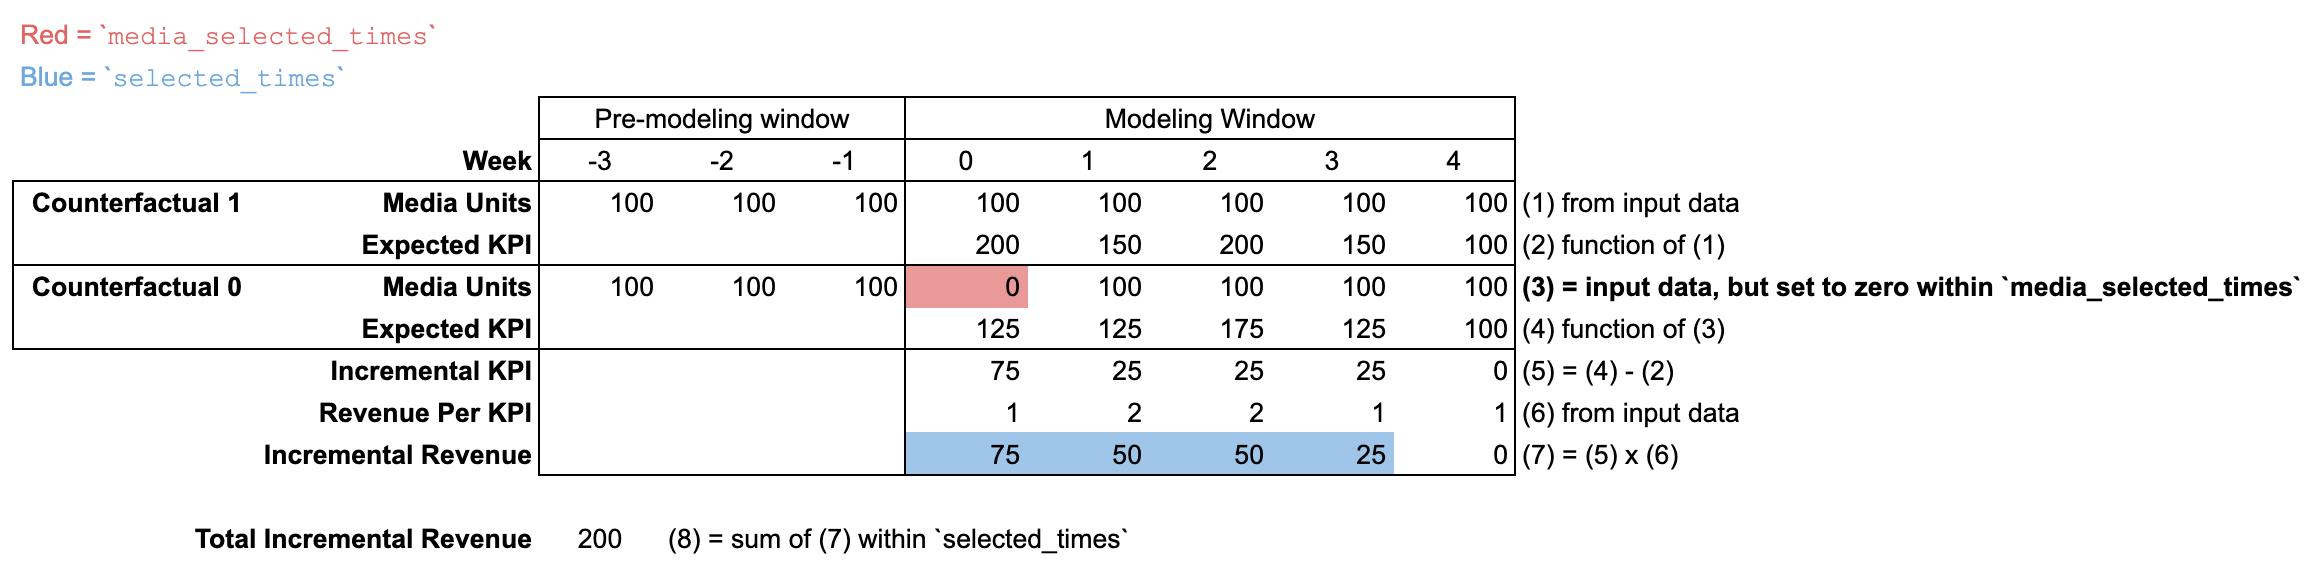
In this example, `media_selected_times` is set to a single time period (week 0).
Meanwhile, `selected_times` is set to be weeks 0 through 3. This example
illustrates a scenario where `max_lag` is set to 3 in the `ModelSpec`, so the
incremental outcome must be zero for weeks 4 and beyond. As a result, this
combination of `media_selected_times` and `selected_times` captures the full
long term impact of the week 0 media units.
> [!NOTE]
> **Note:** **Regarding Hill and Adstock order.** When `ModelSpec.hill_before_adstock` is `True`, the incremental outcome generated by the media during `media_selected_times` is unaffected by the amount of media execution before and after `media_selected_times`. However, when `ModelSpec.hill_before_adstock` is `False` (the default), then the media units within `max_lag` time periods before and following `media_selected_times` affect the result. Because of the diminishing returns (Hill) function, greater media execution before and after `media_selected_times` will generally reduce the incremental outcome generated by the media during `media_selected_times`.
#### Using `new_data` with a new time window
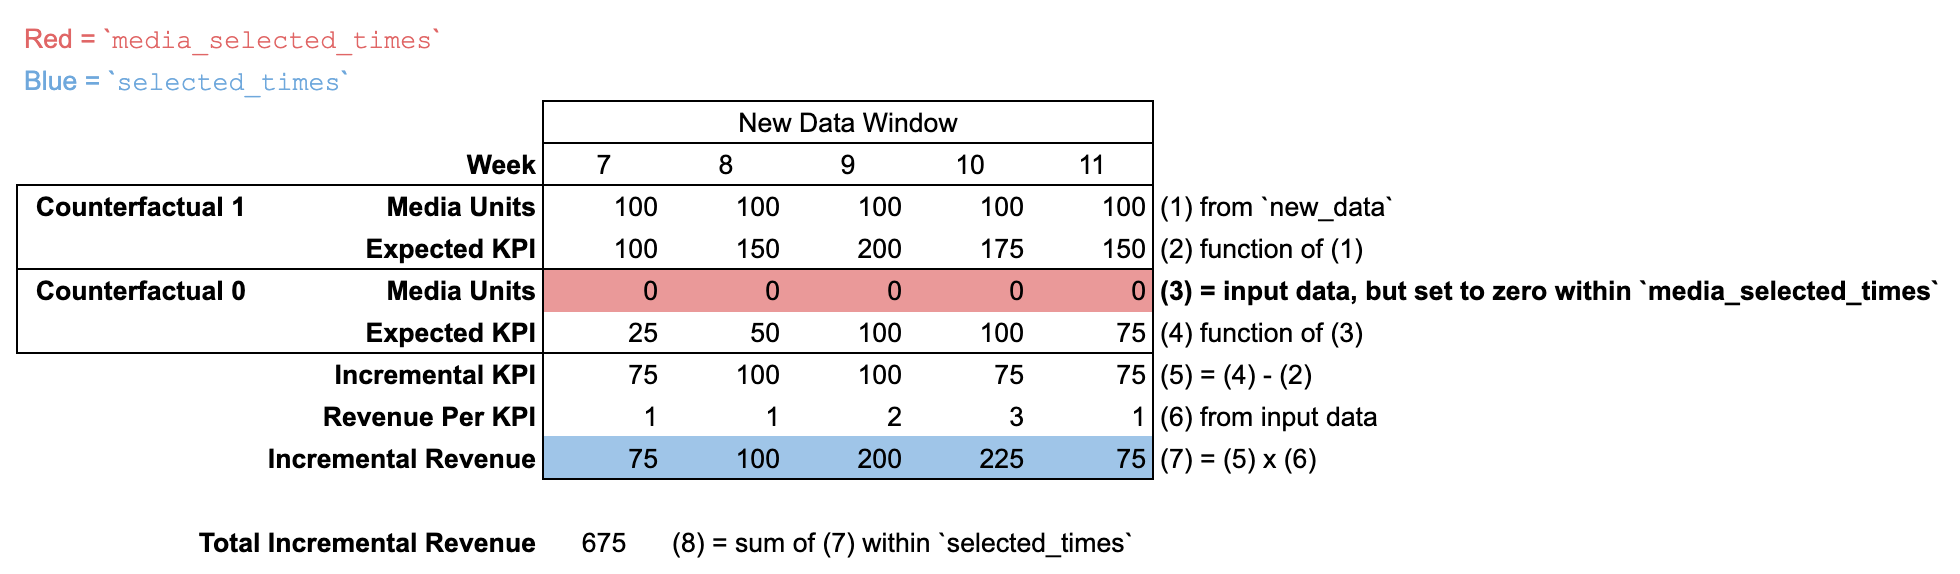
When `new_data` is passed with a different number of time periods than the
`input_data`, then there is no "pre-modeling window". It is assumed that
media units are zero for all time periods prior to the `new_data` time window.
The default incremental outcome definition sets both `media_selected_times` and
`selected_times` to be all time periods in the `new_data` time window.
### ROI
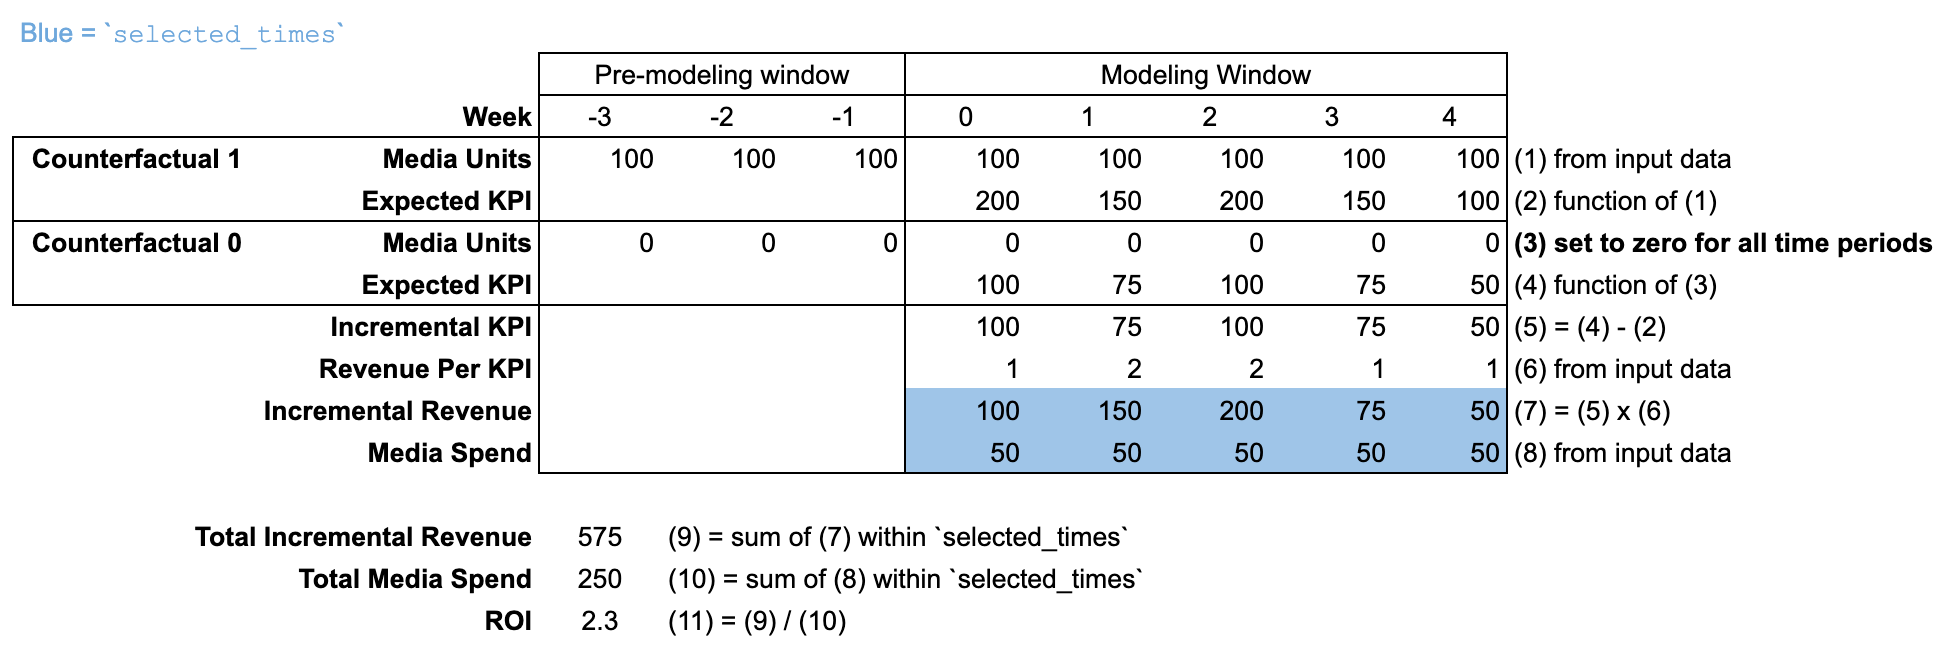
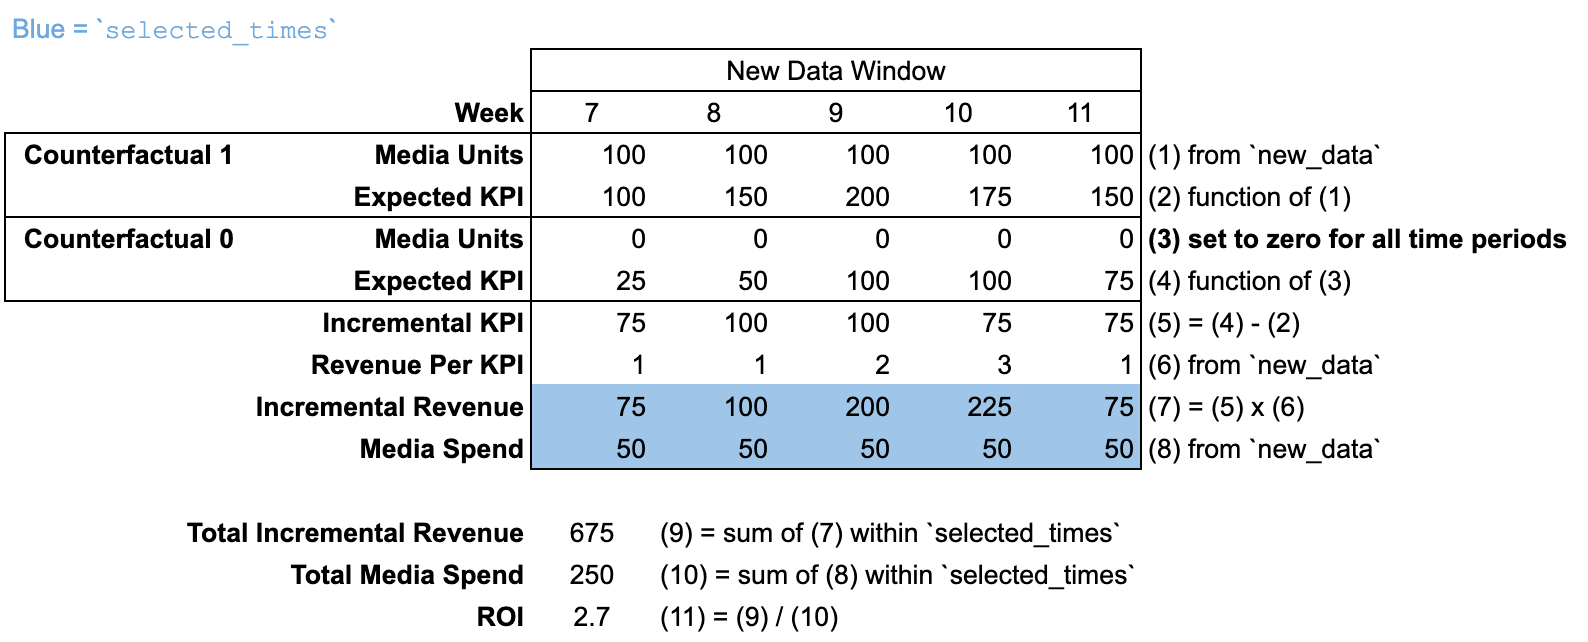
For each media channel, the `roi` method divides the incremental outcome
generated during `selected_times` by the spend during `selected_times`. The
`roi` method does not have a `media_selected_times` argument. The incremental
outcome compares the counterfactual where media units are set to historical
values against the counterfactual where media units are set to zero for all time
periods.
#### Using `input_data`
By default, `selected_times` is set to the entire "modeling window". The
counterfactual sets media units to zero for all time periods in both the
"modeling window" and "pre-modeling window".
#### Using `new_data` with a new time window
When `new_data` is passed with a different number of time periods than the
`input_data`, then there is no "pre-modeling window". It is assumed that
media units are zero for all time periods prior to the `new_data` time window.
### Response curves and budget optimization
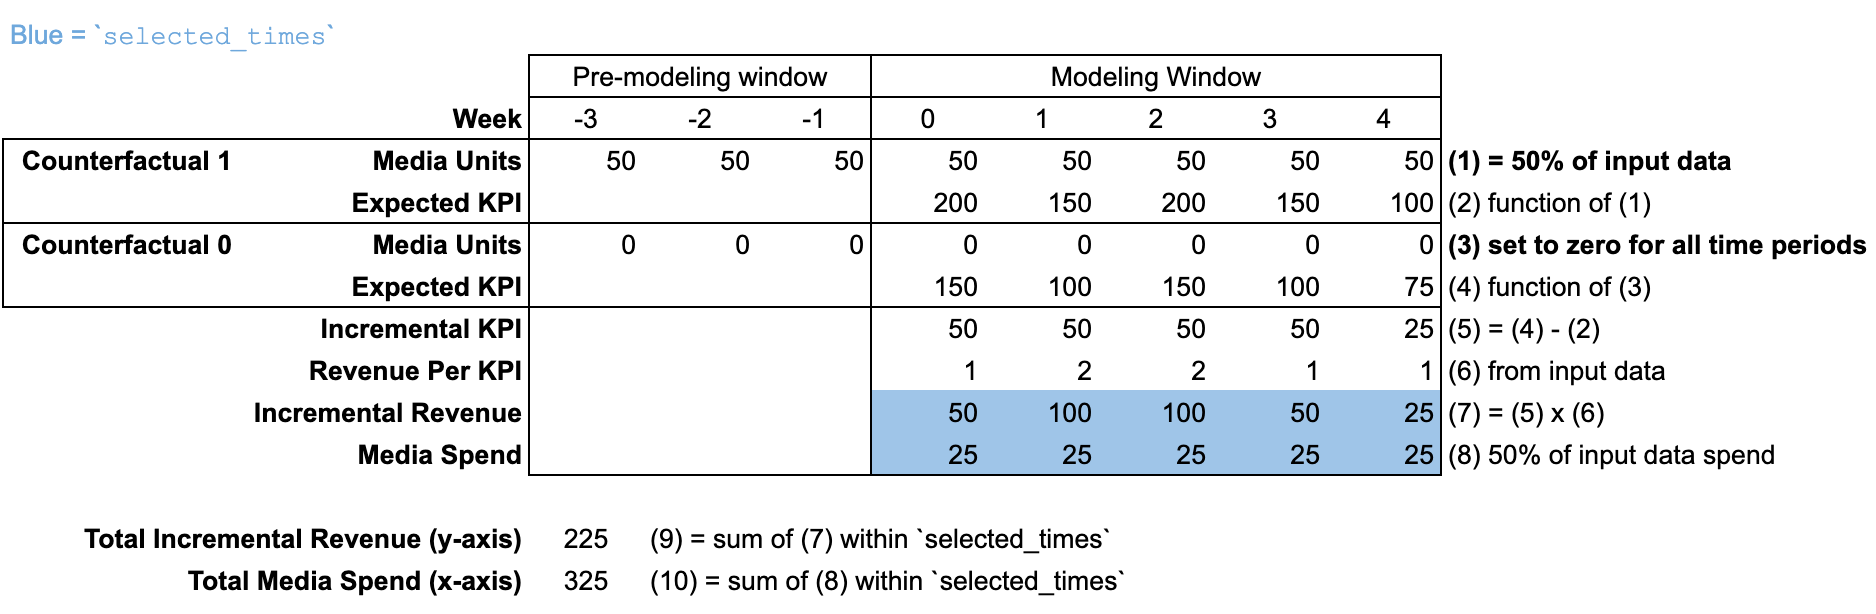
The `response_curves` method is similar to `roi` in that the incremental outcome
and spend are both aggregated over `selected_times`, which is set to the entire
"modeling window" by default. Each point on the response curve x-axis is some
percentage of the historical spend within the `selected_times` range. This
method calculates the corresponding incremental outcome (y-axis) by scaling the
historical media units by the same factor. The scaling factor is applied to the
media units of both the "modeling window" and "pre-modeling window".
Budget optimization is based on response curves, so the same illustration
applies to both response curves and budget optimization. Note that
`BudgetOptimizer.optimize` has deprecated the `selected_times` argument and now
uses `start_date` and `end_date` arguments instead.
#### Using `input_data`
By default, `selected_times` is set to the entire "modeling window". In the
counterfactual, media units are scaled for all time periods in both the
"modeling window" and "pre-modeling window".
In this illustration, the response curve is calculated at 50% of the
`input_data` budget.
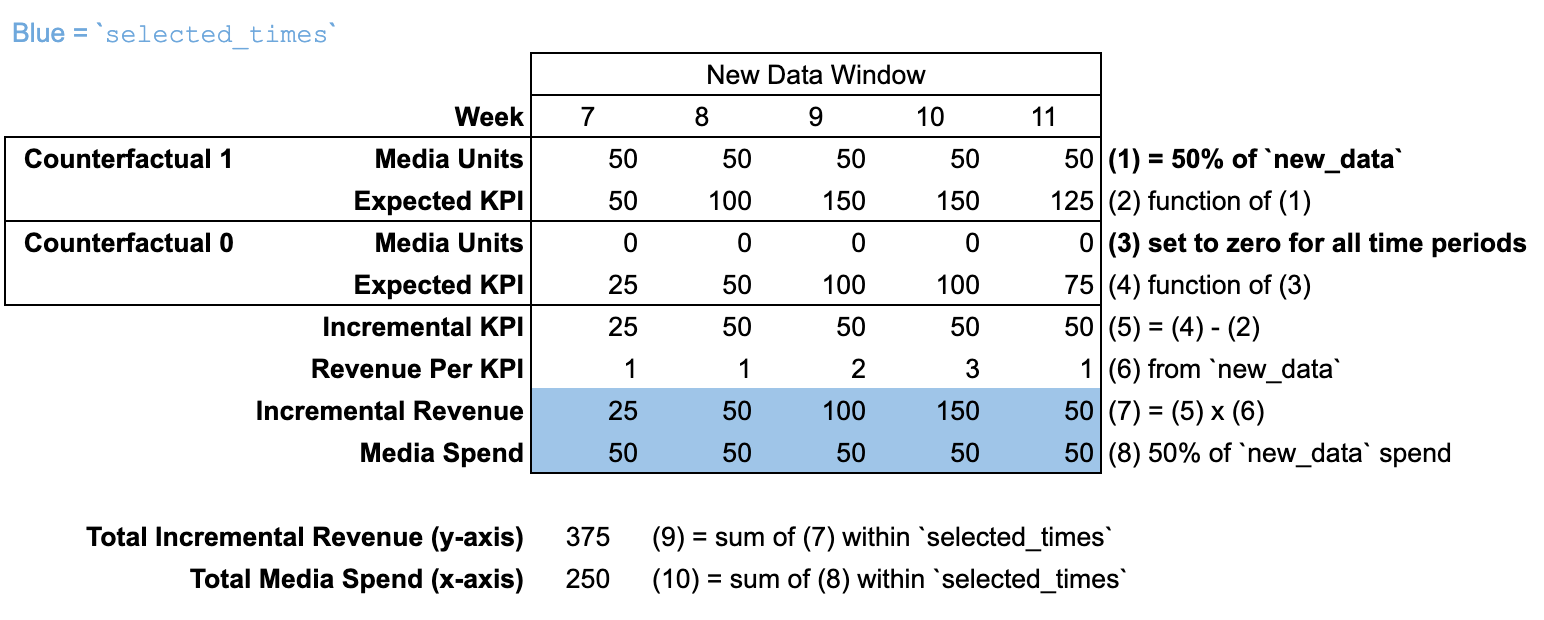
#### Using `new_data` with a new time window
When `new_data` is passed with a different number of time periods than the
`input_data`, then there is no "pre-modeling window". It is assumed that
media units are zero for all time periods prior to the `new_data` time window.
In this illustration, the response curve is calculated at 50% of the `new_data`
budget.
## Budget optimization code examples
The following examples illustrate the power of `new_data` for budget
optimization and future scenario planning. For illustrative purposes, each
example focuses on one key attribute of the input data that can be modified
using `new_data`. However, all of these assumptions (and more) can be combined
into one optimization scenario.
Imagine you want to optimize your budget for a future quarter that is expected
to have a similar flighting pattern, cost per media unit, and revenue per KPI to
the last quarter of input data. You can use the last quarter of input data to
represent the future scenario and tweak the aspects that are expected to change.
This is illustrated in each of the examples.
In more complicated future scenarios, it might be better to entirely replace the
input data with new data. This can either be done by constructing the arrays in
Python, or by [loading the data from a csv
file](https://developers.google.com/meridian/notebook/meridian-getting-started#step_6_run_budget_optimization_generate_an_optimization_report).
In these examples, there are three media channels. The KPI is sales units, and
`revenue_per_kpi` is provided. For the sake of illustration, each example runs
an optimization scenario that is based on the fourth quarter of 2024. A key
element of the scenario is modified in each example, and the `new_data` argument
is used to incorporate the change.
The code in each example assumes that a `Meridian` model has been initialized as
`mmm`, the `sample_posterior` method has been called, and a `BudgetOptimizer`
has been initialized as `opt`.
mmm = model.Meridian(...)
mmm.sample_posterior(...)
opt = optimizer.BudgetOptimizer(mmm)
### Example 1 - new cost per media unit for a single channel
Suppose the cost per media unit on the first channel is expected to double in
the near future, so you want to double the assumed cost per media unit of this
channel in the optimization. You can do this by creating a spend array that
matches the input data, except the spend is doubled for the first channel. The
array is passed to the `DataTensors` constructor, which in turn is passed to the
`new_data` argument of the optimization.
Modifying the `media_spend` also affects the default total budget for fixed
budget optimization, as well as the default spend constraints. These defaults
can be overridden using the `budget` and `pct_of_spend` optimization arguments.
It's important to be aware of these arguments and customize them as needed.
# Create `new_data` from `input_data`, but double the spend for channel 0.
new_spend = mmm.input_data.media_spend
new_spend[:, :, 0] *= 2
new_data = analyzer.DataTensors(media_spend=new_spend)
# Run fixed budget optimization on the last quarter of 2024, using customized
# total budget and constraints.
opt_results = opt.optimize(
new_data=new_data,
budget=100,
pct_of_spend=[0.3, 0.3, 0.4],
start_date="2024-10-07",
end_date="2024-12-30",
)
### Example 2 - new cost per media for all channels
Suppose the cost per media unit is expected to change in the near future for all
channels, so you want to change the assumed cost per media unit of all channels
in the optimization. For each channel, the anticipated cost is a known constant
and constant across geos and time periods. The `create_optimization_tensors`
helper method, which creates a `DataTensors` object, is convenient for this task
because the cost per media unit (`cpmu`) is a direct input.
The `create_optimization_tensors` method requires all optimization arguments to
be passed. Either `media` or `media_spend` can be passed (with geo and time
dimension) to specify the flighting pattern. The time dimension of all arguments
to `create_optimization_tensors` must match (`media` cannot include additional
time periods for lagged effects).
# Create `new_data` using the helper method. The cost per media unit (cpmu) is
# set to a constant value for each channel.
new_cpmu = np.array([0.1, 0.2, 0.5])
media_excl_lag = mmm.input_data.media[:, -mmm.n_times:, :]
new_data = opt.create_optimization_tensors(
time=mmm.input_data.time,
cpmu=new_cpmu,
media=media_excl_lag,
revenue_per_kpi=mmm.input_data.revenue_per_kpi,
)
# Run fixed budget optimization on the last quarter of 2024, using customized
# total budget and constraints.
opt_results = opt.optimize(
new_data=new_data,
budget=100,
pct_of_spend=[0.3, 0.3, 0.4],
start_date="2024-10-07",
end_date="2024-12-30",
)
The same task could be accomplished by creating the `DataTensors` object
directly. To do this, the spend is calculated by scaling the media units of each
channel by the cost per media unit for that channel.
# Create `new_data` without the helper method.
# In this example, `mmm.n_media_times > mmm.n_times` because the `media` data
# contains additional lag history. These time periods are discarded to create
# the new spend data.
media_excl_lag = mmm.input_data.media[:, -mmm.n_times:, :]
new_spend = media_excl_lag * np.array([0.1, 0.2, 0.5])
new_data = analyzer.DataTensors(media_spend=new_spend)
# Run fixed budget optimization on the last quarter of 2024, using customized
# total budget and constraints.
opt_results = opt.optimize(
new_data=new_data,
budget=100,
pct_of_spend=[0.3, 0.3, 0.4],
start_date="2024-10-07",
end_date="2024-12-30",
)
### Example 3 - new revenue per KPI
Suppose the revenue per KPI (e.g. unit price or lifetime value) is expected to
change in the near future. The new revenue per KPI assumption can be
incorporated into the optimization. To be clear, this will change assumed
revenue generated per incremental KPI unit, but it won't change the model fit on
the KPI itself.
# Create `new_data` from `input_data`, but double the revenue per kpi.
new_data = analyzer.DataTensors(
revenue_per_kpi=mmm.input_data.revenue_per_kpi * 2
)
# Run fixed budget optimization on the last quarter of 2024, using customized
# total budget and constraints.
opt_results = opt.optimize(
new_data=new_data,
budget=100,
pct_of_spend=[0.3, 0.3, 0.4],
start_date="2024-10-07",
end_date="2024-12-30",
)
### Example 4 - new flighting pattern
You may be considering a different future flighting pattern (relative allocation
of media units across geos or time periods). One common reason to do this is if
you plan to shift budget from one geo to another. Another common reason is to
account for a new media channel introduced during the input data window. When a
new channel is introduced, the historical flighting pattern has zero media units
prior to the time period when the channel was introduced. If you plan to execute
the new channel continuously in the future, then the zeros in the flighting
pattern should be replaced by other values to better reflect the future planned
flighting pattern.
In this example, imagine that the first media channel was introduced during the
fourth quarter of 2024. Perhaps it had zero spend initially and ramped up
throughout the quarter. However, in the future you expect to set a constant
media units per capita across geos and time periods. The `media` argument of
`DataTensors` is used to specify the flighting pattern. When specifying this
argument for a geo model, it's often best to consider the intended flighting
pattern in terms of media units per capita.
The exact number of media units per capita (100 in this example) does not affect
the flighting pattern. The flighting pattern is the *relative* allocation of
media units across geos and time periods, so the same flighting pattern could be
achieved by assigning 10 units per capita, for example. However, the media units
also affect the cost per media unit assumption, which is derived from the ratio
of spend per media unit within each geo and time period. In this example, the
new spend data is passed to achieve a cost per media unit of 0.1 for all geos
and time periods.
Modifying the `media_spend` also affects the default total budget for fixed
budget optimization, as well as the default spend constraints. These defaults
can be overridden using the `budget` and `pct_of_spend` optimization arguments.
It's important to be aware of these arguments and customize them as needed.
# Create new media units data from the input data, but set the media units per
# capita to 100 for channel 0 for all geos and time periods.
new_media = mmm.input_data.media.values
new_media[:, :, 0] = 100 * mmm.input_data.population.values[:, None]
# Set a cost per media unit of 0.1 for channel 0 for all geos and time periods.
new_media_spend = mmm.input_data.media_spend.values
new_media_spend[:, :, 0] = 0.1 * new_media[:, -mmm.n_times:, 0]
new_data = analyzer.DataTensors(
media=new_media,
media_spend=new_spend,
)
# Run fixed budget optimization on the last quarter of 2024, using customized
# total budget and constraints.
opt_results = opt.optimize(
new_data=new_data,
budget=100,
pct_of_spend=[0.3, 0.3, 0.4],
start_date="2024-10-07",
end_date="2024-12-30",
)
## Why Meridian doesn't forecast outcome
Meridian does not need to forecast the expected outcome into the future in order
for its causal inference to be useful for future planning. In fact, Meridian has
methods to help with future planning including the `Optimizer` class and many
methods including `roi`, `marginal_roi`, and `incremental_outcome`. The
`new_data` argument in these methods allows one to use Meridian's causal
inference to estimate quantities for any hypothetical media execution or
flighting pattern, including future execution.
Meridian's goal is causal inference. More precisely, the goal is to infer the
incremental outcome that treatment variables have on the outcome. Using terms
from the [Glossary](https://developers.google.com/meridian/docs/basics/glossary), we
simplify the incremental outcome definition as
\\\[
\\text{Incremental Outcome} = \\text{Expected Outcome} - \\text{Counterfactual}
\\\]
where the meaning of counterfactual depends on the treatment type. (See the
[Glossary](https://developers.google.com/meridian/docs/basics/glossary#incremental-outcome) for more
information, and see [Incremental outcome
definition](https://developers.google.com/meridian/docs/basics/incremental-outcome-definition) for a more
precise definition.)
Control variables have an influence on expected outcome, but not on incremental
outcome (other than the effect controls have on debiasing media effects). This
is because the Meridian model specifies that control variables have an additive
effect on both "Expected Outcome" and "Counterfactual", which cancels in the
difference. Forecasting expected outcome would require us to forecast the
control data. This can be quite difficult as many controls are very noisy,
unpredictable, and completely outside the control of an advertiser. Forecasting
the control data would be orthogonal to the causal inference goals of Meridian
because we can infer incremental outcome, and even optimize it, without
necessarily forecasting the expected outcome.
Similarly, the temporal effects, parameterized by knots, are additive. As a
result, "Expected Outcome" and "Counterfactual" depend on the knot values, but
"Incremental Outcome" does not. Meridian's knot-based approach for modeling
temporal patterns is not designed for forecasting. Instead, it's designed to
offer a much more flexible model for temporal patterns which makes it a good fit
for the causal inference problem.