Ensure you have a working version of MediaPipe Framework. See installation instructions.
To run the
hello worldexample:$ git clone https://github.com/google/mediapipe.git $ cd mediapipe $ export GLOG_logtostderr=1 # Need bazel flag 'MEDIAPIPE_DISABLE_GPU=1' as desktop GPU is not supported currently. $ bazel run --define MEDIAPIPE_DISABLE_GPU=1 \ mediapipe/examples/desktop/hello_world:hello_world # It should print 10 rows of Hello World! # Hello World! # Hello World! # Hello World! # Hello World! # Hello World! # Hello World! # Hello World! # Hello World! # Hello World! # Hello World!The
hello worldexample uses a simple MediaPipe graph in thePrintHelloWorld()function, defined in aCalculatorGraphConfigproto.absl::Status PrintHelloWorld() { // Configures a simple graph, which concatenates 2 PassThroughCalculators. CalculatorGraphConfig config = ParseTextProtoOrDie<CalculatorGraphConfig>(R"( input_stream: "in" output_stream: "out" node { calculator: "PassThroughCalculator" input_stream: "in" output_stream: "out1" } node { calculator: "PassThroughCalculator" input_stream: "out1" output_stream: "out" } )");You can visualize this graph using MediaPipe Visualizer by pasting the CalculatorGraphConfig content below into the visualizer. See here for help on the visualizer.
    input_stream: "in"
    output_stream: "out"
    node {
      calculator: "PassThroughCalculator"
      input_stream: "in"
      output_stream: "out1"
    }
    node {
      calculator: "PassThroughCalculator"
      input_stream: "out1"
      output_stream: "out"
    }
This graph consists of 1 graph input stream (
in) and 1 graph output stream (out), and 2PassThroughCalculators connected serially.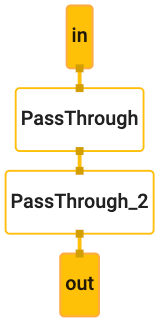
Before running the graph, an
OutputStreamPollerobject is connected to the output stream in order to later retrieve the graph output, and a graph run is started withStartRun.CalculatorGraph graph; MP_RETURN_IF_ERROR(graph.Initialize(config)); MP_ASSIGN_OR_RETURN(OutputStreamPoller poller, graph.AddOutputStreamPoller("out")); MP_RETURN_IF_ERROR(graph.StartRun({}));The example then creates 10 packets (each packet contains a string "Hello World!" with Timestamp values ranging from 0, 1, ... 9) using the
MakePacketfunction, adds each packet into the graph through theininput stream, and finally closes the input stream to finish the graph run.for (int i = 0; i < 10; ++i) { MP_RETURN_IF_ERROR(graph.AddPacketToInputStream("in", MakePacket<std::string>("Hello World!").At(Timestamp(i)))); } MP_RETURN_IF_ERROR(graph.CloseInputStream("in"));Through the
OutputStreamPollerobject the example then retrieves all 10 packets from the output stream, gets the string content out of each packet and prints it to the output log.mediapipe::Packet packet; while (poller.Next(&packet)) { LOG(INFO) << packet.Get<string>(); }
Except as otherwise noted, the content of this page is licensed under the Creative Commons Attribution 4.0 License, and code samples are licensed under the Apache 2.0 License. For details, see the Google Developers Site Policies. Java is a registered trademark of Oracle and/or its affiliates.
Last updated 2023-03-08 UTC.
[{
"type": "thumb-down",
"id": "missingTheInformationINeed",
"label":"Missing the information I need"
},{
"type": "thumb-down",
"id": "tooComplicatedTooManySteps",
"label":"Too complicated / too many steps"
},{
"type": "thumb-down",
"id": "outOfDate",
"label":"Out of date"
},{
"type": "thumb-down",
"id": "samplesCodeIssue",
"label":"Samples / code issue"
},{
"type": "thumb-down",
"id": "otherDown",
"label":"Other"
}]
[{
"type": "thumb-up",
"id": "easyToUnderstand",
"label":"Easy to understand"
},{
"type": "thumb-up",
"id": "solvedMyProblem",
"label":"Solved my problem"
},{
"type": "thumb-up",
"id": "otherUp",
"label":"Other"
}]