> [!IMPORTANT]
> **Important:** Before you can query Places Insights data, you must first [sign
> up](https://mapsplatform.google.com/assets/geo-analytics-sample-data/) to get access to the Places Insights product.
In this document, you will learn how to use sample [Place
IDs](https://developers.google.com/maps/documentation/places/web-service/place-id) data from [Places
Insights](https://developers.google.com/maps/documentation/placesinsights), using [Place Count
Functions](https://developers.google.com/maps/documentation/placesinsights/place-count-functions/function-queries),
alongside targeted [Place
Details](https://developers.google.com/maps/documentation/places/web-service/place-details) lookups to build
confidence in your results.
For a detailed reference implementation of this pattern, see this explanatory
notebook:
|---|---|
| [ Run in Google Colab](https://colab.research.google.com/github/googlemaps-samples/insights-samples/blob/main/places_insights/notebooks/spot_check_results/places_insights_spot_check_results_using_functions.ipynb) | [ View source on GitHub](https://github.com/googlemaps-samples/insights-samples/blob/main/places_insights/notebooks/spot_check_results/places_insights_spot_check_results_using_functions.ipynb) |
## The Architectural Pattern
This architectural pattern gives you a repeatable workflow to bridge the gap
between high-level statistical analysis and ground-truth verification. By
combining the scale of [BigQuery](https://cloud.google.com/bigquery) with the
precision of the [Places API](https://developers.google.com/maps/documentation/places/web-service), you can
confidently validate your analytical findings. This is particularly useful for
site selection, competitor analysis, and market research where trust in the data
is paramount.
The core of this pattern involves four key steps:
1. **Perform Large-Scale Analysis:** Use a [Place Count Function](https://developers.google.com/maps/documentation/placesinsights/experimental/functions-overview) from [Places Insights](https://developers.google.com/maps/documentation/placesinsights) in BigQuery to analyze place data over a large geography, such as an entire city or region.
2. **Isolate and Extract Samples:** Identify areas of interest (e.g., "hotspots" with high density) from the aggregated results and extract the `sample_place_ids` provided by the function.
3. **Retrieve Ground-Truth Details:** Use the extracted [Place
IDs](https://developers.google.com/maps/documentation/places/web-service/place-id) to make targeted calls to the [Place Details
API](https://developers.google.com/maps/documentation/places/web-service/place-details) to fetch rich, real-world details for each place.
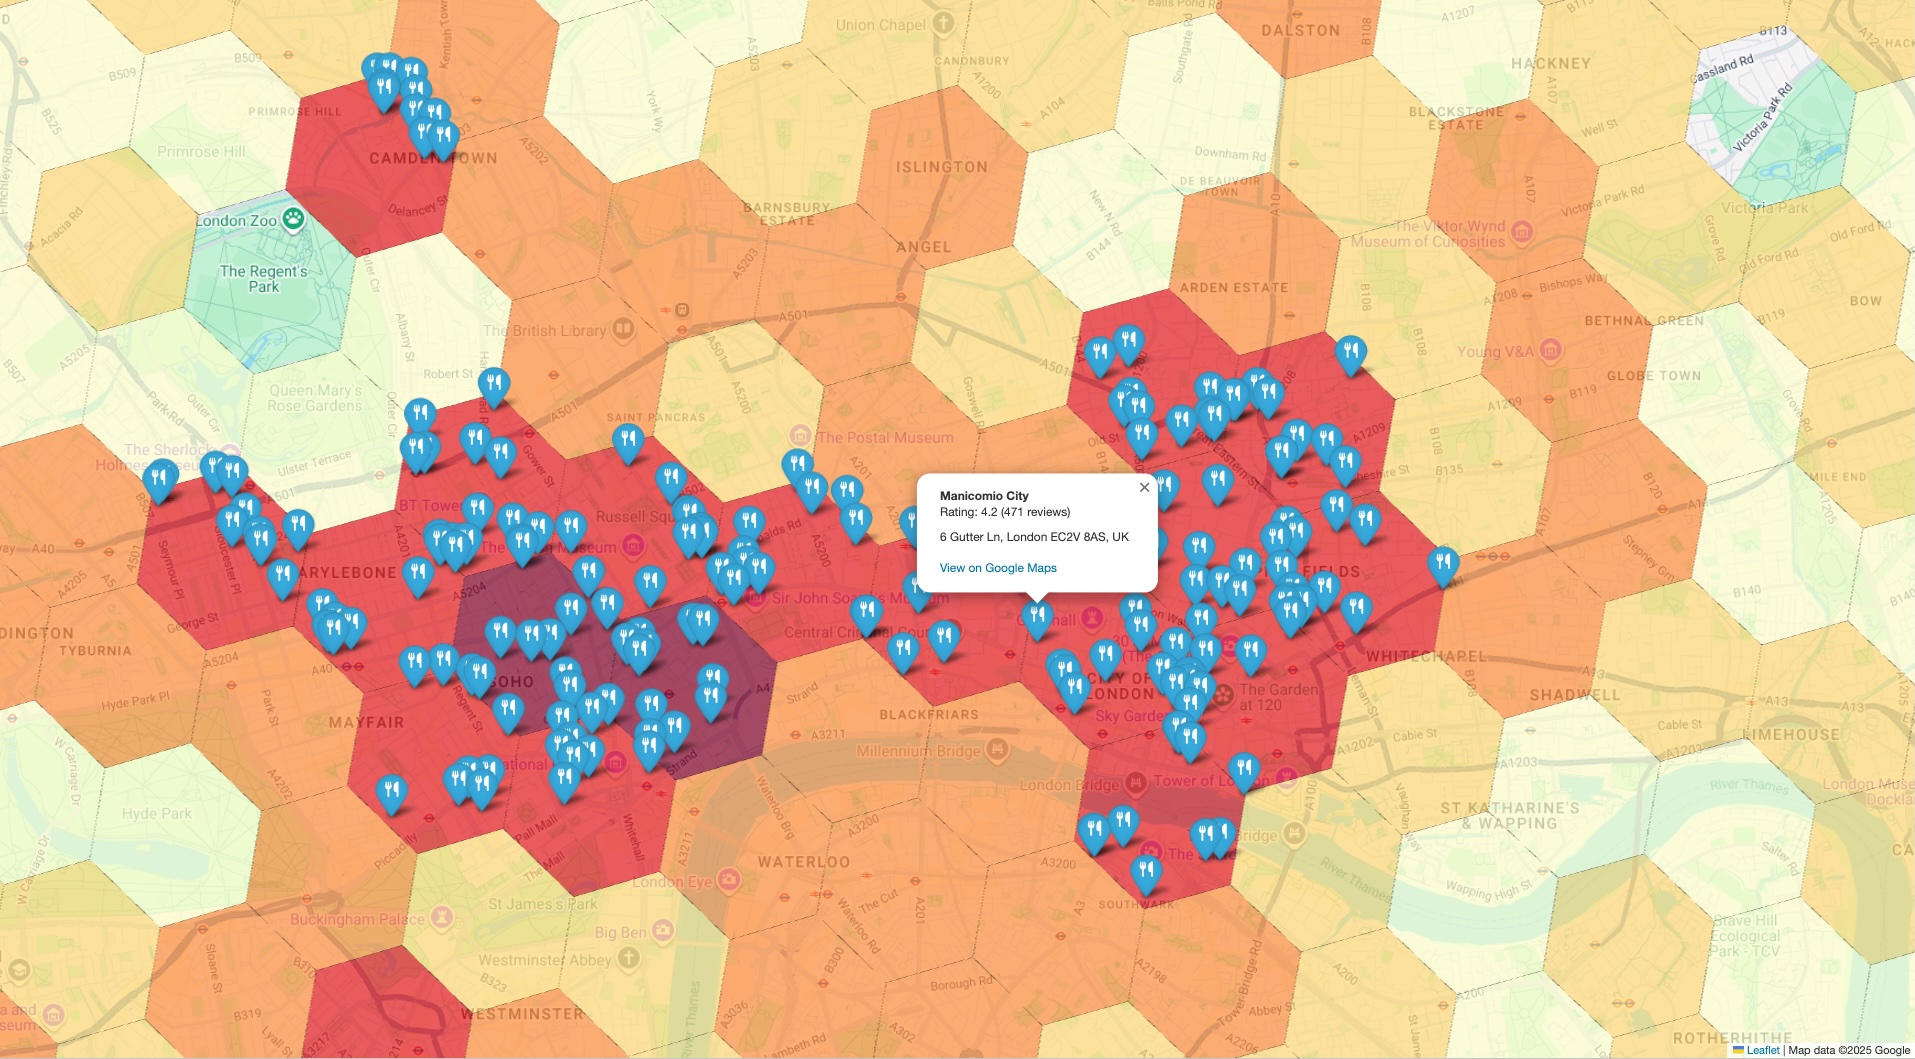
4. **Create a Combined Visualization:** Layer the detailed place data on top of the initial high-level statistical map to visually validate that the aggregated counts reflect reality on the ground.
## Solution Workflow
This workflow lets you to bridge the gap between macro-level trends and
micro-level facts. You start with a broad, statistical view and strategically
drill down to verify the data with specific, real-world examples.
### Analyze Place Density at Scale with Places Insights
Your first step is to understand the landscape at a high level. Instead of
fetching thousands of individual points of interest (POIs), you can run a single
query to get a statistical summary.
The Places Insights [`PLACES_COUNT_PER_H3`
function](https://developers.google.com/maps/documentation/placesinsights/experimental/places-count-per-h3)
is ideal for this. It aggregates POI counts into a [hexagonal grid system
(H3)](https://h3geo.org/), allowing you to quickly identify areas of
high or low density based on your specific criteria (e.g., restaurants with a
high rating that are operational).
An example query is as follows. Note that you will be required to provide your
search area geography. An open dataset, such as the [Overture Maps
Data](https://console.cloud.google.com/marketplace/product/bigquery-public-data/overture-maps)
BigQuery [public
dataset](https://cloud.google.com/bigquery/public-data) can be used
to retrieve geographical boundary data.
For frequently used open dataset boundaries, we recommend materializing them
into a table in your own project. This significantly reduces BigQuery costs and
improves query performance.
```sql
-- This query counts all highly-rated, operational restaurants
-- across a large geography, grouping them into H3 cells.
SELECT *
FROM
`places_insights___gb.PLACES_COUNT_PER_H3`(
JSON_OBJECT(
'geography', your_defined_geography,
'h3_resolution', 8,
'types', ['restaurant'],
'business_status', ['OPERATIONAL'],
'min_rating', 3.5
)
);
```
#### Filtering and validating by Brand ID
If you want to validate counts and sample place IDs for specific brands,
supply a list of brand IDs using the `brand_ids` filter.
To obtain the brand ID for a target brand, query the `brands` table in
BigQuery:
```sql
SELECT id, name
FROM `YOUR_PROJECT.places_insights___us.brands`
WHERE LOWER(name) LIKE "%starbucks%";
```
After retrieving the target brand ID (for example, `"1413758728321880760"`
for Starbucks), pass it inside the `brand_ids` filter array:
```sql
SELECT *
FROM
`places_insights___us.PLACES_COUNT_PER_H3`(
JSON_OBJECT(
'geography', your_defined_geography,
'h3_resolution', 8,
'brand_ids', ["1413758728321880760"]
)
);
```
During step 3, ground-truth verification, instead of confirming that a place
matches general categories, you can programmatically compare the display name
returned by the Place Details API against your expected brand name using a
regular expression match. For example, you can compare the
`response.display_name.text` field.
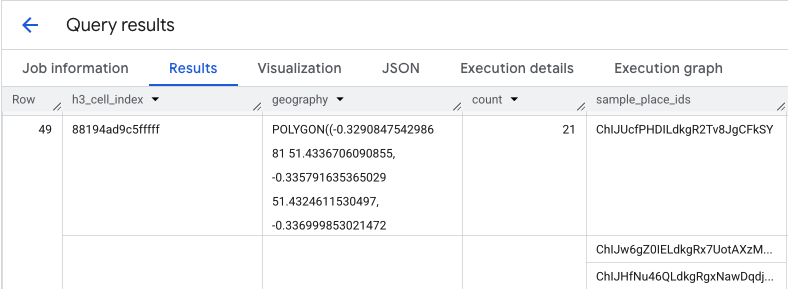
The output of this query gives you a table of H3 cells and the count of places
within each, forming the basis for a density heatmap.
### Isolate Hotspots and Extract Sample Place IDs
The result from the `PLACES_COUNT_PER_H3` function also returns an array of
`sample_place_ids`, up to 250 Place IDs per element of the response. These IDs
are the link from the aggregated statistic to the individual places that
contribute to it.
Your system could first identify the most relevant cells from the initial query.
For example, you might select the top 20 cells with the highest counts. Then,
from these hotspots, you consolidate the `sample_place_ids` into a single list.
This list represents a curated sample of the most interesting POIs from the most
relevant areas, preparing you for targeted verification.
If you are processing your BigQuery results in Python using a pandas DataFrame,
the logic to extract these IDs is straightforward:
```python
# Assume 'results_df' is a pandas DataFrame from your BigQuery query.
# 1. Identify the 20 busiest H3 cells by sorting and taking the top results.
top_hotspots_df = results_df.sort_values(by='count', ascending=False).head(20)
# 2. Extract and flatten the lists of sample_place_ids from these hotspots.
# The .explode() function creates a new row for each ID in the lists.
all_sample_ids = top_hotspots_df['sample_place_ids'].explode()
# 3. Create a final list of unique Place IDs to verify.
place_ids_to_verify = all_sample_ids.unique().tolist()
print(f"Consolidated {len(place_ids_to_verify)} unique Place IDs for spot-checking.")
```
**Similar logic can be applied if using other programming languages.**
### Retrieve Ground-Truth Details with the Places API
> [!TIP]
> **Tip:** [Geocoding API](https://developers.google.com/maps/documentation/geocoding/requests-places-geocoding) also supports using Place IDs to retrieve place information.
With your consolidated list of Place IDs, you now transition from large-scale
analytics to specific data retrieval. You will use these IDs to query the Place
Details API for detailed information on each sample location.
This is a critical validation step. While Places Insights told you *how many*
restaurants were in an area, the Places API tells you *which* restaurants they
are, providing their name, exact address, latitude/longitude, user rating, and
even a direct link to their location on Google Maps. This enriches your sample
data, turning abstract IDs into concrete, verifiable places.
For the full list of data available from Place Details API, and the cost
associated with retrieval, [review the API
documentation](https://developers.google.com/maps/documentation/places/web-service/place-details).
A request to the Places API for a specific ID using the [Python client
library](https://developers.google.com/maps/documentation/places/web-service/client-libraries#python) would
look like this. See [Places API (New) client library
examples](https://developers.google.com/maps/documentation/places/web-service/client-library-examples#place-details)
for more details.
```python
# A request to fetch details for a single Place ID.
request = {"name": f"places/{place_id}"}
# Define the fields you want returned in the response as a comma-separated string.
fields_to_request = "formattedAddress,location,displayName,googleMapsUri"
# The response contains ground truth data.
response = places_client.get_place(
request=request,
metadata=[("x-goog-fieldmask", fields_to_request)]
)
```
Be aware that the fields in this request pull data from two different billing
SKUs.
- `formattedAddress` and `location` are part of the **[Place Details
Essentials
SKU](https://developers.google.com/maps/billing-and-pricing/sku-details/places#place-details-ess-sku)**.
- `displayName` and `googleMapsUri` are part of the **[Place Details Pro
SKU](https://developers.google.com/maps/billing-and-pricing/sku-details/places#place-details-pro-sku)**.
When a single Place Details request includes fields from multiple SKUs, the
entire request is billed at the rate of the highest-tier SKU. **Therefore, this
specific call will be billed as a Place Details Pro request.**
To control your costs, always use the `FieldMask` to request only the fields
your application requires.
### Create a Combined Visualization for Validation
> [!TIP]
> **Tip:** [Places UI Kit](https://developers.google.com/maps/documentation/javascript/places-ui-kit/place-details.md.txt) can also be used to visualize results using Place IDs.
The final step is to bring both datasets together in a single view. This
provides an immediate and intuitive way to spot-check your initial analysis.
Your visualization should have two layers:
1. **Base Layer:** A choropleth or heatmap generated from the initial `PLACES_COUNT_PER_H3` results, showing the overall density of places across your geography.
2. **Top Layer:** A set of individual markers for each sample POI, plotted using the precise coordinates retrieved from the Places API in the previous step.
The logic for building this combined view is expressed in this pseudo-code
example:
```python
# Assume 'h3_density_data' is your aggregated data from Step 1.
# Assume 'detailed_places_data' is your list of place objects from Step 3.
# Create the base choropleth map from the H3 density data.
# The 'count' column determines the color of each hexagon.
combined_map = create_choropleth_map(
data=h3_density_data,
color_by_column='count'
)
# Iterate through the detailed place data to add individual markers.
for place in detailed_places_data:
# Construct the popup information with key details and a link.
popup_html = f"""
{place.name}
Address: {place.address}
View on Maps
"""
# Add a marker for the current place to the base map.
combined_map.add_marker(
location=[place.latitude, place.longitude],
popup=popup_html,
tooltip=place.name
)
# Display the final map with both layers.
display(combined_map)
```
By overlaying the specific, ground-truth markers on the high-level density map,
you can instantly confirm that the areas identified as hotspots do, in fact,
contain a high concentration of the places you're analyzing. This visual
confirmation builds significant trust in your data-driven conclusions.
## Conclusion
This architectural pattern provides a robust and efficient method for validating
large-scale geospatial insights. By leveraging Places Insights for broad,
scalable analysis and the Place Details API for targeted, ground-truth
verification, you create a powerful feedback loop. This ensures your strategic
decisions, whether in retail site selection or logistics planning, are based on
data that is not only statistically significant but also verifiably accurate.
### Next steps
- Explore other [Place Count Functions](https://developers.google.com/maps/documentation/placesinsights/experimental/functions-overview) to see how they can answer different analytical questions.
- Review the [Places API documentation](https://developers.google.com/maps/documentation/places/web-service/overview.md.txt) to discover other fields you can request to further enrich your analysis.
## Contributors
[Henrik Valve](https://www.linkedin.com/in/henrikvalve/) \| DevX
Engineer