## Objective
[Air Quality](https://developers.google.com/maps/documentation/air-quality/heatmaps.md.txt) and [Pollen](https://developers.google.com/maps/documentation/pollen/heatmap-tiles.md.txt) APIs offer great opportunities to add more**insights** into a trip or map at any given location. There are two ways to consume the data available from those APIs: index as text or heatmap tiles as raster images.
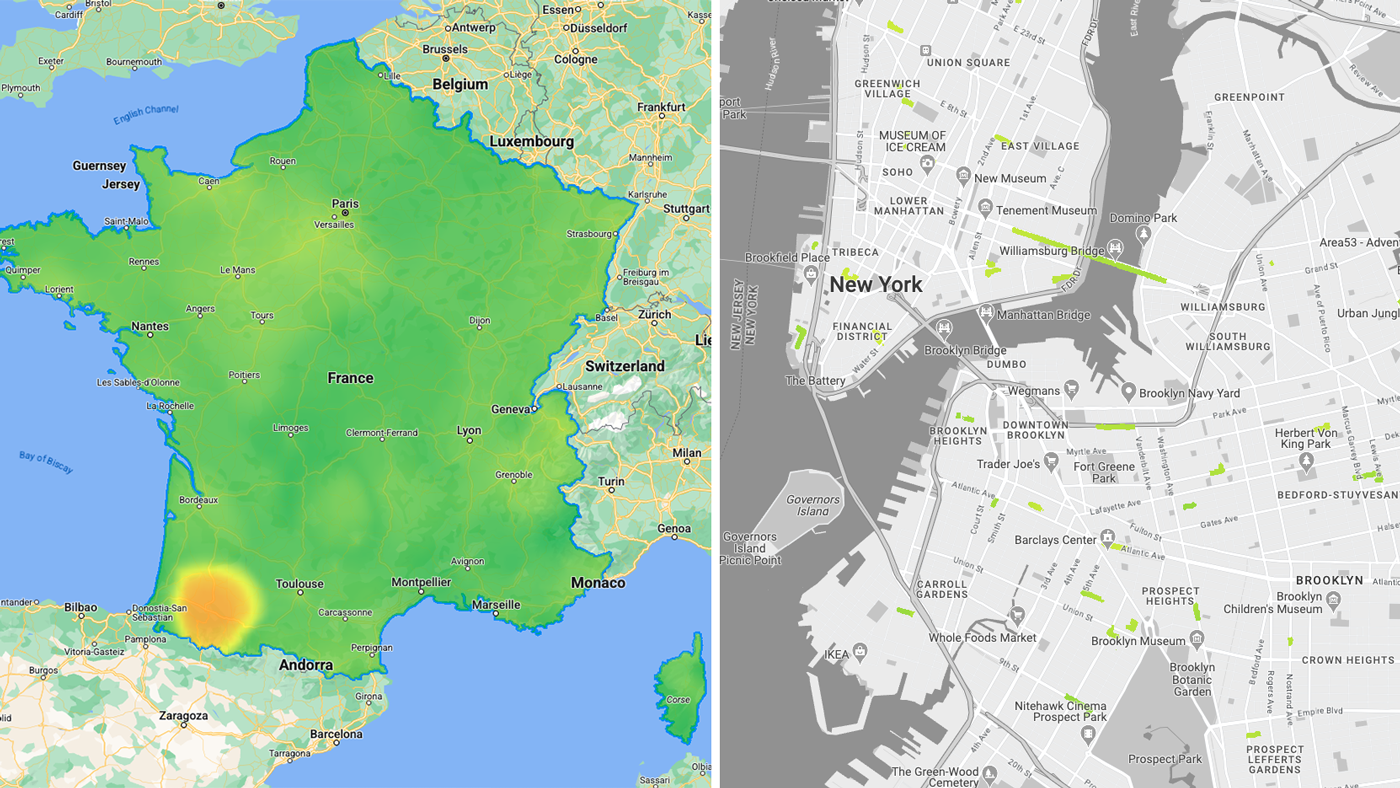
While using the heatmap tiles APIs endpoints, you may face a couple of challenges while loading the individual raster tiles such as:
- how to load the tiles on a Google Map on the Web? (also to comply with the APIs [Terms of use](https://developers.google.com/maps/documentation/air-quality/policies.md.txt#map))
- how to manage the number of requests during the experience?
- how to read the tiles values?
### Sample use cases
You will be presented sample use cases to try to answer the above questions.
- Air Quality \& Pollen **in an area:** visualize [heatmap tiles](https://developers.google.com/maps/documentation/air-quality/heatmaps.md.txt) (current conditions) raster data inside one or multiple custom polygons.
- Air Quality \& Pollen **along route:** visualize [heatmap tiles](https://developers.google.com/maps/documentation/air-quality/heatmaps.md.txt) (current conditions) raster data mapped on routes waypoints.
## Implementation
You will discover what tiles are available and how they can be loaded in a Web experience. You will also see what can be done to manage the number of requests in a scenario where the tiles are loaded onto a map. Finally you will be presented how to read the tiles.
### Available heatmap tiles by types
#### [Air Quality API](https://developers.google.com/maps/documentation/air-quality/reference/rest/v1/mapTypes.heatmapTiles/lookupHeatmapTile.md.txt#path-parameters)
- UAQI_RED_GREEN (UAQI, red-green palette): Universal Air Quality Index red-green palette.
- UAQI_INDIGO_PERSIAN (UAQI, indigo-persian palette): Universal Air Quality Index indigo-persian palette.
- PM25_INDIGO_PERSIAN: PM2.5 index indigo-persian palette.
- GBR_DEFRA: Daily Air Quality Index (UK) color palette.
- DEU_UBA: German Local Air Quality Index color palette.
- CAN_EC: Canadian Air Quality Health Index color palette.
- FRA_ATMO: France Air Quality Index color palette.
- US_AQI: US Air Quality Index color palette.
#### [Pollen API](https://developers.google.com/maps/documentation/pollen/reference/rest/v1/mapTypes.heatmapTiles/lookupHeatmapTile.md.txt#maptyp)
- TREE_UP: The heatmap type will represent a tree index graphical map.
- GRASS_UPI: The heatmap type will represent a grass index graphical map.
- WEED_UPI: The heatmap type will represent a weed index graphically map.
### Display heatmap tiles in Web
Load the tiles and apply a vector mask to only display desired areas of the map's viewport.
#### Loading the tiles
- Use [Maps JavaScript API](https://developers.google.com/maps/documentation/javascript/overview.md.txt) to load the **Google basemap** and load [deckgl](https://deck.gl/) library to prepare for loading raster tile images.
- Use deck.gl [TileLayer](https://deck.gl/docs/api-reference/geo-layers/tile-layer) to load [Air Quality](https://developers.google.com/maps/documentation/air-quality/overview.md.txt)**Heatmap tiles.** This will display Google Maps basemap labels on top of heatmap tiles (unlike [Maps JavaScript custom overlays](https://developers.google.com/maps/documentation/javascript/customoverlays.md.txt))
```c++
import { TileLayer } from "deck.gl";
import { GoogleMapsOverlay } from "@deck.gl/google-maps";
// const TileLayer = deck.TileLayer;
// const GoogleMapsOverlay = deck.GoogleMapsOverlay;
// Initialize and add the map
function initMap() {
const map = new google.maps.Map(document.getElementById("map"), {
center: { lat: 40, lng: -110 },
zoom: 4,
});
const apiKey = 'YOUR_API_KEY';
const airqualityType = 'UAQI_RED_GREEN' // AirQuality API heatmap type
const deckOverlay = new GoogleMapsOverlay({
layers: [
// Heatmap Tiles layer
new TileLayer({
id: 'heatmap-tiles',
data: 'https://airquality.googleapis.com/v1/mapTypes/'+ heatmapType + +'/heatmapTiles/{z}/{x}/{y}?key=' + apiKey,
...
})
],
});
deckOverlay.setMap(map);
}
window.initMap = initMap;
```
#### Applying a vector Mask
You can visually hide or show any part of the heatmap tiles. Important: You will need to acquire the data that will be used to create the vector mask applied to the heatmap tiles.
- In an Area:
- use deck.gl **[GeoJson](https://deck.gl/docs/api-reference/layers/geojson-layer) to create a Mask** over the Air Quality TileLayer.
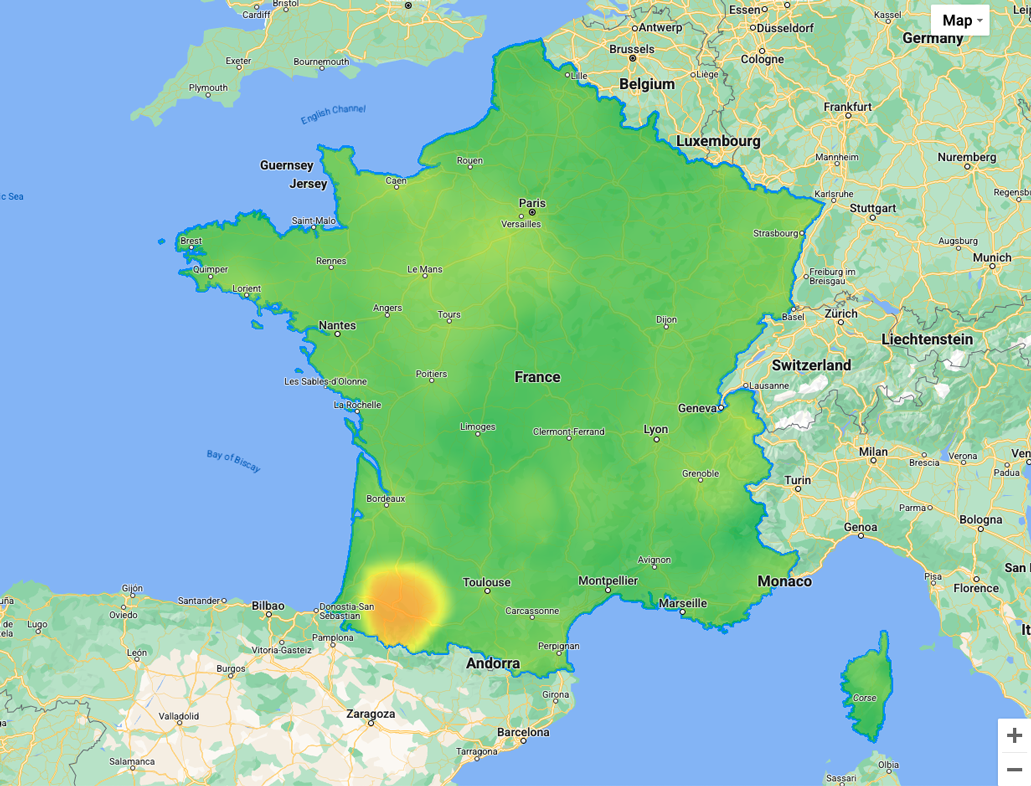
The example below is using a multipolygon geojson of France
```c++
// geojson sample
{ "type": "Feature",
"geometry": {
"type": "MultiPolygon",
"coordinates": [[[[-54.111527,2.11427],...[-54.194491,2.163073]]]]
},
"properties": {
"name": "France"
}
}
```
Here is a reference for the [deckgl](https://deck.gl/docs/api-reference/geo-layers/tile-layer) implementation:
```c++
// Loaded layers in maps overlay
const deckOverlay = new GoogleMapsOverlay({ layers: layers });
const MaskExtension = deck.MaskExtension; // or import extension
...
// As part of object containing the different layers
const layers = [
// Masking layer
new GeoJsonLayer({
id: 'country-vector',
operation: 'mask',
data: "geojson.json", // <-- any custom geometry
})
...
...
// Heatmap Tiles layer
new TileLayer({
id: 'heatmap-tiles',
maskId: 'country-vector', // <-- same as mask id
extensions: [new MaskExtension()], // <-- enable mask extension
...
})
]
```
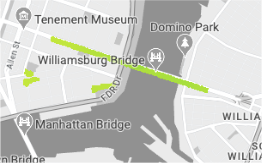
- Along a Route: Use [deck.gl](https://developers.google.com/maps/architecture/air-quality-pollen-areas-routes/deck.gl) with its **[TripsLayer](https://developers.google.com/maps/documentation/javascript/examples/deckgl-tripslayer.md.txt) to create a** **Mask** over the Air Quality TileLayer
Air Quality heatmap tile over a trip
### Manage API requests and cost
While the browser's default behavior is usually to cache all loaded tiles in local storage (within the same session) you can further optimize:
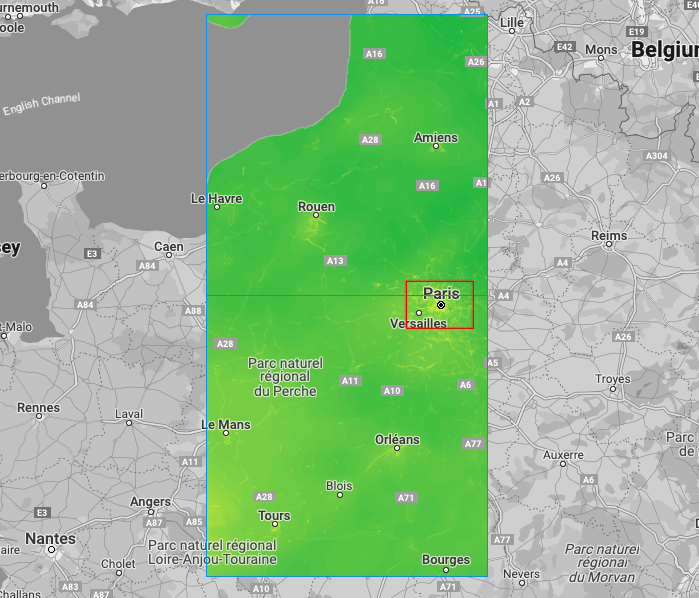
- Restrict the loading area: create a [bounding box](https://developers.google.com/maps/documentation/javascript/reference/coordinates.md.txt#LatLngBounds)(in red) and assign it to the layer, only heatmap tiles (in blue) covering the bounding box will load at any given zoom level
Bounding Box (in red), Heatmap tiles (in blue)
```c++
// Heatmap Tile layer
new TileLayer({
id: 'heatmap-tiles',
extent: [minX, minY, maxX, maxY] // bounding box: southwest lat, southwest lng, northeast lat, northeast lng
...
})
```
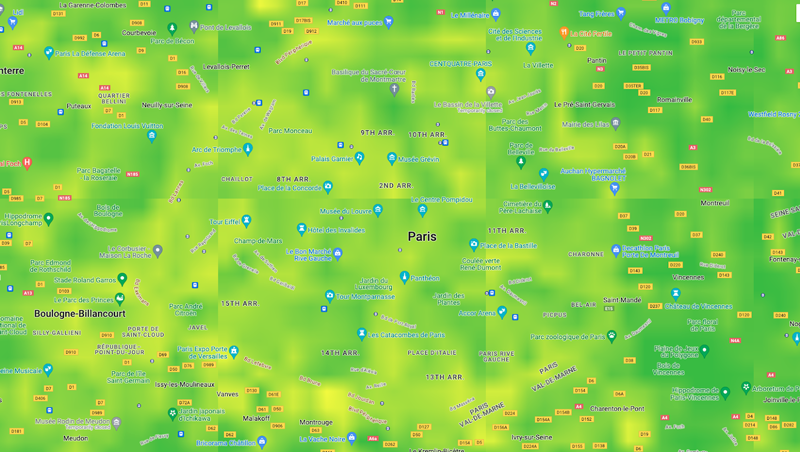
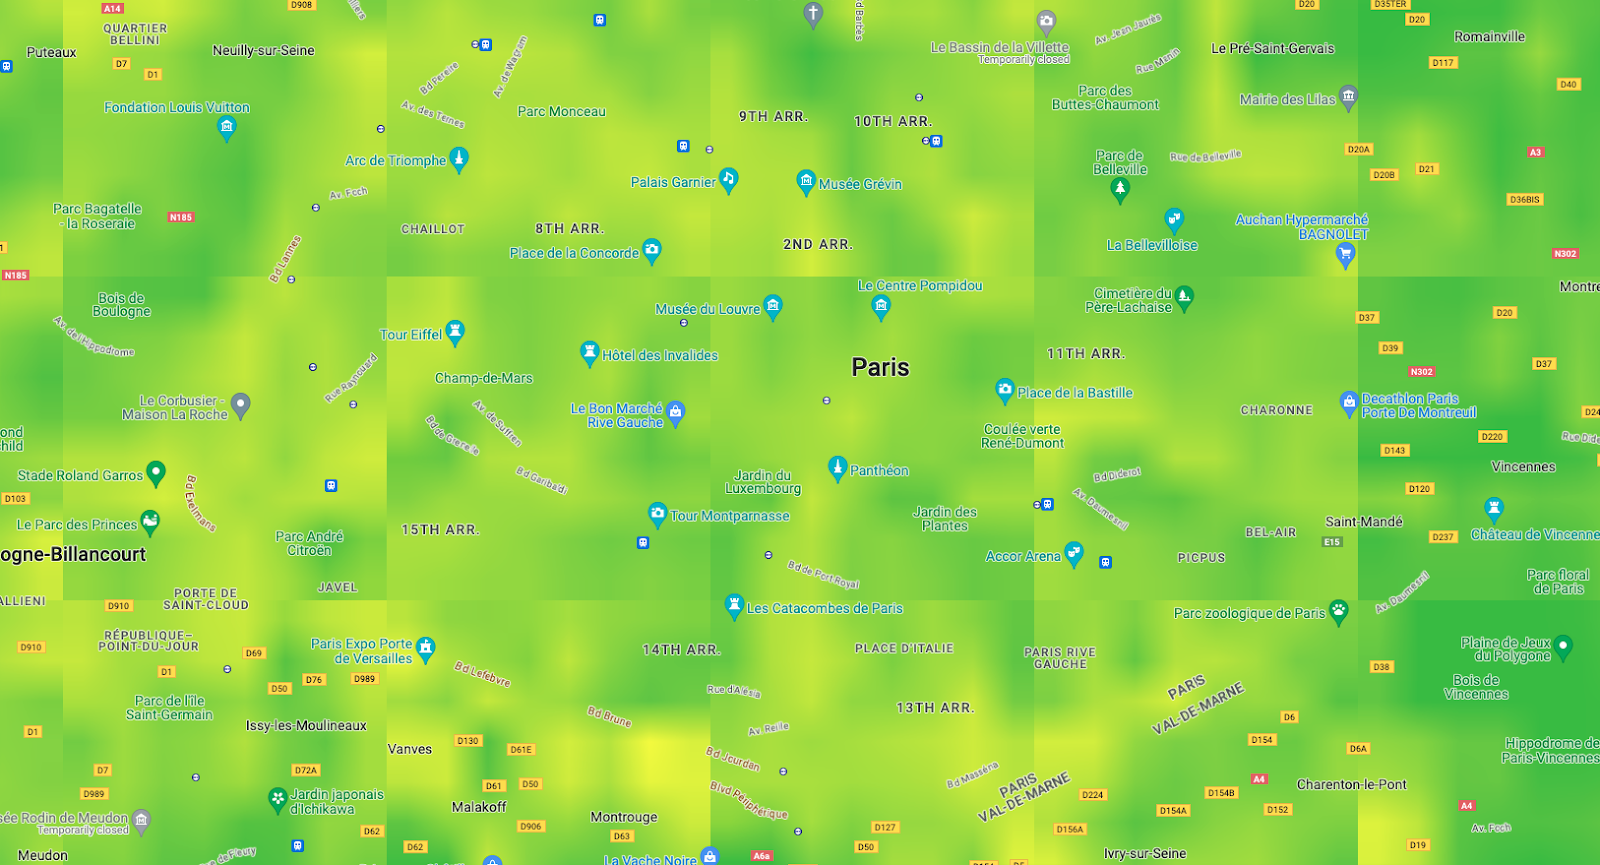
- Set visual display tile size to cover the entire viewport at any given zoom level; recommended: between 256 to 1024.
Important: APIs tiles remain at 256x256 resolution but visual display adjustment will allow you to increase/decrease the number of tiles requests to cover the entire map Viewport
(make sure it works with [minZoom](https://developers.google.com/maps/documentation/javascript/interaction.md.txt#overview) and [maxZoom](https://developers.google.com/maps/documentation/javascript/interaction.md.txt#overview) of the Google Map, ie: `tilesize:1024 `will not load tiles at zoom 0 or 1).
Viewport with tiles 256x256 pixels vs 512x512 pixels
```c++
// Heatmap Tile layer
new TileLayer({
id: 'heatmap-tiles',
tilesize:256, // <-- change to 512 for instance
...
})
```
> [!TIP]
> **Tip:** refine layer tile render setting with refinementStrategy:'no-overlap' over 'best-available' to avoid visual collision between the tiles.
### Read pixel values
> [!WARNING]
> **Warning:** You can read and cache for 1 hour (not indefinitely), the heatmap tiles or any values read from individual pixels contained in the Air Quality or Pollen API tiles. Refer to the API Specific terms detailed in section '16 Air Quality API' to validate your implementation
#### To display the corresponding value on a color scale
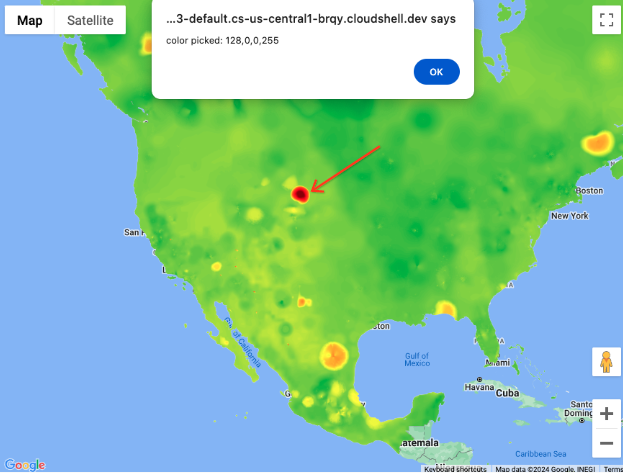
You can use [Luma.gl](https://developers.google.com/maps/architecture/air-quality-pollen-areas-routes/Luma.gl) library and its readPixelsToArray method upon an onClick event assigned as prop to the deck.gl layer.
Pixel value: rgba(128,0,0,255)
LOW 
HIGH
```c++
// Uint8Array pixel sample
import { readPixelsToArray } from "@luma.gl/core";
...
// assign on the TileLayer
new TileLayer({
id: 'heatmap-tiles',
...
onClick: ({
bitmap,
layer
}) => {
if (bitmap) {
const pixel = readPixelsToArray(layer.props.image, {
sourceX: bitmap.pixel[0],
sourceY: bitmap.pixel[1],
sourceWidth: 1,
sourceHeight: 1
});
// console.log("color picked:"+ pixel);
}
}
})
```
## Conclusion
You discovered how [Air Quality](https://developers.google.com/maps/documentation/air-quality/heatmaps.md.txt) and [Pollen](https://developers.google.com/maps/documentation/pollen/heatmap-tiles.md.txt) heatmap tiles API endpoints can be:
- loaded on a Google Map in Web also making sure to be inline with the [Terms of use](https://developers.google.com/maps/documentation/air-quality/policies.md.txt#map)
- optimized to match your use case
- read the tiles values
### Next Actions
Suggested further reading:
- [Air quality awareness for Places using Air Quality API](https://developers.google.com/maps/architecture/air-quality-awareness-for-places.md.txt)
### Contributors
Principal authors:
[Thomas Anglaret](https://www.linkedin.com/in/thomas-anglaret/) \| Google Maps Platform Solutions Engineer