Mean Squared Error
Consider the following two plots:
 |
|
Explore the options below.
Which of the two data sets shown in the preceding plots
has the higher Mean Squared Error (MSE)?
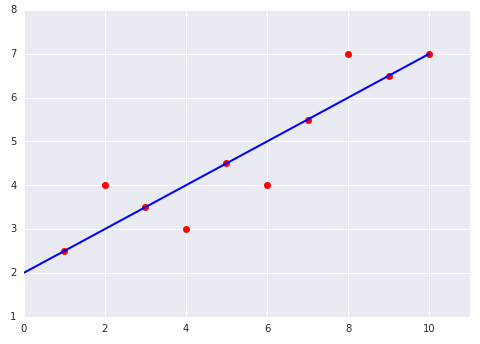
The dataset on the left.
The six examples on the line incur a total loss of 0. The four examples
not on the line are not very far off the line, so even squaring their
offset still yields a low value:
$$ MSE = \frac{0^2 + 1^2 + 0^2 + 1^2 + 0^2 + 1^2 + 0^2 + 1^2 + 0^2 +
0^2} {10} = 0.4$$
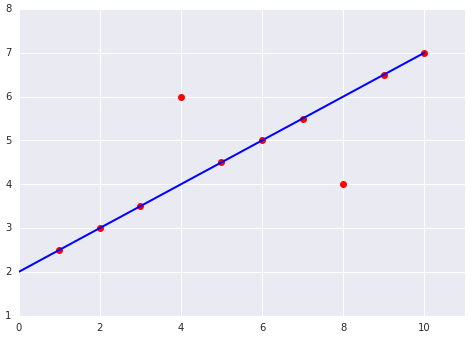
The dataset on the right.
The eight examples on the line incur a total loss of 0. However,
although only two points lay off the line, both of those
points are twice as far off the line as the outlier points
in the left figure. Squared loss amplifies those differences,
so an offset of two incurs a loss four times as great as an offset
of one.
$$ MSE = \frac{0^2 + 0^2 + 0^2 + 2^2 + 0^2 + 0^2 + 0^2 + 2^2 + 0^2 +
0^2} {10} = 0.8$$