
कम्यूनिटी विज़ुअलाइज़ेशन का इस्तेमाल एक चार्ट फ़िल्टर के तौर पर किया जा सकता है. इसके लिए, की मदद से रिपोर्ट बना सकते हैं.
कम्यूनिटी विज़ुअलाइज़ेशन चार्ट के फ़िल्टर कैसे काम करते हैं
कम्यूनिटी विज़ुअलाइज़ेशन को चार्ट फ़िल्टर के तौर पर इस्तेमाल करने के लिए:
config.interactionsप्रॉपर्टी को कॉन्फ़िगर करें- फ़िल्टर की जानकारी के साथ
dscc.sendInteraction()को कॉल करने वाला कोड लिखें.
इंटरैक्शन तय करना
अगर आपके विज़ुअलाइज़ेशन में इंटरैक्शन की सुविधा है, तो वे तय किया गया है. परिभाषित किए जाने पर, प्रॉपर्टी पैनल.

उदाहरण के लिए, config.interactions:
{
  "data": ...,
  "style": ...,
  "interactions": [
    {
      "id": "interactionsConfigId",
      "supportedActions": ["FILTER"]
    }
  ]
}
फ़िल्टर के लिए कोड लिखा जा रहा है
उपयोगकर्ता इंटरैक्शन को फ़िल्टर कार्रवाई से जोड़ने के लिए dscc.sendInteraction() का इस्तेमाल करें.
उदाहरण:
const handleInteraction = () => {
  // this is the interactionId defined in the config
  const interactionId = "interactionConfigId";

  // the ID of the field you want to filter on
  const dimensionId = "qt_ky8sltutsb";

  // the value of the field you want to filter on
  const value = "USA";

  // the interaction type - only FILTER is supported right now
  const FILTER = dscc.InteractionType.FILTER;

  let interactionData = {
    concepts: [dimensionId],
    values: [[value]]
  };

  // send Looker Studio an instruction to filter other charts in the dashboard
  dscc.sendInteraction(interactionId, FILTER, interactionData);
};
अगर रिपोर्ट जनरेट करती है, तो Looker Studio dscc.sendInteraction के भेजे गए मैसेज को अनदेखा कर देगा
एडिटर ने "फ़िल्टर" को चालू नहीं किया है आपके विज़ुअलाइज़ेशन के लिए इंटरैक्शन.
फ़िल्टर की स्थिति पर नज़र रखना
Looker Studio, आपके विज़ुअलाइज़ेशन को जो data ऑब्जेक्ट भेजता है उससे जानकारी मिलती है
इंटरैक्शन के बारे में है.
उदाहरण के लिए, data.interactions:
"onClick": {
  "value": {
    "type": "FILTER",
      "data": {
      "concepts": [
        "qt_h6oibrb6wb",
        "qt_i6oibrb6wb"
      ],
        "values": [
          [
            "Afternoon",
            "Sunday"
          ],
          [
            "Afternoon",
            "Thursday"
          ],
          [
            "Morning",
            "Tuesday"
          ]
        ]
    }
  },
  "supportedActions": [
    "FILTER"
  ]
}
अगर value.data के बारे में जानकारी नहीं है, तो इसका मतलब है कि विज़ुअलाइज़ेशन फ़िलहाल अन्य फ़िल्टर को फ़िल्टर कर रहा है
कॉम्पोनेंट पर क्लिक करें.
उदाहरण:
const barHighlighting = (interactionsById) => {
  // the interactionId defined in the config
  const interactionId = "interactionConfigId";

  const interactionField = interactionsById[interactionId];

  // if filter is selected
  const filterSelected = interactionField.type === "FILTER";
  // if the viz is currently acting as a filter
  const filterHasData = "data" in interactionField;

  if (filterSelected && filterHasData){
    // call the highlightBar function on the selected data
    highlightBar(interactionField.data);
  } else {
    // clear highlighting if no data selected
    clearHighlight()
  }
}
interactionData का निर्माण हो रहा है
interactionData ऑब्जेक्ट से तय होता है कि Looker Studio,
डैशबोर्ड पर जाएं.
एक डाइमेंशन फ़िल्टर
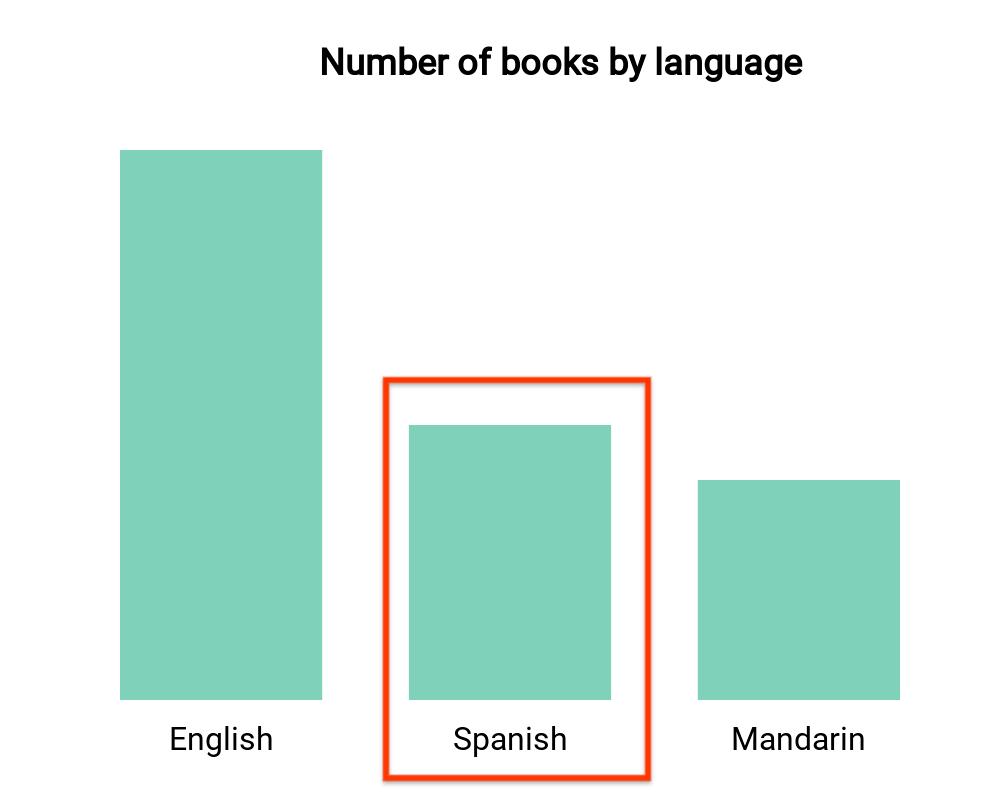
इस बार चार्ट में, भाषा के हिसाब से किताबों की संख्या दिखाई गई है. जैसे- एक डाइमेंशन और एक डाइमेंशन
मेट्रिक). मान लें कि किसी उपयोगकर्ता ने स्पैनिश भाषा की किताबों से जुड़ा बार चुना है और
आपको डैशबोर्ड के बाकी हिस्से को फ़िल्टर करने के लिए चुनना था. आपका
interactionData कुछ ऐसा दिखेगा:
var interactionData = {
  "concepts": ["languageDimensionId"],
  "values": [["Spanish"]]
}
एक से ज़्यादा डाइमेंशन वाला फ़िल्टर
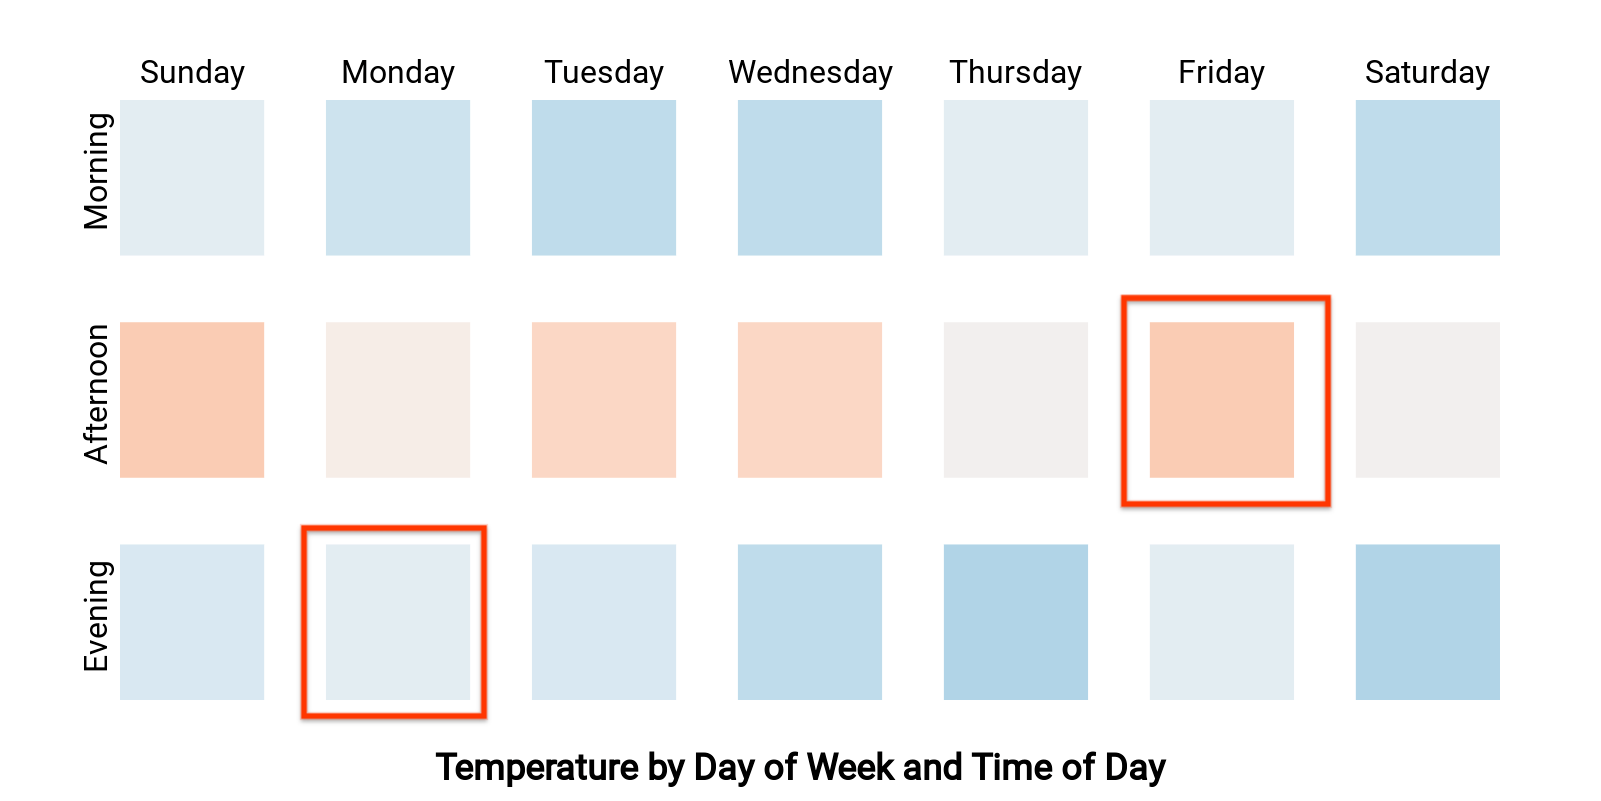
यह हीटमैप, हफ़्ते के दिन और दिन के समय के हिसाब से तापमान दिखाता है (दो डाइमेंशन
और एक मेट्रिक). मान लें कि किसी उपयोगकर्ता ने "सोमवार
शाम" और "शुक्रवार दोपहर" लिखा हुआ है और आपको
डैशबोर्ड में सिर्फ़ "सोमवार की शाम" का डेटा दिखे या "शुक्रवार
दोपहर". आपका interactionData ऐसा दिखेगा:
var interactionData = {
  "concepts": ["dayOfWeekDimensionId", "timeOfDayDimensionId"],
  "values": [
    ["Monday", "evening"],
    ["Friday", "afternoon"]
  ]
}