
ניתן להשתמש בתצוגה חזותית של הקהילה כמסנן תרשים, ולסנן את לדווח באמצעות אינטראקציות עם התצוגה החזותית של הקהילה.
איך פועלים המסננים של תרשים התצוגה החזותית של הקהילה
כדי להשתמש בהצגה חזותית של הקהילה כמסנן של תרשים, צריך:
- הגדרת המאפיין
config.interactions - כותבים קוד ששולח קריאה אל
dscc.sendInteraction()עם פרטי המסנן.
הגדרת אינטראקציות
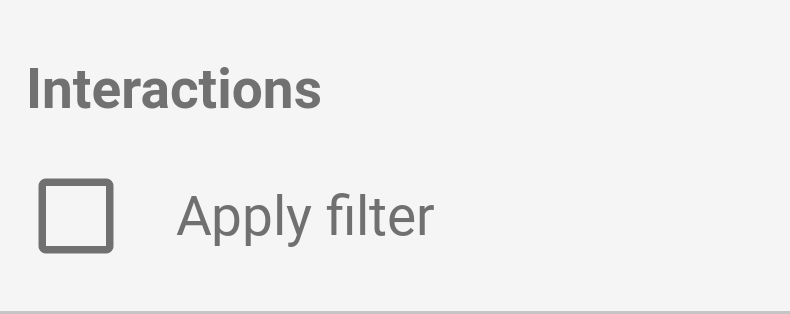
אם התצוגה החזותית תומכת באינטראקציות, מוגדר בהגדרות שלכם. כשהיא מוגדרת, מופיעה תיבת סימון חלונית הנכס.
דוגמה config.interactions:
{
  "data": ...,
  "style": ...,
  "interactions": [
    {
      "id": "interactionsConfigId",
      "supportedActions": ["FILTER"]
    }
  ]
}
בתהליך כתיבת קוד למסנן
כדי לשייך אינטראקציה של משתמש לפעולת סינון, משתמשים בפונקציה dscc.sendInteraction().
דוגמה:
const handleInteraction = () => {
  // this is the interactionId defined in the config
  const interactionId = "interactionConfigId";

  // the ID of the field you want to filter on
  const dimensionId = "qt_ky8sltutsb";

  // the value of the field you want to filter on
  const value = "USA";

  // the interaction type - only FILTER is supported right now
  const FILTER = dscc.InteractionType.FILTER;

  let interactionData = {
    concepts: [dimensionId],
    values: [[value]]
  };

  // send Looker Studio an instruction to filter other charts in the dashboard
  dscc.sendInteraction(interactionId, FILTER, interactionData);
};
מערכת Looker Studio תתעלם מהודעות שנשלחו על ידי dscc.sendInteraction אם הדוח
העורך לא הפעיל את האפשרות 'סינון' ואינטראקציות כדי ליצור את התצוגה החזותית.
מעקב אחרי מצב הסינון
האובייקט data ש-Looker Studio שולח להמחשה חזותית מספק מידע
על אינטראקציות.
דוגמה data.interactions:
"onClick": {
  "value": {
    "type": "FILTER",
      "data": {
      "concepts": [
        "qt_h6oibrb6wb",
        "qt_i6oibrb6wb"
      ],
        "values": [
          [
            "Afternoon",
            "Sunday"
          ],
          [
            "Afternoon",
            "Thursday"
          ],
          [
            "Morning",
            "Tuesday"
          ]
        ]
    }
  },
  "supportedActions": [
    "FILTER"
  ]
}
אם הערך value.data לא מוגדר, התצוגה החזותית מסנן כרגע
הרכיבים השונים של מרכז הבקרה.
דוגמה:
const barHighlighting = (interactionsById) => {
  // the interactionId defined in the config
  const interactionId = "interactionConfigId";

  const interactionField = interactionsById[interactionId];

  // if filter is selected
  const filterSelected = interactionField.type === "FILTER";
  // if the viz is currently acting as a filter
  const filterHasData = "data" in interactionField;

  if (filterSelected && filterHasData){
    // call the highlightBar function on the selected data
    highlightBar(interactionField.data);
  } else {
    // clear highlighting if no data selected
    clearHighlight()
  }
}
מתבצעת הגדרה של interactionData
האובייקט interactionData מגדיר איך Looker Studio יסנן
במרכז הבקרה.
מסנן מאפיינים בודדים
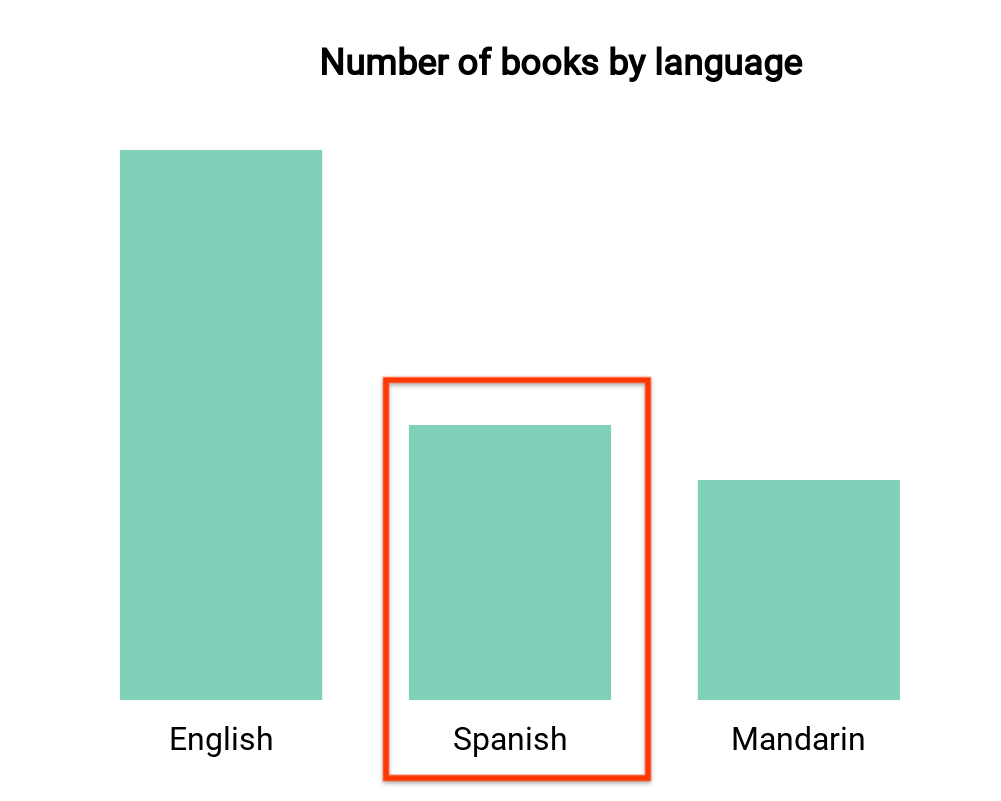
תרשים העמודות הזה מציג את מספר הספרים לפי שפה (מאפיין אחד ומאפיין אחד
). נניח שמשתמש בחר את הסרגל שמתאים לספרים בספרדית,
שרציתם לסנן את שאר לוח הבקרה. שלך
interactionData ייראה כך:
var interactionData = {
  "concepts": ["languageDimensionId"],
  "values": [["Spanish"]]
}
מסנן מאפיינים מרובים
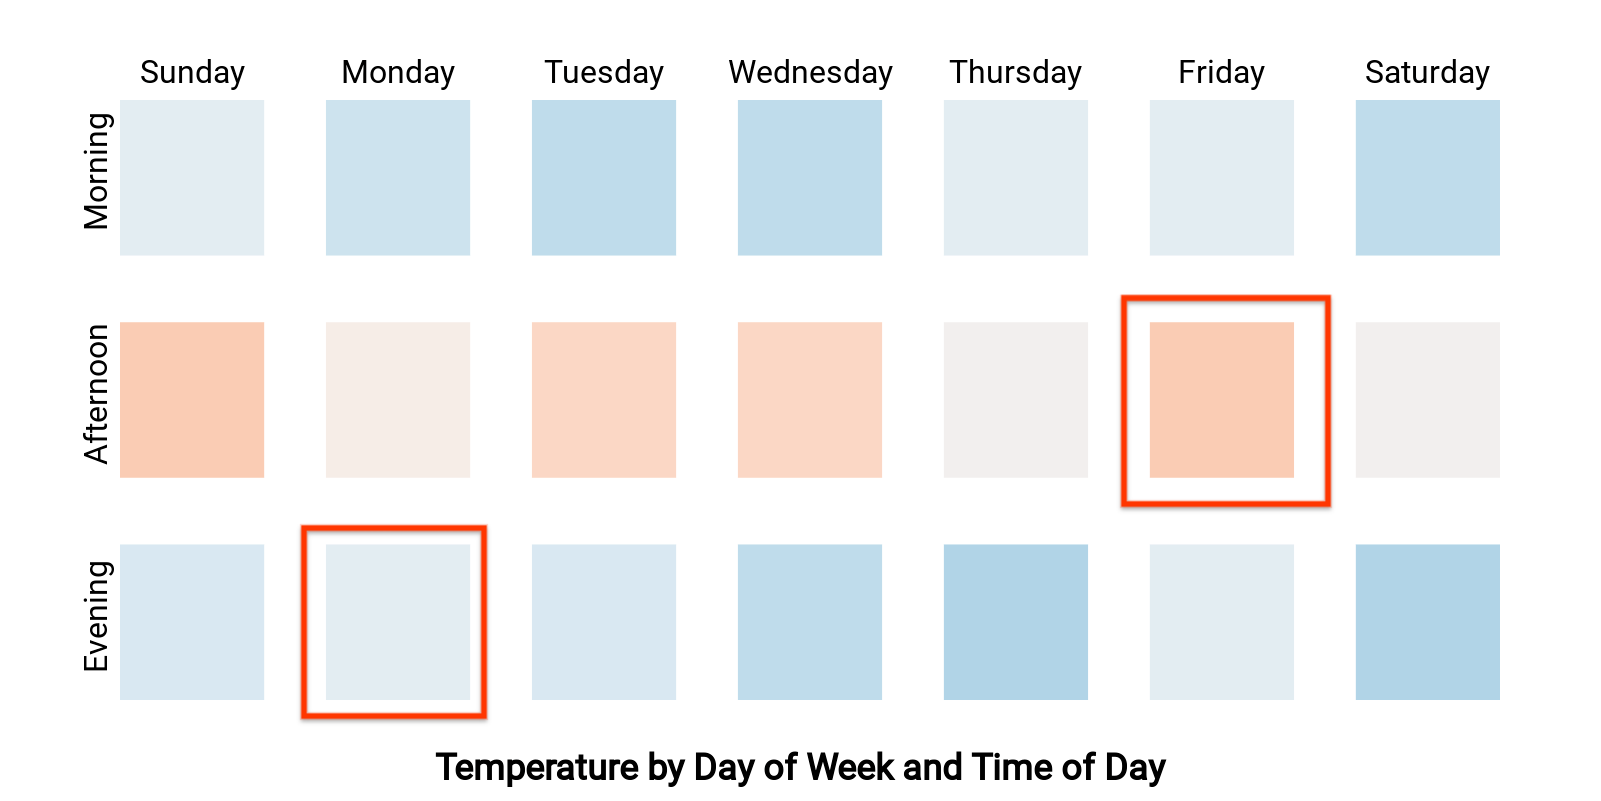
במפת החום הזו מוצגות הטמפרטורה לפי היום בשבוע והשעה ביום (שני מימדים)
ומדד אחד). נניח שמשתמש בחר את התאים שתואמים לכיתוב "יום שני"
ערב" ו"יום שישי אחר הצהריים", ורציתם לסנן את שאר
מרכז הבקרה כך שיציג נתונים רק מ'יום שני בערב' או "יום שישי
אחר הצהריים".interactionData ייראה כך:
var interactionData = {
  "concepts": ["dayOfWeekDimensionId", "timeOfDayDimensionId"],
  "values": [
    ["Monday", "evening"],
    ["Friday", "afternoon"]
  ]
}