
אתם יכולים להשתמש בתצוגה החזותית של הקהילה כמסנן תרשים, ולסנן את הדוח באמצעות אינטראקציות עם התצוגה החזותית של הקהילה.
איך פועלים מסנני תרשימים של ויזואליזציות קהילתיות
כדי להשתמש בסוג ויזואליזציית נתונים במאגר הקהילה (community visualization) כמסנן תרשים, צריך:
- הגדרת המאפיין
config.interactions - כותבים קוד שקורא ל-
dscc.sendInteraction()עם פרטי המסנן.
הגדרת אינטראקציות
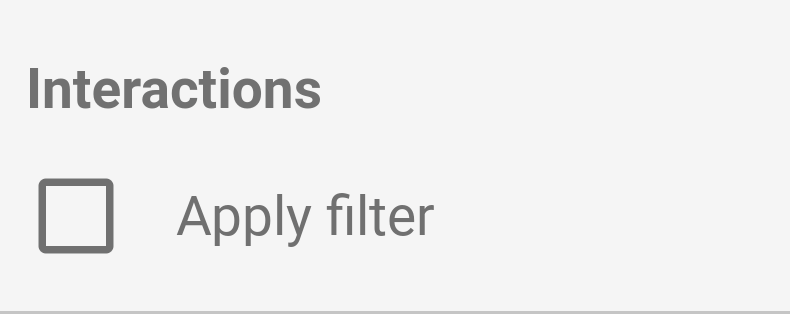
אם הוויזואליזציה תומכת באינטראקציות, צריך להגדיר אותן בקובץ ההגדרות. אם מגדירים את המאפיין הזה, תיבת סימון מופיעה בחלונית המאפיינים.
דוגמה config.interactions:
{
  "data": ...,
  "style": ...,
  "interactions": [
    {
      "id": "interactionsConfigId",
      "supportedActions": ["FILTER"]
    }
  ]
}
כתיבת קוד למסנן
משתמשים ב-dscc.sendInteraction() כדי לשייך אינטראקציה של משתמש לפעולת סינון.
דוגמה:
const handleInteraction = () => {
  // this is the interactionId defined in the config
  const interactionId = "interactionConfigId";

  // the ID of the field you want to filter on
  const dimensionId = "qt_ky8sltutsb";

  // the value of the field you want to filter on
  const value = "USA";

  // the interaction type - only FILTER is supported right now
  const FILTER = dscc.InteractionType.FILTER;

  let interactionData = {
    concepts: [dimensionId],
    values: [[value]]
  };

  // send Data Studio an instruction to filter other charts in the dashboard
  dscc.sendInteraction(interactionId, FILTER, interactionData);
};
Data Studio יתעלם מהודעות שנשלחו על ידי dscc.sendInteraction אם העורך של הדוח לא הפעיל אינטראקציות של 'סינון' עבור הוויזואליזציה.
מעקב אחרי מצב המסנן
אובייקט data ש-Data Studio שולח לתצוגה החזותית שלכם מספק מידע על אינטראקציות.
דוגמה data.interactions:
"onClick": {
  "value": {
    "type": "FILTER",
      "data": {
      "concepts": [
        "qt_h6oibrb6wb",
        "qt_i6oibrb6wb"
      ],
        "values": [
          [
            "Afternoon",
            "Sunday"
          ],
          [
            "Afternoon",
            "Thursday"
          ],
          [
            "Morning",
            "Tuesday"
          ]
        ]
    }
  },
  "supportedActions": [
    "FILTER"
  ]
}
אם value.data לא מוגדר כ-undefined, המשמעות היא שהוויזואליזציה מסננת כרגע רכיבים אחרים בלוח הבקרה.
דוגמה:
const barHighlighting = (interactionsById) => {
  // the interactionId defined in the config
  const interactionId = "interactionConfigId";

  const interactionField = interactionsById[interactionId];

  // if filter is selected
  const filterSelected = interactionField.type === "FILTER";
  // if the viz is currently acting as a filter
  const filterHasData = "data" in interactionField;

  if (filterSelected && filterHasData){
    // call the highlightBar function on the selected data
    highlightBar(interactionField.data);
  } else {
    // clear highlighting if no data selected
    clearHighlight()
  }
}
בנייה של interactionData
אובייקט interactionData מגדיר איך Data Studio יסנן את לוח הבקרה.
מסנן מימד יחיד
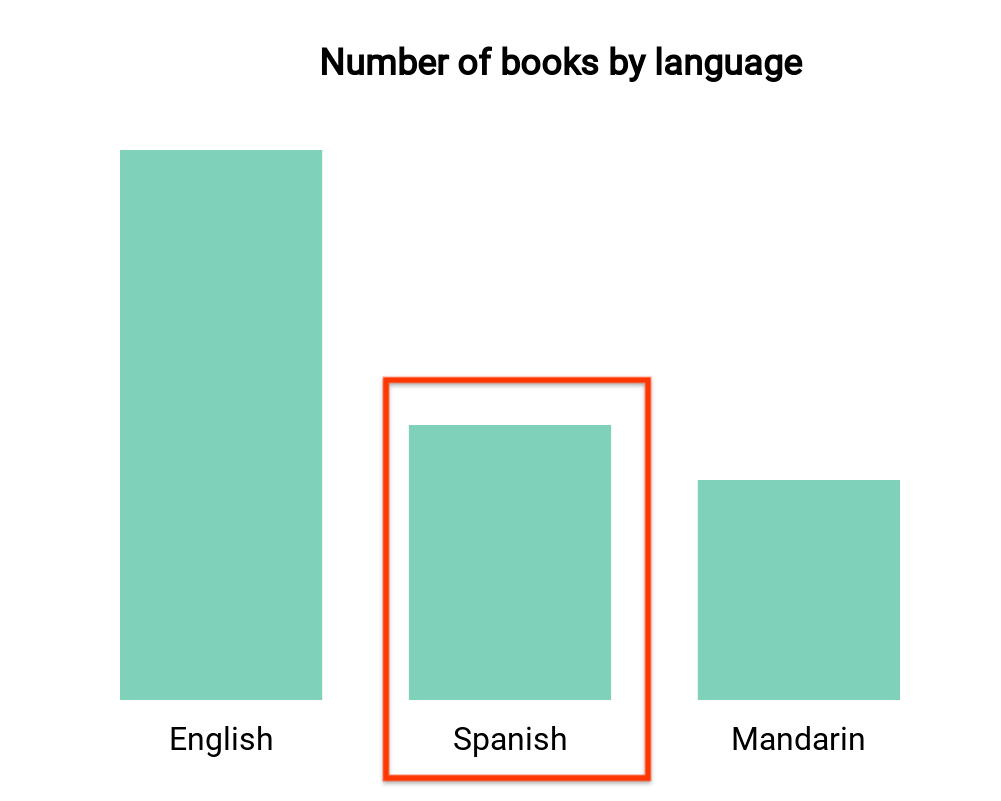
בתרשים העמודות הזה מוצג מספר הספרים לפי שפה (מאפיין אחד ומדד אחד). נניח שמשתמש בחר את העמודה שמתאימה לספרים בספרדית, ואתם רוצים שהבחירה הזו תסנן את שאר לוח הבקרה. התג
interactionData ייראה כך:
var interactionData = {
  "concepts": ["languageDimensionId"],
  "values": [["Spanish"]]
}
מסנן של כמה מימדים
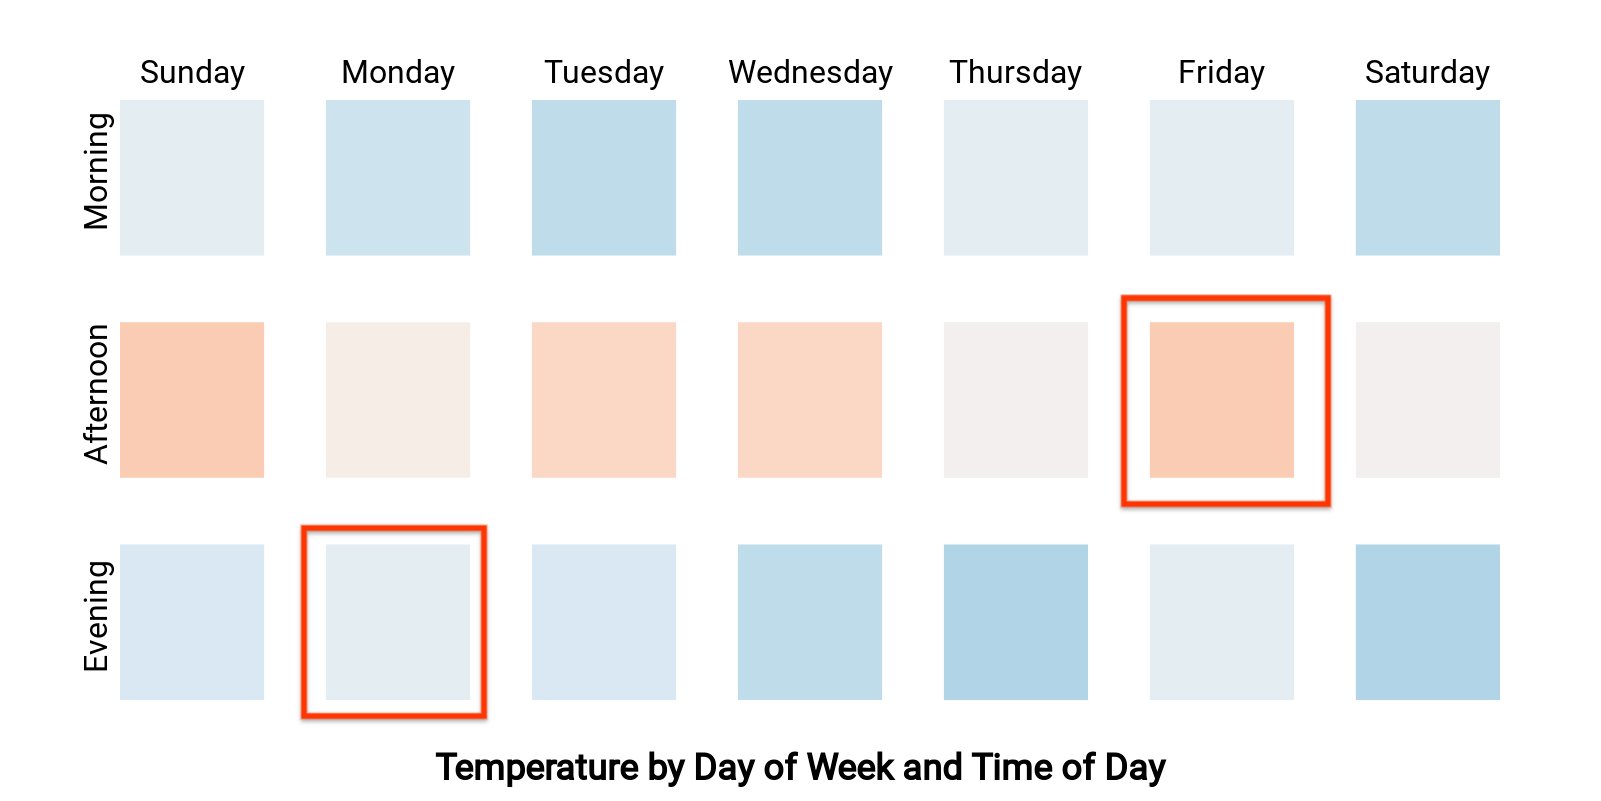
במפת החום הזו מוצגת הטמפרטורה לפי היום בשבוע והשעה ביום (שני מאפיינים ומדד אחד). נניח שמשתמש בחר את התאים שמתאימים ל'יום שני בערב' ול'יום שישי אחר הצהריים', ואתם רוצים לסנן את שאר הנתונים בלוח הבקרה כך שיוצגו רק נתונים מ'יום שני בערב' או מ'יום שישי אחר הצהריים'.הביטוי interactionData ייראה כך:
var interactionData = {
  "concepts": ["dayOfWeekDimensionId", "timeOfDayDimensionId"],
  "values": [
    ["Monday", "evening"],
    ["Friday", "afternoon"]
  ]
}