
您可以将社区可视化图表用作图表过滤器,通过与社区可视化图表的互动来过滤 报告。
社区可视化图表过滤器的工作原理
要将社区可视化图表用作图表过滤器,您需要执行以下操作:
- 配置
config.interactions属性 - 编写可调用包含过滤器信息的
dscc.sendInteraction()的代码。
定义互动
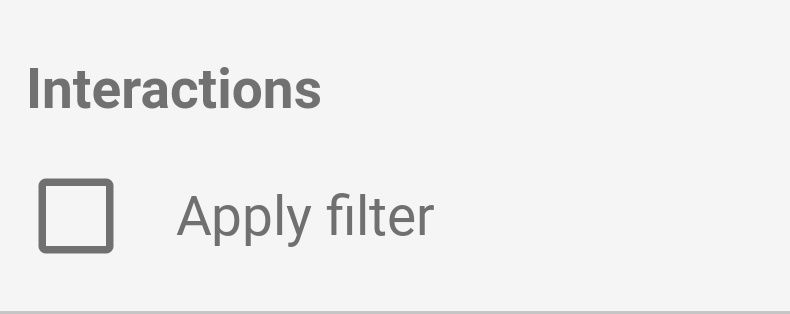
如果您的可视化图表支持互动,则应在配置中定义互动。定义后,属性面板中会显示一个复选框。
config.interactions 示例:
{
  "data": ...,
  "style": ...,
  "interactions": [
    {
      "id": "interactionsConfigId",
      "supportedActions": ["FILTER"]
    }
  ]
}
为过滤器编写代码
使用 dscc.sendInteraction() 将用户互动与某项过滤器操作相关联。
示例:
const handleInteraction = () => {
  // this is the interactionId defined in the config
  const interactionId = "interactionConfigId";

  // the ID of the field you want to filter on
  const dimensionId = "qt_ky8sltutsb";

  // the value of the field you want to filter on
  const value = "USA";

  // the interaction type - only FILTER is supported right now
  const FILTER = dscc.InteractionType.FILTER;

  let interactionData = {
    concepts: [dimensionId],
    values: [[value]]
  };

  // send Data Studio an instruction to filter other charts in the dashboard
  dscc.sendInteraction(interactionId, FILTER, interactionData);
};
如果报告编辑者没有为您的可视化图表启用“过滤”互动,则数据洞察会忽略 dscc.sendInteraction 发送的消息。
跟踪过滤器状态
数据洞察发送到可视化图表的 data 对象提供了有关互动的信息。
data.interactions 示例:
"onClick": {
  "value": {
    "type": "FILTER",
      "data": {
      "concepts": [
        "qt_h6oibrb6wb",
        "qt_i6oibrb6wb"
      ],
        "values": [
          [
            "Afternoon",
            "Sunday"
          ],
          [
            "Afternoon",
            "Thursday"
          ],
          [
            "Morning",
            "Tuesday"
          ]
        ]
    }
  },
  "supportedActions": [
    "FILTER"
  ]
}
如果未定义 value.data,则可视化图表目前在过滤信息中心内的其他组件。
示例:
const barHighlighting = (interactionsById) => {
  // the interactionId defined in the config
  const interactionId = "interactionConfigId";

  const interactionField = interactionsById[interactionId];

  // if filter is selected
  const filterSelected = interactionField.type === "FILTER";
  // if the viz is currently acting as a filter
  const filterHasData = "data" in interactionField;

  if (filterSelected && filterHasData){
    // call the highlightBar function on the selected data
    highlightBar(interactionField.data);
  } else {
    // clear highlighting if no data selected
    clearHighlight()
  }
}
构建 interactionData
interactionData 对象用于定义数据洞察过滤信息中心的方式。
单一维度过滤器
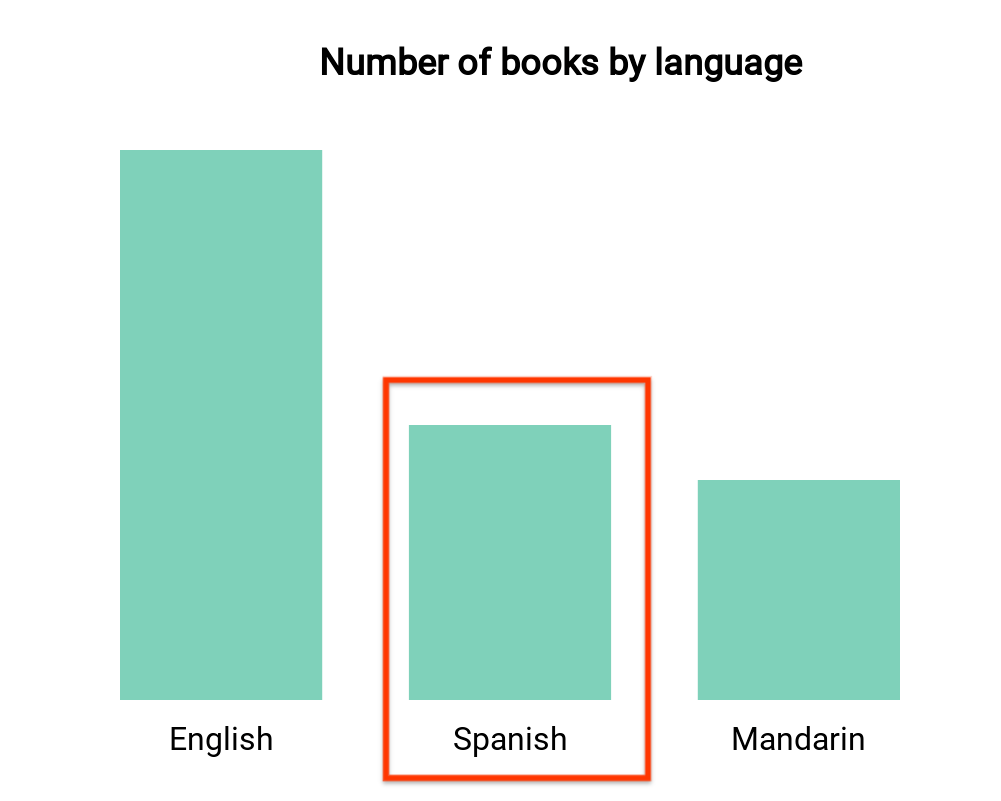
此条形图按语言直观显示图书数量(一个维度和一个指标)。假设一位用户选择了与西班牙语图书对应的栏,您希望该选择可以滤除信息中心内的其余内容。您的
interactionData 大致如下所示:
var interactionData = {
  "concepts": ["languageDimensionId"],
  "values": [["Spanish"]]
}
多维度过滤器
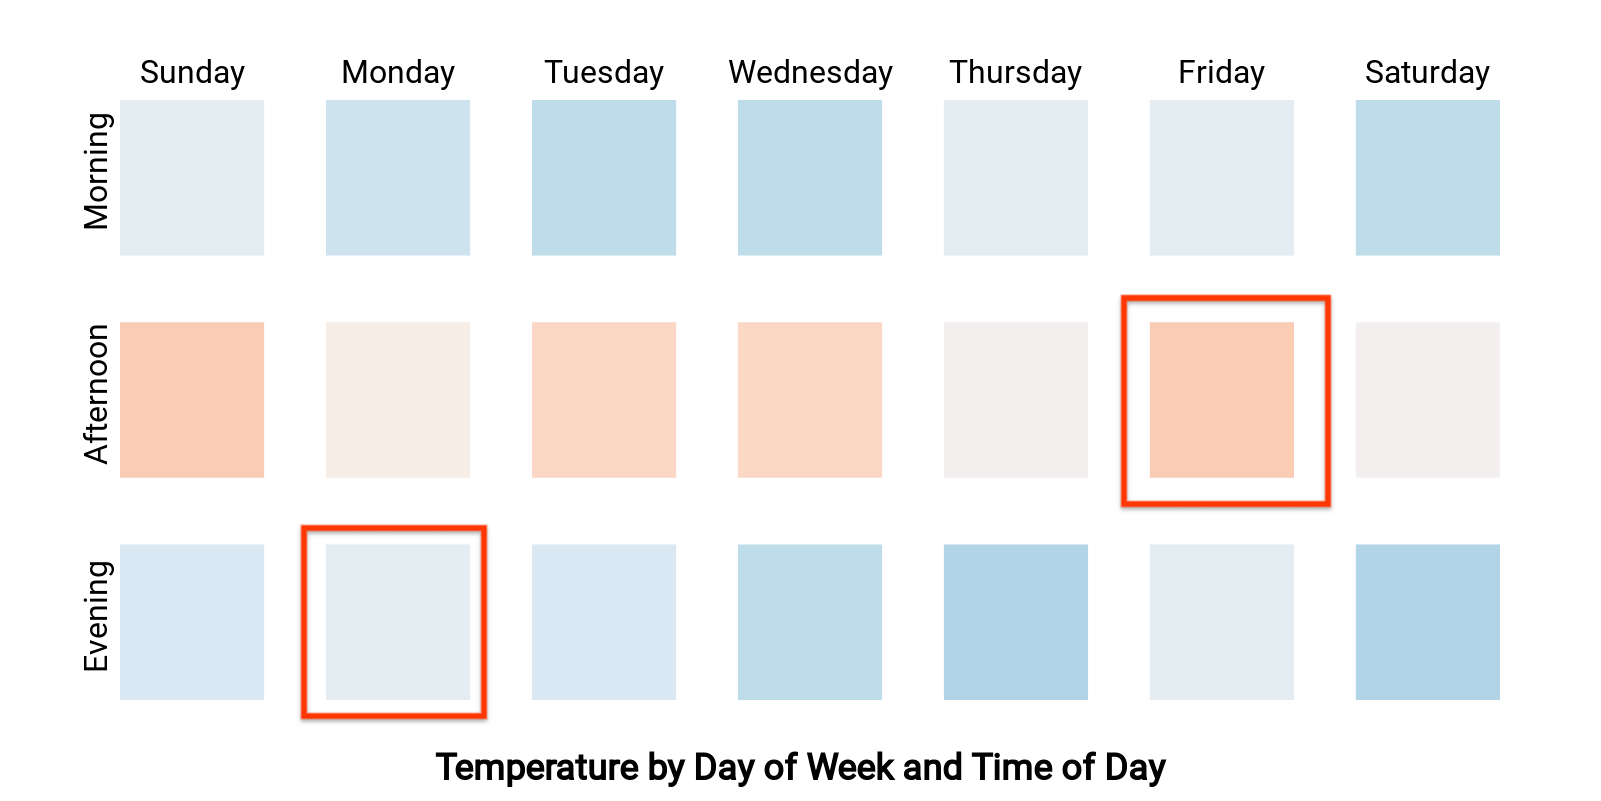
此热图按星期几及具体时段显示温度(两个维度和一个指标)。假设一位用户选择了与“星期一晚上”和“星期五下午”对应的单元格,您希望这可以滤除信息中心内的其余内容,仅显示“星期一晚上”或“星期五下午”的数据。您的
interactionData 大致如下所示:
var interactionData = {
  "concepts": ["dayOfWeekDimensionId", "timeOfDayDimensionId"],
  "values": [
    ["Monday", "evening"],
    ["Friday", "afternoon"]
  ]
}