The Water Occurrence Change Intensity data layer provides a measure of how surface water has changed between two epochs: 1984-1999 and 2000-2015. The layer averages the change across homologous pairs of months taken from the two epochs. See the Data Users Guide (v2) for additional details on this layer.
This section of the tutorial will:
- add a styled map layer for visualizing water occurrence change intensity, and
- summarize the change intensity in a specified region-of-interest using a histogram.
Visualization
Similar to the water occurrence layer, we will start by adding a basic visualization of occurrence change intensity to the map and then improve upon it. Occurrence change intensity is provided in two ways, both as absolute and normalized values. We will use the absolute values in this tutorial. Start by selecting the absolute occurrence change intensity layer from the GSW image:
Code Editor (JavaScript)
var change = gsw.select("change_abs");
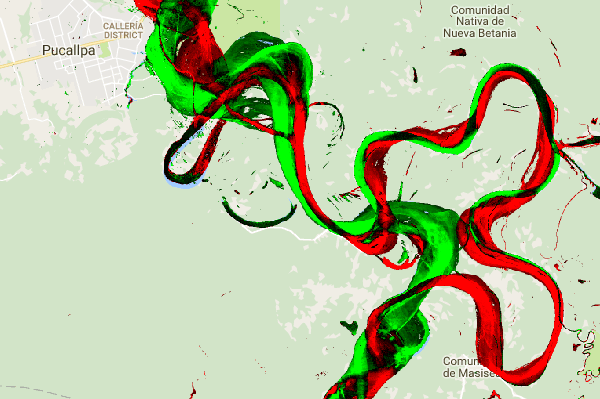
In the Constants section of the code, add a statement that creates a new variable that defines how the layer will be styled. This styling shows areas where the surface water occurrence has decreased/increased in red/green. Areas where surface water occurrence is relatively unchanged are shown in black.
Code Editor (JavaScript)
var VIS_CHANGE = {
    min:-50,
    max:50,
    palette: ['red', 'black', 'limegreen']
};
At the end of the Map Layers section of code, add a statement that adds a new layer to the map.
Code Editor (JavaScript)
Map.setCenter(-74.4557, -8.4289, 11);  // Ucayali River, Peru
Map.addLayer({
  eeObject: change,
  visParams: VIS_CHANGE,
  name: 'occurrence change intensity'
});
Summarizing Change within a Region of Interest
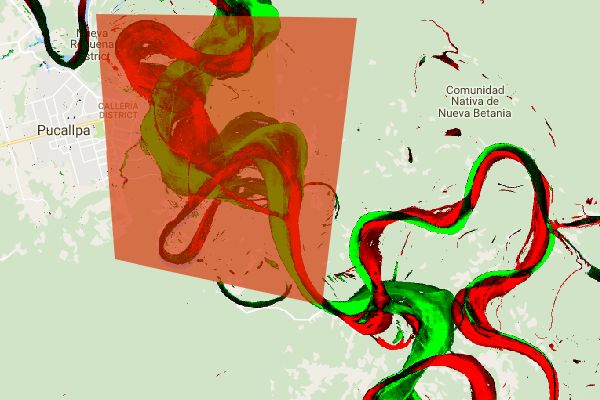
In this section, we will summarize the amount of change within a specified region of interest. To specify a region of interest, click on the polygon drawing tool, which is one of the Geometry tools. This will create a new Geometry Imports layer, which is named "geometry" by default. To change the name, click on the gear icon located to the right of the to the layer name. (Note that you may need to place your cursor on the layer name to make it appear.)
Change the layer name to roi (for region-of-interest or ROI). We then can click on a
series of points on the map to define a polygon region of interest.
Now that our region-of-interest is defined and stored in a variable, we can use it to calculate a histogram of the change intensity for the ROI. Add the following code to the Calculations section of the script.
Code Editor (JavaScript)
// Calculate a change intensity for the region of interest.
var histogram = change.reduceRegion({
reducer: ee.Reducer.histogram(),
geometry: roi,
scale: 30,
bestEffort: true,
});
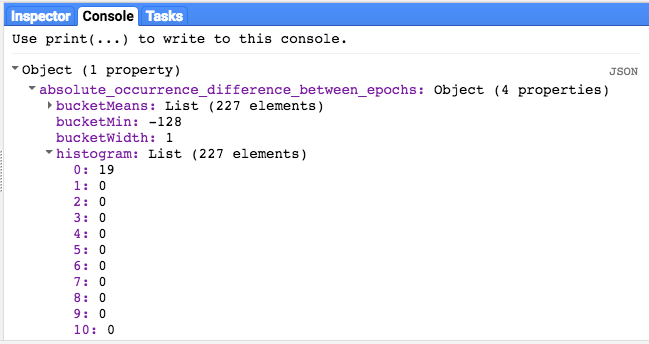
print(histogram);
The first statement calculates a histogram of occurrence change intensity values within the ROI, sampling at a 30m scale. The second prints the resulting object to the Code Editor Console Tab. You can expand out the object tree to view the values of the histogram buckets. The numeric data is there, but there are better ways to visualize the results.
To improve upon this, we can generate a histogram chart instead. Replace the statement that defines the histogram object with the following statements:
Code Editor (JavaScript)
// Generate a histogram object and print it to the console tab.
var histogram = ui.Chart.image.histogram({
  image: change,
  region: roi,
  scale: 30,
  minBucketWidth: 10
});
histogram.setOptions({
  title: 'Histogram of surface water change intensity.'
});
These statements create a histogram chart object, which replaces the histogram object tree
in the Console Tab with a chart. The chart method contains several arguments, including
scale which defines the spatial scale, in meters, at which the region of interest'
is sampled, and
minBucketWidth which is used to control the width of the histogram
buckets.
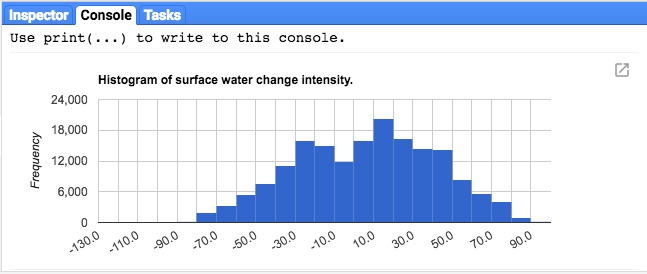
You can explore the chart values interactively by placing your cursor over the histogram bars.
Final Script
The entire script for this section is listed below. Note that the script includes statements
for defining a polygon geometry (roi), which is comparable to the geometry that
you created using the Code Editor's geometry tools.
Code Editor (JavaScript)
//////////////////////////////////////////////////////////////
// Asset List
//////////////////////////////////////////////////////////////

var gsw = ee.Image('JRC/GSW1_0/GlobalSurfaceWater');
var occurrence = gsw.select('occurrence');
var change = gsw.select("change_abs");
var roi = /* color: 0B4A8B */ee.Geometry.Polygon(
        [[[-74.17213, -8.65569],
          [-74.17419, -8.39222],
          [-74.38362, -8.36980],
          [-74.43031, -8.61293]]]);

//////////////////////////////////////////////////////////////
// Constants
//////////////////////////////////////////////////////////////

var VIS_OCCURRENCE = {
    min:0,
    max:100,
    palette: ['red', 'blue']
};
var VIS_CHANGE = {
    min:-50,
    max:50,
    palette: ['red', 'black', 'limegreen']
};
var VIS_WATER_MASK = {
  palette: ['white', 'black']
};

//////////////////////////////////////////////////////////////
// Calculations
//////////////////////////////////////////////////////////////

// Create a water mask layer, and set the image mask so that non-water areas are transparent.
var water_mask = occurrence.gt(90).mask(1);

// Generate a histogram object and print it to the console tab.
var histogram = ui.Chart.image.histogram({
  image: change,
  region: roi,
  scale: 30,
  minBucketWidth: 10
});
histogram.setOptions({
  title: 'Histogram of surface water change intensity.'
});
print(histogram);

//////////////////////////////////////////////////////////////
// Initialize Map Location
//////////////////////////////////////////////////////////////

// Uncomment one of the following statements to center the map on
// a particular location.
// Map.setCenter(-90.162, 29.8597, 10);   // New Orleans, USA
// Map.setCenter(-114.9774, 31.9254, 10); // Mouth of the Colorado River, Mexico
// Map.setCenter(-111.1871, 37.0963, 11); // Lake Powell, USA
// Map.setCenter(149.412, -35.0789, 11);  // Lake George, Australia
// Map.setCenter(105.26, 11.2134, 9);     // Mekong River Basin, SouthEast Asia
// Map.setCenter(90.6743, 22.7382, 10);   // Meghna River, Bangladesh
// Map.setCenter(81.2714, 16.5079, 11);   // Godavari River Basin Irrigation Project, India
// Map.setCenter(14.7035, 52.0985, 12);   // River Oder, Germany & Poland
// Map.setCenter(-59.1696, -33.8111, 9);  // Buenos Aires, Argentina\
Map.setCenter(-74.4557, -8.4289, 11);  // Ucayali River, Peru

//////////////////////////////////////////////////////////////
// Map Layers
//////////////////////////////////////////////////////////////

Map.addLayer({
  eeObject: water_mask,
  visParams: VIS_WATER_MASK,
  name: '90% occurrence water mask',
  shown: false
});
Map.addLayer({
  eeObject: occurrence.updateMask(occurrence.divide(100)),
  name: "Water Occurrence (1984-2015)",
  visParams: VIS_OCCURRENCE,
  shown: false
});
Map.addLayer({
  eeObject: change,
  visParams: VIS_CHANGE,
  name: 'occurrence change intensity'
});
In the next section, you will further explore how water changed over time, by working with the water class transition layer.