A FeatureView is a view-only, accelerated representation of a
FeatureCollection.
Unlike a FeatureCollection, whose raster map tiles are generated on the
fly, FeatureView raster tiles are pre-computed to provide rapid rendering.
In addition to rendering faster, FeatureView assets implement zoom
level-dependent feature thinning. The effect is that dense datasets might look
incomplete when zoomed out (small features are not drawn), but more of the data
becomes visible as you zoom in, which can improve map aesthetics at lower zoom
levels. The thinning behavior of a dataset is controlled by several
optimization parameters
that are set during export of a FeatureCollection to a FeatureView asset.
As a view-only asset, FeatureView objects cannot be included in computations
or expressions, but can be visualized and inspected in the JavaScript Code
Editor and Earth Engine Apps as a FeatureViewLayer. They can also be
integrated into Google Maps API applications.
Creating a FeatureView
Creating a FeatureView involves preparing a FeatureCollection with your
data, calling the Export.table.toFeatureView function, and starting the
export task. The following example demonstrates exporting views of the
WDPA polygons dataset.
In your own application, use any FeatureCollection dataset archived in the
Earth Engine Data Catalog or create your own by
uploading a vector dataset
as an Earth Engine asset.
A FeatureView can be customized using several parameters in the
Export.table.toFeatureView function.
maxFeaturesPerTile— defines the maximum number of features displayed in a map tile at a given zoom level. Use this parameter to optimize for speed or feature density.thinningStrategy— controls whether feature thinning for a given tile and zoom level should be optimized for higher density or consistency in density across tiles. Note that optimizing for higher density can cause tile boundaries to become distinct, as feature density per tile is independent.thinningRanking— defines feature thinning priority. For example, you can optimize thinning to target the retention of a particular feature property with high values –in other words, as you zoom out, features that have a low value for the selected property will be thinned out first, leaving the most important features (according to your rules) visible.zOrderRanking— defines the z-order (stack order) of features displayed on the map. This parameter controls how overlapping features are displayed by allowing you to set priority rules based on feature properties, geometry type, and zoom level. For example, you can prioritize features with high values of a particular property so that they overlay on top of intersecting features with low values.
See the
FeatureView Optimization page
for more details on these parameters and their accepted arguments.
In the example below, the specified arguments for these parameters produce a
FeatureView where the maximum features per tile at a given zoom level is
1500, the density of features per tile is independent and allowed to reach
the maximum of 1500, smaller polygons are thinned out first, and smaller
polygons lay on top of larger ones.
Code Editor (JavaScript)
// Import the WDPA feature collection.
var wdpa = ee.FeatureCollection('WCMC/WDPA/current/polygons');

// Export the WDPA FeatureCollection as a FeatureView asset.
Export.table.toFeatureView({
  collection: wdpa,
  assetId: 'wdpa-featureview-demo',
  description: 'wdpa-featureview-demo',
  maxFeaturesPerTile: 1500,
  thinningStrategy: 'HIGHER_DENSITY',
  thinningRanking: ['REP_AREA DESC'],
  zOrderRanking: ['REP_AREA DESC'],
});
Executing the above code snippet in the Code Editor will generate an export task; run the task to initiate the export.
FeatureView asset locations
FeatureView assets can be found in the public
Data Catalog and among your
personal assets in the Code Editor's
Assets tab. All relevant FeatureCollection assets in the Data Catalog
have a companion FeatureView asset with generally applicable ingestion
settings. Your personal asset archive will include any
FeatureView assets you create.
Importing FeatureView assets into scripts
FeatureView assets can be imported into Code Editor scripts using
buttons in Code Editor asset dialogs and personal asset entries, and by
providing a FeatureView asset ID as input to the ui.Map.FeatureViewLayer
constructor.
Data Catalog asset dialog
Data Catalog table asset dialogs, accessed from the Code Editor's search bar, have an Import button at the lower right with a drop-down menu. From the drop-down menu, select "Import FeatureView". The asset will be included in the Imports section at the top of your script.
Personal asset dialog
Personal FeatureView asset dialogs, accessed by selecting an asset from the
Code Editor's Assets tab, have an Import button at the upper right.
Activating the button will include the asset in the Imports section
at the top of your script. You can also use the import shortcut button
(right-pointing arrow icon) that appears when you hover over an asset in the
Assets tab.
Asset ID
FeatureView assets have an ID that can be provided as input to the
ui.Map.FeatureViewLayer constructor, which gives you access to the asset in
your script. Pre-constructed import snippets can be found in Data Catalog asset
pages and asset dialogs in the Code Editor.
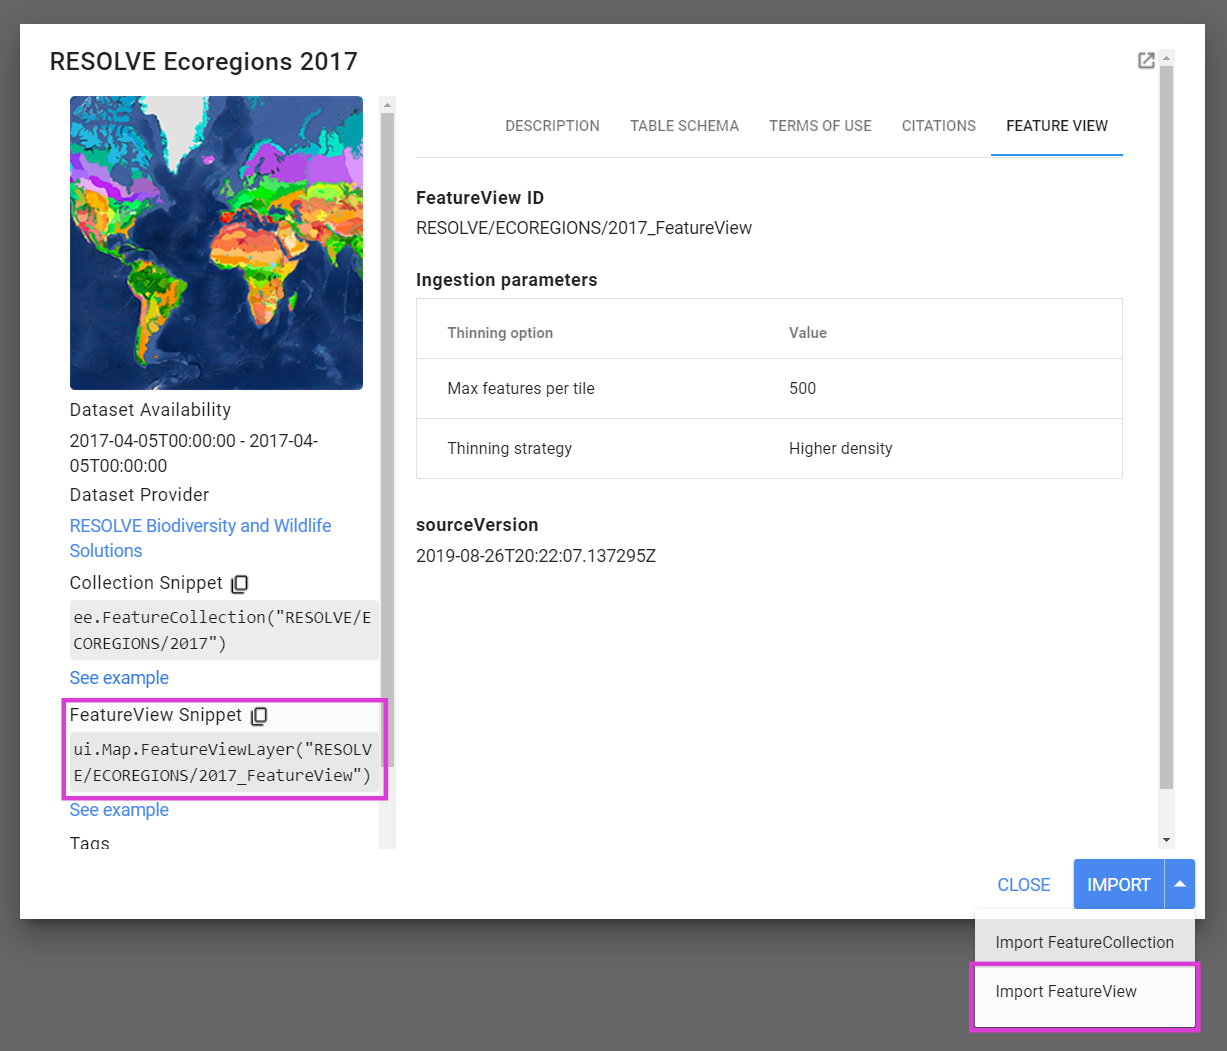
Figure 1. Data Catalog asset dialog highlighting FeatureView import methods.
FeatureView metadata
FeatureView information and metadata are available in the asset dialogs
mentioned in the FeatureView asset locations
section above. In addition to the description and properties that may be shared
with the source FeatureCollection, there are five properties unique to
FeatureView. They include the ingestion parameter settings described in
the Creating a FeatureView section and
sourceVersion, which is the "last modified" timestamp of the table asset that
the FeatureView was created from. Figure 1 above shows
FeatureView-specific properties in a Data Catalog asset dialog. Like other
assets, you can also fetch properties programmatically from the dictionary
returned by ee.data.getAsset.
Visualizing a FeatureView
A FeatureView object can be visualized in the Code Editor, Earth Engine Apps,
and Google Maps.
Code Editor
The Code Editor includes the ui.Map.FeatureViewLayer component to visualize
FeatureView assets on a map. The following example defines a FeatureView
asset ID, imports the asset as a FeatureViewLayer, and displays it on the
map.
Code Editor (JavaScript)
// Define the FeatureView asset ID.
var assetId = 'WCMC/WDPA/current/polygons_FeatureView';

// Import the FeatureView asset as a FeatureViewLayer.
var layer = ui.Map.FeatureViewLayer(assetId);

// Add the FeatureViewLayer to the map.
Map.add(layer);
Styling
You can style the FeatureViewLayer by passing a style dictionary to the
ui.Map.FeatureViewLayer function or adding them to a layer using the
setVisParams method. Below is an example that styles:
- outline colors based on the "MARINE" property (whether the protected area falls totally or partially within the marine environment),
- fill color based on the "IUCN_CAT" property (International Union for Conservation of Nature (IUCN) Category), and
- fill opacity based on the size of the protected area defined by the "REP_AREA" property.
Visit the FeatureView Styling page for more details on the styling options that are available.
Code Editor (JavaScript)
// Set visualization properties for the defined layer.
layer.setVisParams({
  color: {
    property: 'MARINE',
    categories: [
      ['0', 'purple'],
      ['1', 'green'],
      ['2', 'blue'],
    ]
  },
  fillColor: {
    property: 'IUCN_CAT',
    defaultValue: 'd3d3d3',
    categories: [
      ['Ia', 'a6cee3'],
      ['Ib', '1f78b4'],
      ['II', 'b2df8a'],
      ['III', '33a02c'],
      ['IV', 'fb9a99'],
      ['V', 'e31a1c'],
      ['VI', 'fdbf6f'],
    ]
  },
  fillOpacity: {
    property: 'REP_AREA',
    mode: 'interval',
    palette: [
      [0, 0.5],
      [80, 0.35],
      [2000, 0.22],
      [5000, 0.15],
    ],
  },
  width: 1.0,
  pointSize: 6.0,
});
Filtering
Filter rules can be applied to selectively style or hide features based on their
properties. For example, to filter out protected areas smaller than a certain
area given by a slider widget, you can use the following code. See the
Specific Rules
section of the FeatureView Styling page to learn more about the rules field.
Code Editor (JavaScript)
// Define the FeatureView asset ID.
var assetId = 'WCMC/WDPA/current/polygons_FeatureView';

// Import the FeatureView asset as a FeatureViewLayer.
var layer = ui.Map.FeatureViewLayer(assetId, null, 'WDPA FeatureViewLayer');

// Callback function to update FeatureViewLayer style.
var updateVisParams = function() {
  layer.setVisParams({
    color: {
      property: 'MARINE',
      categories: [
        ['0', 'purple'],
        ['1', 'green'],
        ['2', 'blue'],
      ]
    },
    fillColor: {
      property: 'IUCN_CAT',
      defaultValue: 'd3d3d3',
      categories: [
        ['Ia', 'a6cee3'],
        ['Ib', '1f78b4'],
        ['II', 'b2df8a'],
        ['III', '33a02c'],
        ['IV', 'fb9a99'],
        ['V', 'e31a1c'],
        ['VI', 'fdbf6f'],
      ]
    },
    fillOpacity: {
      property: 'REP_AREA',
      mode: 'interval',
      palette: [
        [0, 0.5],
        [80, 0.35],
        [2000, 0.22],
        [5000, 0.15],
      ],
    },
    width: 1.0,
    pointSize: 6.0,
    rules: [
      {
        filter: ee.Filter.lt('REP_AREA', filterSlider.getValue()),
        isVisible: false,
      },
    ],
  });
};

// Slider widget that calls the updateVisParams function on change.
var filterSlider = ui.Slider({
  min: 0,
  max: 10000,
  step: 10,
  value: 0,
  style: { stretch: 'horizontal'},
  onChange: updateVisParams,
});
var filterSliderLabel = ui.Label(
  'Adjust slider to hide features less than the specified area (km²)');

// Add the slider to the map.
Map.add(ui.Panel([filterSliderLabel, filterSlider]));

// Initialize the FeatureViewLayer style.
updateVisParams();

// Add the FeatureViewLayer to the map.
Map.add(layer);

Figure 2. FeatureViewLayer visualization with a slider widget to hide features
smaller than the specified area.
Google Maps API
The process for visualizing a FeatureView asset using the Google Maps API
is a four part process: obtain a tiles key using
ee.data.getFeatureViewTilesKey, pass it to an instance of
FeatureViewTileSource, construct an ee.layer.ImageOverlay, and then add
the overlay to your google.maps.Map instance. Sample code for constructing
the ImageOverlay in JavaScript is shown below.
var tilesKey = ee.data.getFeatureViewTilesKey({
  assetId: 'WCMC/WDPA/current/polygons_FeatureView',
  visParams: { … },
});

var tileSource = new ee.layers.FeatureViewTileSource(tilesKey);
var overlay = new ee.layers.ImageOverlay(tileSource);
Once that’s done, you can add the overlay to your google.maps.Map instance
as shown below.
// embeddedMap is your google.maps.Map instance.
embeddedMap.overlayMapTypes.setAt(0, overlay);
Inspecting a FeatureView
A FeatureViewLayer layer added to the default Code Editor map can be
inspected using the
Inspector tool.
The functionality is the same as that of a FeatureCollection. Note that
results returned for the clicked location only lists features that are visible
at the current zoom level. Geometries are not shown for the inspected features
since they are simplified as part of the FeatureView export process.
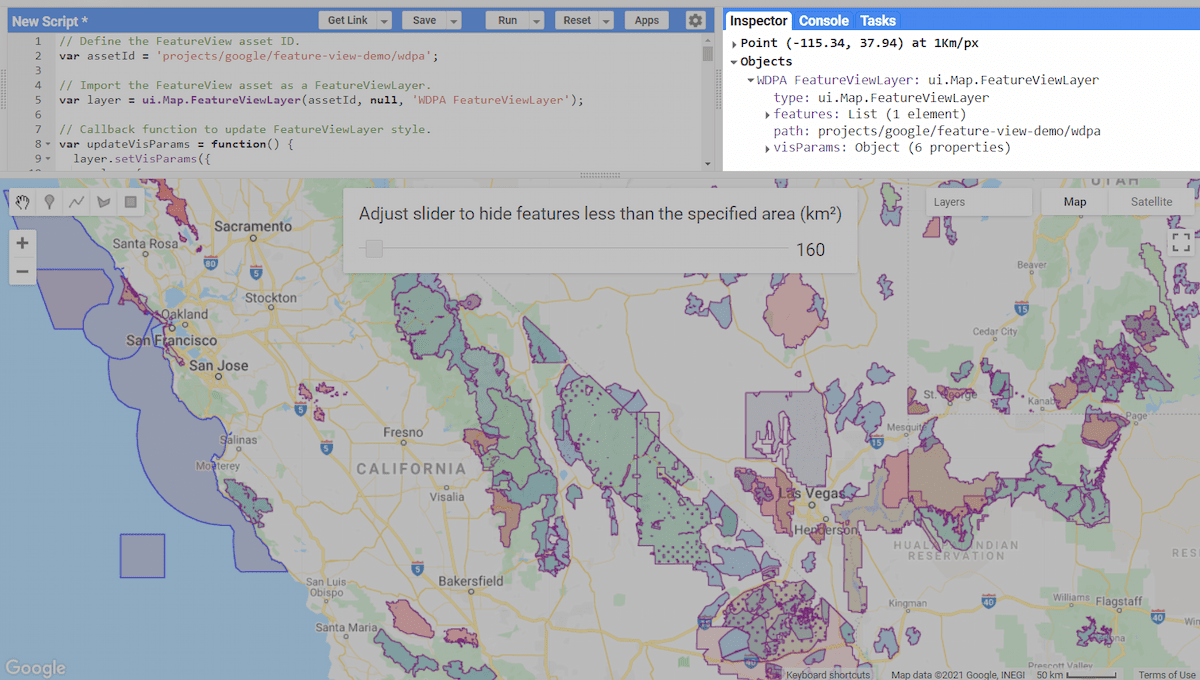
Figure 3. Inspecting a FeatureViewLayer. The inspector shows the layer,
features, asset ID, and the visualization parameters.