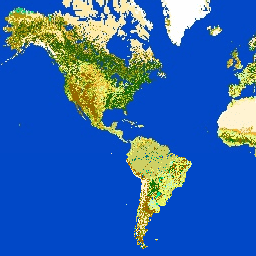
Earth Engine's public data catalog includes a variety of standard Earth science raster datasets. You can import these datasets into your script environment with a single click. You can also upload your own raster data or vector data for private use or sharing in your scripts.
Looking for another dataset not in Earth Engine yet? Let us know by suggesting a dataset.
-
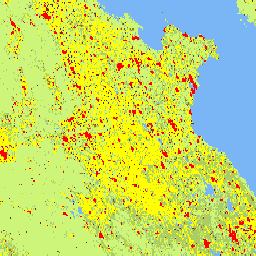
Canada AAFC Annual Crop Inventory
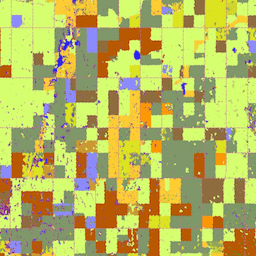
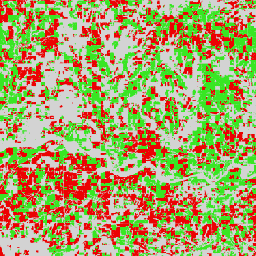
Starting in 2009, the Earth Observation Team of the Science and Technology Branch (STB) at Agriculture and Agri-Food Canada (AAFC) began the process of generating annual crop type digital maps. Focusing on the Prairie Provinces in 2009 and 2010, a Decision Tree (DT) based methodology … canada crop landcover -
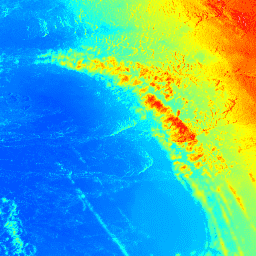
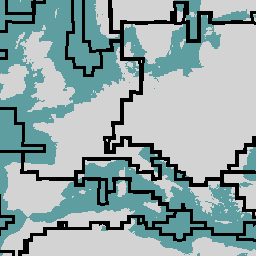
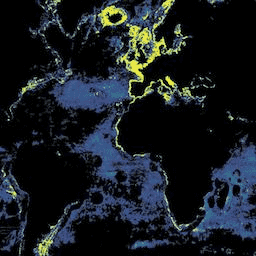
Allen Coral Atlas (ACA) - Geomorphic Zonation and Benthic Habitat - v2.0
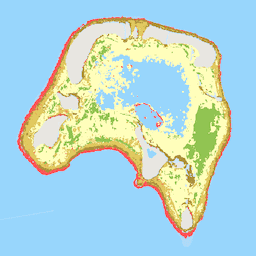
The Allen Coral Atlas dataset maps the geomorphic zonation and benthic habitat for the world's shallow coral reefs at 5 m pixel resolution. Also included is a global reef extent product that maps additional reef areas unable to be explicitly included in the geomorphic and … ocean sentinel2-derived -
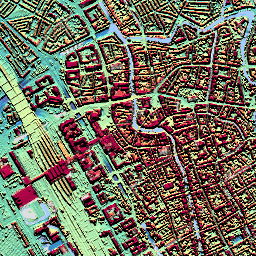
AHN Netherlands 0.5m DEM, Interpolated
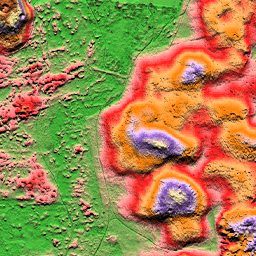
The AHN DEM is a 0.5m DEM covering the Netherlands. It was generated from LIDAR data taken in the spring between 2007 and 2012. It contains ground level samples with all other items above ground (such as buildings, bridges, trees etc.) removed. This version is … ahn dem elevation geophysical lidar netherlands -
AHN Netherlands 0.5m DEM, Non-Interpolated
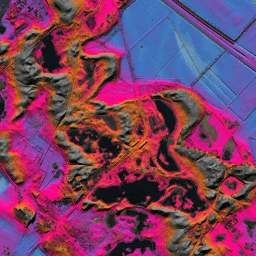
The AHN DEM is a 0.5m DEM covering the Netherlands. It was generated from LIDAR data taken in the spring between 2007 and 2012. It contains ground level samples with all other items above ground (such as buildings, bridges, trees etc.) removed. This version is … ahn dem elevation geophysical lidar netherlands -
AHN Netherlands 0.5m DEM, Raw Samples
The AHN DEM is a 0.5m DEM covering the Netherlands. It was generated from LIDAR data taken in the spring between 2007 and 2012. This version contains both ground level samples and items above ground level (such as buildings, bridges, trees etc). The point cloud … ahn dem elevation geophysical lidar netherlands -
ASTER L1T Radiance
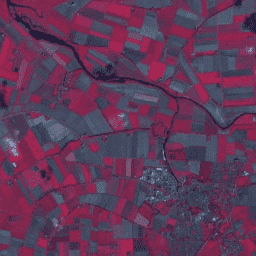
The Advanced Spaceborne Thermal Emission and Reflection Radiometer (ASTER) is a multispectral imager that was launched on board NASA's Terra spacecraft in December, 1999. ASTER can collect data in 14 spectral bands from the visible to the thermal infrared. Each scene covers an area of … aster imagery nasa nir radiance swir -
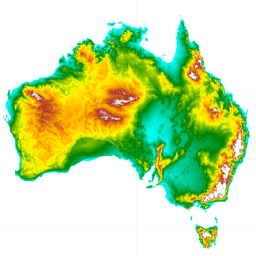
Australian 5M DEM
The Digital Elevation Model (DEM) 5 meter Grid of Australia derived from LiDAR model represents a National 5 meter (bare earth) DEM which has been derived from some 236 individual LiDAR surveys between 2001 and 2015 covering an area in excess of 245,000 square kilometers. … australia dem elevation ga geophysical geoscience-australia -
DEM-H: Australian SRTM Hydrologically Enforced Digital Elevation Model

The Hydrologically Enforced Digital Elevation Model (DEM-H) was derived from the SRTM data acquired by NASA in February 2000. The model has been hydrologically conditioned and drainage enforced. The DEM-H captures flow paths based on SRTM elevations and mapped stream lines, and supports delineation of … australia dem elevation ga geophysical geoscience-australia -
DEM-S: Australian Smoothed Digital Elevation Model
The Smoothed Digital Elevation Model (DEM-S) was derived from the SRTM data acquired by NASA in February 2000. DEM-S represents ground surface topography (excluding vegetation features) and has been smoothed to reduce noise and improve the representation of surface shape. An adaptive process applied more … australia dem elevation ga geophysical geoscience-australia -
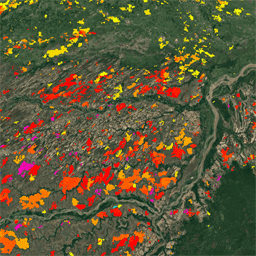
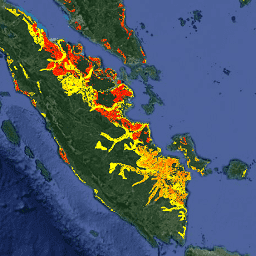
Global Map of Oil Palm Plantations
The dataset is a 10m global industrial and smallholder oil palm map for 2019. It covers areas where oil palm plantations were detected. The classified images are the output of a convolutional neural network based on Sentinel-1 and Sentinel-2 half-year composites. See article for additional … biodiversity conservation crop global landuse -
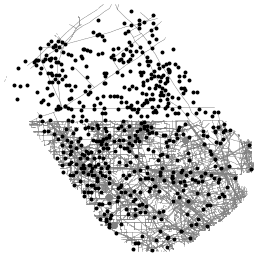
BLM AIM TerrADat TerrestrialAIM Point v1
Since 2011, the Bureau of Land Management (BLM) has collected field information to inform land health through its Assessment Inventory and Monitoring (AIM) strategy. To date, more than 6,000 terrestrial AIM field plots have been collected over BLM lands. The BLM AIM data archive is … blm hydrology vegetation -
CCNL: Consistent And Corrected Nighttime Light Dataset from DMSP-OLS (1992-2013) v1
The Consistent and Corrected Nighttime Lights (CCNL) dataset is a reprocessed version of the Defense Meteorological Program (DMSP) Operational Line-Scan System (OLS) Version 4. A series of methods was used to mitigate the impact of inter-annual inconsistency, saturation, and blooming effects and to improve data … dmsp eog imagery lights nighttime ols -
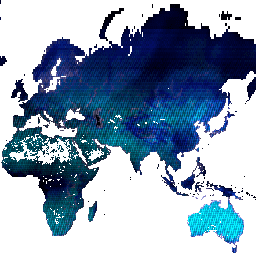
PML_V2 0.1.7: Coupled Evapotranspiration and Gross Primary Product (GPP)
Penman-Monteith-Leuning Evapotranspiration V2 (PML_V2) products include evapotranspiration (ET), its three components, and gross primary product (GPP) at 500m and 8-day resolution during 2000-2017 and with spatial range from -60°S to 90°N. The major advantages of the PML_V2 products are: coupled estimates of transpiration and GPP … evapotranspiration gpp -
SRTM Digital Elevation Data Version 4

The Shuttle Radar Topography Mission (SRTM) digital elevation dataset was originally produced to provide consistent, high-quality elevation data at near global scope. This version of the SRTM digital elevation data has been processed to fill data voids, and to facilitate its ease of use. dem elevation geophysical srtm topography -
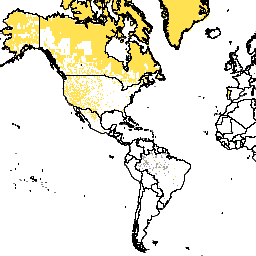
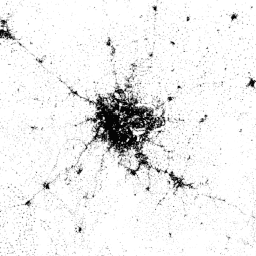
GPWv411: Basic Demographic Characteristics (Gridded Population of the World Version 4.11)

The Gridded Population of World Version 4 (GPWv4), Revision 11 models the distribution of global human population for the years 2000, 2005, 2010, 2015, and 2020 on 30 arc-second (approximately 1km) grid cells. Population is distributed to cells using proportional allocation of population from census … ciesin gpw nasa population -
GPWv411: Data Context (Gridded Population of the World Version 4.11)

The Gridded Population of World Version 4 (GPWv4), Revision 11 models the distribution of global human population for the years 2000, 2005, 2010, 2015, and 2020 on 30 arc-second (approximately 1km) grid cells. Population is distributed to cells using proportional allocation of population from census … ciesin gpw nasa population -
GPWv411: Land Area (Gridded Population of the World Version 4.11)

The Gridded Population of World Version 4 (GPWv4), Revision 11 models the distribution of global human population for the years 2000, 2005, 2010, 2015, and 2020 on 30 arc-second (approximately 1km) grid cells. Population is distributed to cells using proportional allocation of population from census … ciesin gpw nasa population -
GPWv411: Mean Administrative Unit Area (Gridded Population of the World Version 4.11)
The Gridded Population of World Version 4 (GPWv4), Revision 11 models the distribution of global human population for the years 2000, 2005, 2010, 2015, and 2020 on 30 arc-second (approximately 1km) grid cells. Population is distributed to cells using proportional allocation of population from census … ciesin gpw nasa population -
GPWv411: National Identifier Grid (Gridded Population of the World Version 4.11)

The Gridded Population of World Version 4 (GPWv4), Revision 11 models the distribution of global human population for the years 2000, 2005, 2010, 2015, and 2020 on 30 arc-second (approximately 1km) grid cells. Population is distributed to cells using proportional allocation of population from census … ciesin gpw nasa population -
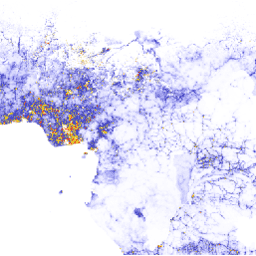
GPWv411: Population Count (Gridded Population of the World Version 4.11)
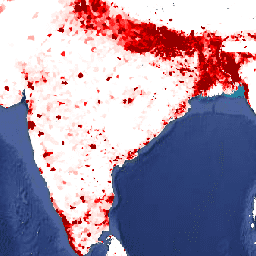
The Gridded Population of World Version 4 (GPWv4), Revision 11 models the distribution of global human population for the years 2000, 2005, 2010, 2015, and 2020 on 30 arc-second (approximately 1km) grid cells. Population is distributed to cells using proportional allocation of population from census … ciesin gpw nasa population -
GPWv411: Population Density (Gridded Population of the World Version 4.11)

The Gridded Population of World Version 4 (GPWv4), Revision 11 models the distribution of global human population for the years 2000, 2005, 2010, 2015, and 2020 on 30 arc-second (approximately 1km) grid cells. Population is distributed to cells using proportional allocation of population from census … ciesin gpw nasa population -
GPWv411: Adjusted to Match 2015 Revision of UN WPP Country Totals (Gridded Population of the World Version 4.11)

The Gridded Population of World Version 4 (GPWv4), Revision 11 models the distribution of global human population for the years 2000, 2005, 2010, 2015, and 2020 on 30 arc-second (approximately 1km) grid cells. Population is distributed to cells using proportional allocation of population from census … ciesin gpw nasa population -
GPWv411: UN-Adjusted Population Density (Gridded Population of the World Version 4.11)

The Gridded Population of World Version 4 (GPWv4), Revision 11 models the distribution of global human population for the years 2000, 2005, 2010, 2015, and 2020 on 30 arc-second (approximately 1km) grid cells. Population is distributed to cells using proportional allocation of population from census … ciesin gpw nasa population -
GPWv411: Water Area (Gridded Population of the World Version 4.11)

The Gridded Population of World Version 4 (GPWv4), Revision 11 models the distribution of global human population for the years 2000, 2005, 2010, 2015, and 2020 on 30 arc-second (approximately 1km) grid cells. Population is distributed to cells using proportional allocation of population from census … ciesin gpw nasa population -
GPWv411: Water Mask (Gridded Population of the World Version 4.11)

The Gridded Population of World Version 4 (GPWv4), Revision 11 models the distribution of global human population for the years 2000, 2005, 2010, 2015, and 2020 on 30 arc-second (approximately 1km) grid cells. Population is distributed to cells using proportional allocation of population from census … ciesin gpw nasa population -
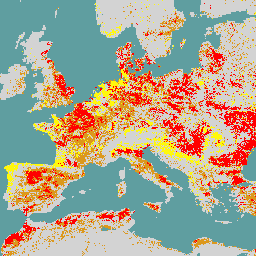
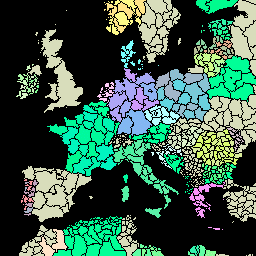
Copernicus CORINE Land Cover
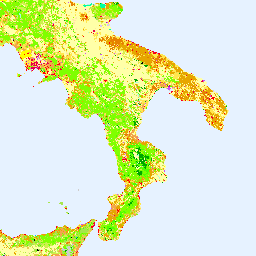
The CORINE (coordination of information on the environment) Land Cover (CLC) inventory was initiated in 1985 to standardize data collection on land in Europe to support environmental policy development. The project is coordinated by the European Environment Agency (EEA) in the frame of the EU … copernicus eea esa eu landcover -
Copernicus DEM GLO-30: Global 30m Digital Elevation Model
The Copernicus DEM is a Digital Surface Model (DSM) which represents the surface of the Earth including buildings, infrastructure and vegetation. This DEM is derived from an edited DSM named WorldDEM&trade, i.e. flattening of water bodies and consistent flow of rivers has been included. Editing … copernicus dem elevation geophysical -
Copernicus Global Land Cover Layers: CGLS-LC100 Collection 3
The Copernicus Global Land Service (CGLS) is earmarked as a component of the Land service to operate a multi-purpose service component that provides a series of bio-geophysical products on the status and evolution of land surface at global scale. The Dynamic Land Cover map at … copernicus eea esa eu landcover proba -
Sentinel-1 SAR GRD: C-band Synthetic Aperture Radar Ground Range Detected, log scaling
The Sentinel-1 mission provides data from a dual-polarization C-band Synthetic Aperture Radar (SAR) instrument at 5.405GHz (C band). This collection includes the S1 Ground Range Detected (GRD) scenes, processed using the Sentinel-1 Toolbox to generate a calibrated, ortho-corrected product. The collection is updated daily. New … copernicus esa eu radar sar sentinel -
Sentinel-2: Cloud Probability
The S2 cloud probability is created with the sentinel2-cloud-detector library (using LightGBM). All bands are upsampled using bilinear interpolation to 10m resolution before the gradient boost base algorithm is applied. The resulting 0..1 floating point probability is scaled to 0..100 and stored as a UINT8. … cloud copernicus esa eu msi radiance -
Harmonized Sentinel-2 MSI: MultiSpectral Instrument, Level-1C
After 2022-01-25, Sentinel-2 scenes with PROCESSING_BASELINE '04.00' or above have their DN (value) range shifted by 1000. The HARMONIZED collection shifts data in newer scenes to be in the same range as in older scenes. Sentinel-2 is a wide-swath, high-resolution, multi-spectral imaging mission supporting Copernicus … copernicus esa eu msi radiance sentinel -
Harmonized Sentinel-2 MSI: MultiSpectral Instrument, Level-2A
After 2022-01-25, Sentinel-2 scenes with PROCESSING_BASELINE '04.00' or above have their DN (value) range shifted by 1000. The HARMONIZED collection shifts data in newer scenes to be in the same range as in older scenes. Sentinel-2 is a wide-swath, high-resolution, multi-spectral imaging mission supporting Copernicus … copernicus esa eu msi reflectance sentinel -
Sentinel-3 OLCI EFR: Ocean and Land Color Instrument Earth Observation Full Resolution
The Ocean and Land Color Instrument (OLCI) Earth Observation Full Resolution (EFR) dataset contains top of atmosphere radiances at 21 spectral bands with center wavelengths ranging between 0.4µm and 1.02µm at spatial resolution of 300m with worldwide coverage every ~2 days. OLCI is one of … copernicus esa eu radiance sentinel toa -
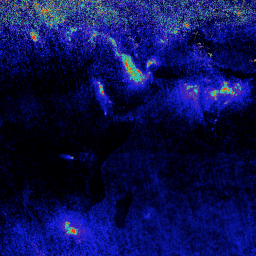
Sentinel-5P NRTI AER AI: Near Real-Time UV Aerosol Index
NRTI/L3_AER_AI This dataset provides near real-time high-resolution imagery of the UV Aerosol Index (UVAI), also called the Absorbing Aerosol Index (AAI). The AAI is based on wavelength-dependent changes in Rayleigh scattering in the UV spectral range for a pair of wavelengths. The difference between observed … aai aerosol air-quality copernicus esa eu -
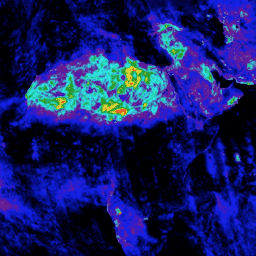
Sentinel-5P NRTI AER LH: Near Real-Time UV Aerosol Layer Height
NRTI/L3_AER_LH This dataset provides offline high-resolution imagery of the UV Aerosol Index (UVAI), also called the Absorbing Layer Height (ALH). The ALH is very sensitive to cloud contamination. However, aerosols and clouds can be difficult to distinguish, and ALH is computed for all FRESCO effective … aerosol air-quality alh copernicus esa eu -
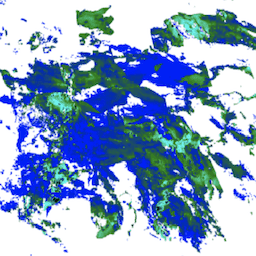
Sentinel-5P NRTI CLOUD: Near Real-Time Cloud

NRTI/L3_CLOUD This dataset provides near real-time high-resolution imagery of cloud parameters. The TROPOMI/S5P cloud properties retrieval is based on the OCRA and ROCINN algorithms currently being used in the operational GOME and GOME-2 products. OCRA retrieves the cloud fraction using measurements in the UV/VIS spectral … climate cloud copernicus dlr esa eu -
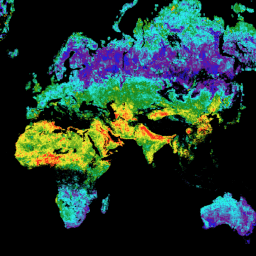
Sentinel-5P NRTI CO: Near Real-Time Carbon Monoxide
NRTI/L3_CO This dataset provides near real-time high-resolution imagery of CO concentrations. Carbon monoxide (CO) is an important atmospheric trace gas for understanding tropospheric chemistry. In certain urban areas, it is a major atmospheric pollutant. Main sources of CO are combustion of fossil fuels, biomass burning, … air-quality carbon-monoxide copernicus esa eu knmi -
Sentinel-5P NRTI HCHO: Near Real-Time Formaldehyde
NRTI/L3_HCHO This dataset provides near real-time high-resolution imagery of atmospheric formaldehyde (HCHO) concentrations. Formaldehyde is an intermediate gas in almost all oxidation chains of non-methane volatile organic compounds (NMVOC), leading eventually to CO2. Non-Methane Volatile Organic Compounds (NMVOCs) are, together with NOx, CO and CH4, … air-quality bira copernicus dlr esa eu -
Sentinel-5P NRTI NO2: Near Real-Time Nitrogen Dioxide
NRTI/L3_NO2 This dataset provides near real-time high-resolution imagery of NO2 concentrations. Nitrogen oxides (NO2 and NO) are important trace gases in the Earth's atmosphere, present in both the troposphere and the stratosphere. They enter the atmosphere as a result of anthropogenic activities (notably fossil fuel … air-quality copernicus esa eu knmi nitrogen-dioxide -
Sentinel-5P NRTI O3: Near Real-Time Ozone
NRTI/L3_O3 This dataset provides near-real-time high-resolution imagery of total column ozone concentrations. See also COPERNICUS/S5P/OFFL/L3_O3_TCL for the tropospheric column data. In the stratosphere, the ozone layer shields the biosphere from dangerous solar ultraviolet radiation. In the troposphere, it acts as an efficient cleansing agent, but … air-quality copernicus esa eu o3 ozone -
Sentinel-5P NRTI SO2: Near Real-Time Sulfur Dioxide
NRTI/L3_SO2 This dataset provides near real-time high-resolution imagery of atmospheric sulfur dioxide (SO2) concentrations. Sulfur dioxide (SO2) enters the Earth's atmosphere through both natural and anthropogenic processes. It plays a role in chemistry on a local and global scale and its impact ranges from short-term … air-quality bira copernicus dlr esa eu -
Sentinel-5P OFFL AER AI: Offline UV Aerosol Index
OFFL/L3_AER_AI This dataset provides offline high-resolution imagery of the UV Aerosol Index (UVAI), also called the Absorbing Aerosol Index (AAI). The AAI is based on wavelength-dependent changes in Rayleigh scattering in the UV spectral range for a pair of wavelengths. The difference between observed and … aai aerosol air-quality copernicus esa eu -
Sentinel-5P OFFL AER LH: Offline UV Aerosol Layer Height
OFFL/L3_AER_LH This dataset provides offline high-resolution imagery of the UV Aerosol Index (UVAI), also called the Absorbing Layer Height (ALH). The ALH is very sensitive to cloud contamination. However, aerosols and clouds can be difficult to distinguish, and ALH is computed for all FRESCO effective … aerosol air-quality alh copernicus esa eu -
Sentinel-5P OFFL CH4: Offline Methane
OFFL/L3_CH4 This dataset provides offline high-resolution imagery of methane concentrations. Methane (CH4) is, after carbon dioxide (CO2), the most important contributor to the anthropogenically enhanced greenhouse effect. Roughly three-quarters of methane emissions are anthropogenic and as such it is important to continue the record of … climate copernicus esa eu knmi methane -
Sentinel-5P OFFL CLOUD: Near Real-Time Cloud
OFFL/L3_CLOUD This dataset provides offline high-resolution imagery of cloud parameters. The TROPOMI/S5P cloud properties retrieval is based on the OCRA and ROCINN algorithms currently being used in the operational GOME and GOME-2 products. OCRA retrieves the cloud fraction using measurements in the UV/VIS spectral regions … climate cloud copernicus dlr esa eu -
Sentinel-5P OFFL CO: Offline Carbon Monoxide
OFFL/L3_CO This dataset provides offline high-resolution imagery of CO concentrations. Carbon monoxide (CO) is an important atmospheric trace gas for understanding tropospheric chemistry. In certain urban areas, it is a major atmospheric pollutant. Main sources of CO are combustion of fossil fuels, biomass burning, and … air-quality carbon-monoxide copernicus esa eu knmi -
Sentinel-5P OFFL HCHO: Offline Formaldehyde

OFFL/L3_HCHO This dataset provides offline high-resolution imagery of atmospheric formaldehyde (HCHO) concentrations. Formaldehyde is an intermediate gas in almost all oxidation chains of non-methane volatile organic compounds (NMVOC), leading eventually to CO2. Non-Methane Volatile Organic Compounds (NMVOCs) are, together with NOx, CO and CH4, among … air-quality bira copernicus dlr esa eu -
Sentinel-5P OFFL NO2: Offline Nitrogen Dioxide
OFFL/L3_NO2 This dataset provides offline high-resolution imagery of NO2 concentrations. Nitrogen oxides (NO2 and NO) are important trace gases in the Earth's atmosphere, present in both the troposphere and the stratosphere. They enter the atmosphere as a result of anthropogenic activities (notably fossil fuel combustion … air-quality copernicus esa eu knmi nitrogen-dioxide -
Sentinel-5P OFFL O3: Offline Ozone
OFFL/L3_O3 This dataset provides offline high-resolution imagery of total column ozone concentrations. See also COPERNICUS/S5P/OFFL/L3_O3_TCL for the tropospheric column data. In the stratosphere, the ozone layer shields the biosphere from dangerous solar ultraviolet radiation. In the troposphere, it acts as an efficient cleansing agent, but … air-quality copernicus esa eu o3 ozone -
Sentinel-5P OFFL O3 TCL: Offline Tropospheric Ozone

OFFL/L3_O3_TCL This dataset provides offline tropospheric high-resolution imagery of ozone concentrations between 20N and 20S. See also COPERNICUS/S5P/OFFL/L3_O3 and COPERNICUS/S5P/NRTI/L3_O3 for the total column data. In the stratosphere, the ozone layer shields the biosphere from dangerous solar ultraviolet radiation. In the troposphere, it acts as … air-quality copernicus esa eu o3 ozone -
Sentinel-5P OFFL SO2: Offline Sulfur Dioxide
OFFL/L3_SO2 This dataset provides offline high-resolution imagery of atmospheric sulfur dioxide (SO2) concentrations. Sulfur dioxide (SO2) enters the Earth's atmosphere through both natural and anthropogenic processes. It plays a role in chemistry on a local and global scale and its impact ranges from short-term pollution … air-quality bira copernicus dlr esa eu -
CryoSat-2 Antarctica 1km DEM
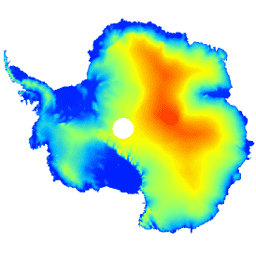
This dataset is a digital elevation model (DEM) of the Antarctic ice sheet and ice shelves based on observations recorded by the CryoSat-2 satellite radar altimeter between July 2010 and July 2016. The DEM is formed from spatio-temporal fits to elevation measurements accumulated within 1, … antarctica dem elevation polar -
SPEIbase: Standardised Precipitation-Evapotranspiration Index database, Version 2.9
The Global SPEI database (SPEIbase) offers long-time robust information about drought conditions at the global scale, with a 0.5 degree pixel size and monthly cadence. It provides SPEI time scales from 1 to 48 months. The Standardized Precipitatin-Evapotranspiration Index (SPEI) expresses, as a standardized variate … climate climate-change drought evapotranspiration global monthly -
SLGA: Soil and Landscape Grid of Australia (Soil Attributes)
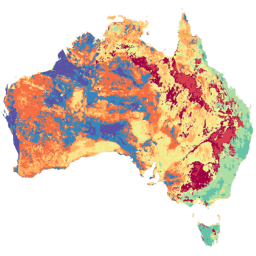
The Soil and Landscape Grid of Australia (SLGA) is a comprehensive dataset of soil attributes across Australia at 3 arc-second resolution (~90m pixels). The surfaces are the outcomes from modelling that describe the spatial distribution of the soil attributes using existing soil data and environmental … australia csiro soil tern -
Global ALOS CHILI (Continuous Heat-Insolation Load Index)
CHILI is a surrogate for effects of insolation and topographic shading on evapotranspiration represented by calculating insolation at early afternoon, sun altitude equivalent to equinox. It is based on the 30m "AVE" band of JAXA's ALOS DEM (available in EE as JAXA/ALOS/AW3D30_V1_1). The Conservation Science … aspect csp elevation ergo geophysical global -
Global ALOS Landforms

The ALOS Landform dataset provides landform classes created by combining the Continuous Heat-Insolation Load Index (ALOS CHILI) and the multi-scale Topographic Position Index (ALOS mTPI) datasets. It is based on the 30m "AVE" band of JAXA's ALOS DEM (available in EE as JAXA/ALOS/AW3D30_V1_1). The Conservation … aspect csp elevation ergo geophysical global -
Global ALOS mTPI (Multi-Scale Topographic Position Index)
The mTPI distinguishes ridge from valley forms. It is calculated using elevation data for each location subtracted by the mean elevation within a neighborhood. mTPI uses moving windows of radius (km): 115.8, 89.9, 35.5, 13.1, 5.6, 2.8, and 1.2. It is based on the 30m … aspect csp elevation ergo geophysical global -
Global ALOS Topographic Diversity

Topographic diversity (D) is a surrogate variable that represents the variety of temperature and moisture conditions available to species as local habitats. It expresses the logic that a higher variety of topo-climate niches should support higher diversity (especially plant) and support species persistence given climatic … aspect csp elevation ergo geophysical global -
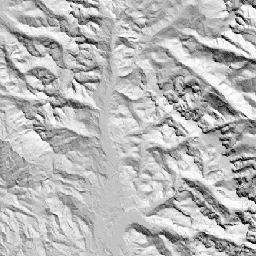
Global SRTM CHILI (Continuous Heat-Insolation Load Index)

CHILI is a surrogate for effects of insolation and topographic shading on evapotranspiration represented by calculating insolation at early afternoon, sun altitude equivalent to equinox. It is based on the 30m SRTM DEM (available in EE as USGS/SRTMGL1_003). The Conservation Science Partners (CSP) Ecologically Relevant … aspect csp elevation ergo geophysical global -
Global SRTM Landforms
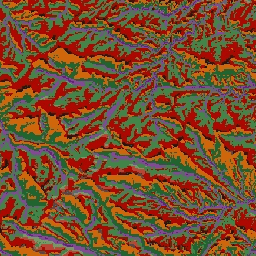
The SRTM Landform dataset provides landform classes created by combining the Continuous Heat-Insolation Load Index (SRTM CHILI) and the multi-scale Topographic Position Index (SRTM mTPI) datasets. It is based on the 30m SRTM DEM (available in EE as USGS/SRTMGL1_003). The Conservation Science Partners (CSP) Ecologically … aspect csp elevation ergo geophysical global -
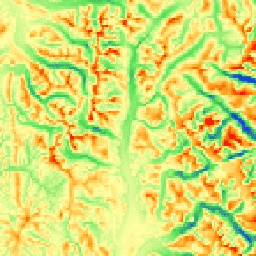
Global SRTM mTPI (Multi-Scale Topographic Position Index)

The mTPI distinguishes ridge from valley forms. It is calculated using elevation data for each location subtracted by the mean elevation within a neighborhood. mTPI uses moving windows of radius (km): 115.8, 89.9, 35.5, 13.1, 5.6, 2.8, and 1.2. It is based on the 30m … aspect csp elevation ergo geophysical global -
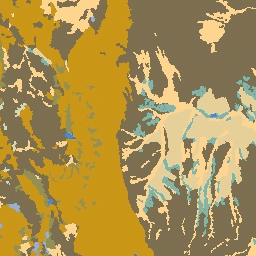
Global SRTM Topographic Diversity

Topographic diversity (D) is a surrogate variable that represents the variety of temperature and moisture conditions available to species as local habitats. It expresses the logic that a higher variety of topo-climate niches should support higher diversity (especially plant) and support species persistence given climatic … aspect csp elevation ergo geophysical global -
US NED CHILI (Continuous Heat-Insolation Load Index)

CHILI is a surrogate for effects of insolation and topographic shading on evapotranspiration represented by calculating insolation at early afternoon, sun altitude equivalent to equinox. It is based on the USGS's 10m NED DEM (available in EE as USGS/NED). The Conservation Science Partners (CSP) Ecologically … aspect csp elevation ergo geophysical landforms -
US NED Landforms

The ALOS Landform dataset provides landform classes created by combining the Continuous Heat-Insolation Load Index (CHILI) and the multi-scale Topographic Position Index (mTPI) datasets. It is based on the USGS's 10m NED DEM (available in EE as USGS/NED). The Conservation Science Partners (CSP) Ecologically Relevant … aspect csp elevation ergo geophysical landforms -
US Lithology
The Lithology dataset provides classes of the general types of parent material of soil on the surface. It is not derived from any DEM. The Conservation Science Partners (CSP) Ecologically Relevant Geomorphology (ERGo) Datasets, Landforms and Physiography contain detailed, multi-scale data on landforms and physiographic … aspect csp elevation ergo geophysical landforms -
US NED mTPI (Multi-Scale Topographic Position Index)

The mTPI distinguishes ridge from valley forms. It is calculated using elevation data for each location subtracted by the mean elevation within a neighborhood. mTPI uses moving windows of radius (km): 115.8, 89.9, 35.5, 13.1, 5.6, 2.8, and 1.2. It is based on the USGS's … aspect csp elevation ergo geophysical landforms -
US NED Physiographic Diversity
The Physiographic Diversity dataset provides an index of the diversity of physiographic types. It was calculated using the Shannon diversity index at multiple-scales (km): 115.8, 89.9, 35.5, 13.1, 5.6, 2.8, and 1.2. It is based on the USGS's 10m NED DEM (available in EE as … aspect csp elevation ergo geophysical landforms -
US Physiography
The Physiography dataset represents the spatial intersection of landforms (available in EE as ERGo/1_0/US/landforms) and lithology (available in EE as ERGo/1_0/US/lithology) data layers. It provides 247 unique combinations out of a possible 270. The values for each type are formed by concatenating the landform and … aspect csp elevation ergo geophysical landforms -
US NED Topographic Diversity
Topographic diversity (D) is a surrogate variable that represents the variety of temperature and moisture conditions available to species as local habitats. It expresses the logic that a higher variety of topo-climate niches should support higher diversity (especially plant) and support species persistence given climatic … aspect csp elevation ergo geophysical landforms -
CSP gHM: Global Human Modification
The global Human Modification dataset (gHM) provides a cumulative measure of human modification of terrestrial lands globally at 1 square-kilometer resolution. The gHM values range from 0.0-1.0 and are calculated by estimating the proportion of a given location (pixel) that is modified, the estimated intensity … csp fragmentation human-modification landcover landscape-gradient stressors -
World Settlement Footprint 2015
The World Settlement Footprint (WSF) 2015 is a 10m resolution binary mask outlining the extent of human settlements globally derived by means of 2014-2015 multitemporal Landsat-8 and Sentinel-1 imagery (of which ~217,000 and ~107,000 scenes have been processed, respectively). The temporal dynamics of human settlements … landcover landsat-derived sentinel1-derived settlement urban -
LandScan High Definition Data for Ukraine, January 2022
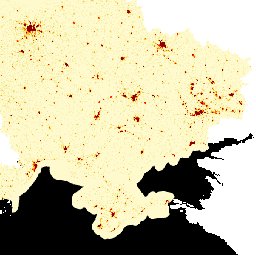
LandScan High Definition (HD) provides gridded population estimates at 3 arc-second (~100m) resolution. Values for each LandScan HD cell represent an ambient (i.e. 24 hour average) population count estimate. In this way, the data capture the full potential activity space of people throughout the course … landscan population -
Copernicus Atmosphere Monitoring Service (CAMS) Global Near-Real-Time
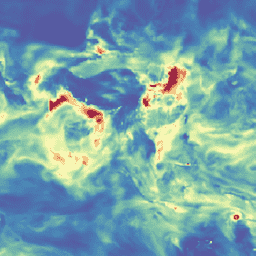
NOTE (2024-04-19): Due to modernization work impacting the Copernicus Climate Data Store, production of ECMWF datasets may be disrupted. The provider did not specify a planned completion date, so for more details, see the user forum. The Copernicus Atmosphere Monitoring Service provides the capacity to … aerosol atmosphere climate copernicus ecmwf forecast -
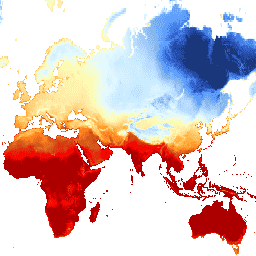
ERA5 Daily Aggregates - Latest Climate Reanalysis Produced by ECMWF / Copernicus Climate Change Service
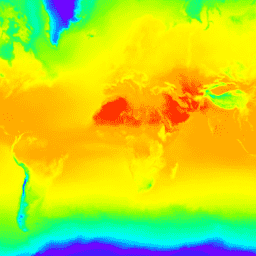
NOTE (2024-04-19): Due to modernization work impacting the Copernicus Climate Data Store, production of ECMWF datasets may be disrupted. The provider did not specify a planned completion date, so for more details, see the user forum. ERA5 is the fifth generation ECMWF atmospheric reanalysis of … climate copernicus dewpoint ecmwf era5 precipitation -
ERA5 Monthly Aggregates - Latest Climate Reanalysis Produced by ECMWF / Copernicus Climate Change Service

NOTE (2024-04-19): Due to modernization work impacting the Copernicus Climate Data Store, production of ECMWF datasets may be disrupted. The provider did not specify a planned completion date, so for more details, see the user forum. ERA5 is the fifth generation ECMWF atmospheric reanalysis of … climate copernicus dewpoint ecmwf era5 precipitation -
ERA5-Land Daily Aggregated - ECMWF Climate Reanalysis
NOTE (2024-04-19): Due to modernization work impacting the Copernicus Climate Data Store, production of ECMWF datasets may be disrupted. The provider did not specify a planned completion date, so for more details, see the user forum. ERA5-Land is a reanalysis dataset providing a consistent view … cds climate copernicus ecmwf era5-land evaporation -
ERA5-Land Hourly - ECMWF Climate Reanalysis

NOTE (2024-04-19): Due to modernization work impacting the Copernicus Climate Data Store, production of ECMWF datasets may be disrupted. The provider did not specify a planned completion date, so for more details, see the user forum. ERA5-Land is a reanalysis dataset providing a consistent view … cds climate copernicus ecmwf era5-land evaporation -
ERA5-Land Monthly Aggregated - ECMWF Climate Reanalysis
NOTE (2024-04-19): Due to modernization work impacting the Copernicus Climate Data Store, production of ECMWF datasets may be disrupted. The provider did not specify a planned completion date, so for more details, see the user forum. ERA5-Land is a reanalysis dataset providing a consistent view … cds climate copernicus ecmwf era5-land evaporation -
ERA5-Land Monthly Averaged by Hour of Day - ECMWF Climate Reanalysis
NOTE (2024-04-19): Due to modernization work impacting the Copernicus Climate Data Store, production of ECMWF datasets may be disrupted. The provider did not specify a planned completion date, so for more details, see the user forum. ERA5-Land is a reanalysis dataset providing a consistent view … cds climate copernicus ecmwf era5-land evaporation -
MethaneAIR L4 Area Sources 2021
The area emissions model is still in development and not representative of a final product. This dataset provides high-resolution, spatially disaggregated methane emission fluxes (kg/hr) of the Permian Delaware sub-basin in southern New Mexico and western Texas as well as for the Uinta basin in … climate edf emissions ghg methane methaneair -
MethaneAIR L4 Point Sources 2021

This dataset provides high-emitting methane point source detections (kg/hr) over the Permian Delaware sub-basin in southern New Mexico and western Texas as well as for the Uinta basin in Utah. Methane is a potent greenhouse gas that has more than 80 times the warming power … climate edf emissions ghg methane methaneair -
OGIM: Oil and Gas Infrastructure Mapping Database v2.4_RF06_RF08
This dataset provides the locations of oil and gas (O&G) related infrastructure within two key O&G producing regions in the United States: the Delaware sub-basin of the Permian Basin in western Texas and southern New Mexico, and the Uinta Basin in Utah. The Oil and … climate edf emissions ghg methane methaneair -
EO-1 Hyperion Hyperspectral Imager
Hyperion is a high resolution hyperspectral imager producing 220 unique spectral channels ranging from 0.357 to 2.576 micrometers with a 10-nm bandwidth. The instrument operates in a pushbroom fashion, with a spatial resolution of 30 meters for all bands and a standard scene width of … usgs -
US EPA Ecoregions (Level III)
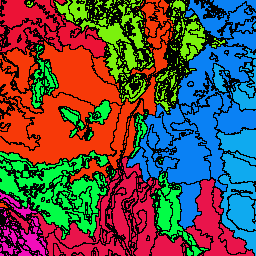
The U.S. Environmental Protection Agency (USEPA) provides the Ecoregions dataset to serve as a spatial framework for the research, assessment, management, and monitoring of ecosystems and ecosystem components. Ecoregions denote areas of general similarity in ecosystems and in the type, quality, and quantity of environmental … ecoregions epa -
US EPA Ecoregions (Level IV)

The U.S. Environmental Protection Agency (USEPA) provides the Ecoregions dataset to serve as a spatial framework for the research, assessment, management, and monitoring of ecosystems and ecosystem components. Ecoregions denote areas of general similarity in ecosystems and in the type, quality, and quantity of environmental … ecoregions epa -
FireCCI51: MODIS Fire_cci Burned Area Pixel Product, Version 5.1
The MODIS Fire_cci Burned Area pixel product version 5.1 (FireCCI51) is a monthly global ~250m spatial resolution dataset containing information on burned area as well as ancillary data. It is based on surface reflectance in the Near Infrared (NIR) band from the MODIS instrument onboard … burn climate-change copernicus esa fire fragmentation -
GlobCover: Global Land Cover Map
GlobCover 2009 is a global land cover map based on ENVISAT's Medium Resolution Imaging Spectrometer (MERIS) Level 1B data acquired in full resolution mode with a spatial resolution of approximately 300 meters. esa landcover -
ESA WorldCereal Active Cropland 10 m v100
The European Space Agency (ESA) WorldCereal Active Cropland 10 m 2021 product suite contains global-scale seasonal active cropland markers. They were generated as part of the ESA-WorldCereal project. The active cropland products indicate whether or not a pixel identified as temporary crops has been actively … agriculture copernicus crop esa global landcover -
ESA WorldCereal 10 m v100
The European Space Agency (ESA) WorldCereal 10 m 2021 product suite consists of global-scale annual and seasonal crop maps and their related confidence. They were generated as part of the ESA-WorldCereal project. More information on the content of these products and the methodology used to … agriculture copernicus crop esa global landcover -
ESA WorldCereal AEZ v100
The European Space Agency (ESA) WorldCereal classification system aims for product generation within one month after the end of a particular growing season. Due to the dynamic nature of these growing seasons across the globe, a global stratification into Agro-Ecological Zones (AEZ) was performed based … agriculture boundaries crop esa global -
ESA WorldCover 10m v100
The European Space Agency (ESA) WorldCover 10 m 2020 product provides a global land cover map for 2020 at 10 m resolution based on Sentinel-1 and Sentinel-2 data. The WorldCover product comes with 11 land cover classes and has been generated in the framework of … esa landcover landuse sentinel1-derived sentinel2-derived -
ESA WorldCover 10m v200

The European Space Agency (ESA) WorldCover 10 m 2021 product provides a global land cover map for 2021 at 10 m resolution based on Sentinel-1 and Sentinel-2 data. The WorldCover product comes with 11 land cover classes and has been generated in the framework of … esa landcover landuse sentinel1-derived sentinel2-derived -
Estonia mono orthophotos
Orthophotos are an aerial photo dataset covering Estonia. An orthophoto is a processed aerial photo from which distortions caused by terrain relief, camera tilt relative to the ground at the moment of exposure and camera central projection are removed. A digital orthophoto has a certain … estonia orthophoto -
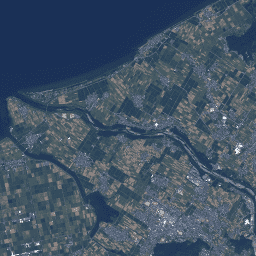
Estonia RGB orthophotos
Orthophotos are an aerial photo dataset covering Estonia. An orthophoto is a processed aerial photo from which distortions caused by terrain relief, camera tilt relative to the ground at the moment of exposure and camera central projection are removed. A digital orthophoto has a certain … estonia orthophoto rgb -
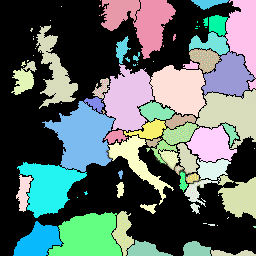
FAO GAUL: Global Administrative Unit Layers 2015, Country Boundaries

The Global Administrative Unit Layers (GAUL) compiles and disseminates the best available information on administrative units for all the countries in the world, providing a contribution to the standardization of the spatial dataset representing administrative units. The GAUL always maintains global layers with a unified … borders countries fao gaul un -
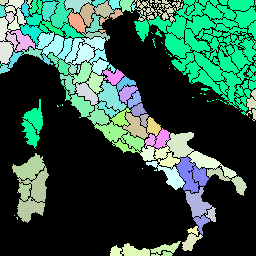
FAO GAUL: Global Administrative Unit Layers 2015, First-Level Administrative Units
The Global Administrative Unit Layers (GAUL) compiles and disseminates the best available information on administrative units for all the countries in the world, providing a contribution to the standardization of the spatial dataset representing administrative units. The GAUL always maintains global layers with a unified … borders departments fao gaul provinces states -
FAO GAUL: Global Administrative Unit Layers 2015, Second-Level Administrative Units
The Global Administrative Unit Layers (GAUL) compiles and disseminates the best available information on administrative units for all the countries in the world, providing a contribution to the standardization of the spatial dataset representing administrative units. The GAUL always maintains global layers with a unified … borders county districts fao gaul un -
FAO GAUL 500m Simplified: Global Administrative Unit Layers 2015, Country Boundaries
This version of GAUL dataset is simplified at 500m. The Global Administrative Unit Layers (GAUL) compiles and disseminates the best available information on administrative units for all the countries in the world, providing a contribution to the standardization of the spatial dataset representing administrative units. … borders countries fao gaul un -
FAO GAUL 500m Simplified: Global Administrative Unit Layers 2015, First-Level Administrative Units

This version of GAUL dataset is simplified at 500m. The Global Administrative Unit Layers (GAUL) compiles and disseminates the best available information on administrative units for all the countries in the world, providing a contribution to the standardization of the spatial dataset representing administrative units. … borders departments fao gaul provinces states -
FAO GAUL 500m Simplified: Global Administrative Unit Layers 2015, Second-Level Administrative Units

This version of GAUL dataset is simplified at 500m. The Global Administrative Unit Layers (GAUL) compiles and disseminates the best available information on administrative units for all the countries in the world, providing a contribution to the standardization of the spatial dataset representing administrative units. … borders county districts fao gaul un -
UN FAO Drained Organic Soils Area (Annual) 1.0
The two related FAO datasets on Drained Organic Soils provide estimates of: DROSA-A: area of Organic Soils (in hectares) drained for agricultural activities (cropland and grazed grassland) DROSE-A: carbon (C) and nitrous oxide (N2O) estimates (in gigagrams) from the agricultural drainage of organic soils under … agriculture climate-change emissions fao ghg organic-soils -
Drained Organic Soils Emissions (Annual) 1.0

The two related FAO datasets on Drained Organic Soils provide estimates of: DROSA-A: area of Organic Soils (in hectares) drained for agricultural activities (cropland and grazed grassland) DROSE-A: carbon (C) and nitrous oxide (N2O) estimates (in gigagrams) from the agricultural drainage of organic soils under … agriculture climate-change emissions fao ghg organic-soils -
Forest proximate people (FPP) 1.0
The "Forest Proximate People" (FPP) dataset is one of the data layers contributing to the development of indicator #13, "number of forest-dependent people in extreme poverty," of the Collaborative Partnership on Forests (CPF) Global Core Set of forest-related indicators (GCS). The FPP dataset provides an … agriculture fao forest global population rural-area -
Tree proximate people (TPP) 1.0
The "Tree Proximate People" (TPP) is one of the datasets contributing to the development of indicator #13, number of forest-dependent people in extreme poverty, of the Collaborative Partnership on Forests (CPF) Global Core Set of forest-related indicators (GCS). The TPP dataset provides 4 different estimates … agriculture fao forest global population rural-area -
WAPOR Actual Evapotranspiration and Interception 2.0
The actual evapotranspiration and interception (ETIa) (dekadal, in mm/day) is the sum of the soil evaporation (E), canopy transpiration (T), and evaporation from rainfall intercepted by leaves (I). The value of each pixel represents the average daily ETIa in a given dekad. agriculture fao wapor water -
WAPOR Dekadal Evaporation 2.0
The evaporation (E) data component (dekadal, in mm/day) is the actual evaporation of the soil surface. The value of each pixel represents the average daily actual evaporation for that specific dekad. agriculture fao wapor water -
WAPOR Dekadal Interception 2.0
The interception (I) data component (dekadal, in mm/day) represents the evaporation of intercepted rainfall from the vegetation canopy. Interception is the process where rainfall is captured by the leaves. Part of this captured rainfall will evaporate again. The value of each pixel represents the average … agriculture fao wapor water -
WAPOR Dekadal Net Primary Production 2.0
Net primary production (NPP) is a fundamental characteristic of an ecosystem, expressing the conversion of carbon dioxide into biomass driven by photosynthesis. The pixel value represents the mean daily NPP for that specific dekad. agriculture fao wapor water -
WAPOR Dekadal Reference Evapotranspiration 2.0
Reference evapotranspiration (RET) is defined as the evapotranspiration from a hypothetical reference crop and it simulates the behaviour of a well-watered grass surface. The value of each pixel represents the average of the daily reference evapotranspiration for that specific dekad. agriculture fao wapor water -
WAPOR Daily Reference Evapotranspiration 2.0
Reference evapotranspiration (RET) is defined as the evapotranspiration from a hypothetical reference crop and it simulates the behaviour of a well-watered grass surface. Each pixel represents the daily reference evapotranspiration in mm. agriculture fao wapor water -
WAPOR Dekadal Transpiration 2.0
The transpiration (T) data component (dekadal, in mm/day) is the actual transpiration of the vegetation canopy. The value of each pixel represents the average daily actual transpiration for that specific dekad. agriculture fao wapor water -
FIRMS: Fire Information for Resource Management System
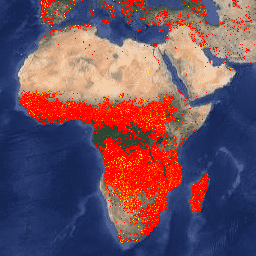
The Earth Engine version of the Fire Information for Resource Management System (FIRMS) dataset contains the LANCE fire detection product in rasterized form. The near real-time (NRT) active fire locations are processed by LANCE using the standard MODIS MOD14/MYD14 Fire and Thermal Anomalies product. Each … eosdis fire firms geophysical hotspot lance -
Finland NRG NLS orthophotos 50 cm by Mavi
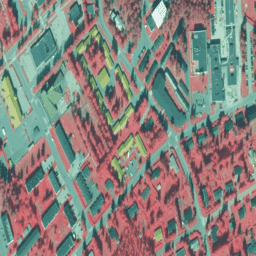
NLS Orthophotos are an aerial photo dataset covering the whole of Finland. This data is provided by Mavi(Agency for Rural Affairs). An orthophoto is a combination of several individual aerial photos. The aerial photo dataset in orthophoto format is available as the most recent dataset … falsecolor finland nrg orthophoto -
Finland RGB NLS orthophotos 50 cm by SMK
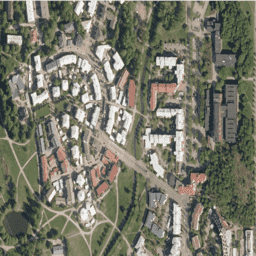
NLS Orthophotos are an aerial photo dataset covering the whole of Finland. This data is provided by SMK(The Energy Agency, formerly abbreviated SMK). An orthophoto is a combination of several individual aerial photos. The aerial photo data set in orthophoto format is available as the … finland orthophoto rgb smk -
Finland NRG NLS orthophotos 50 cm by SMK
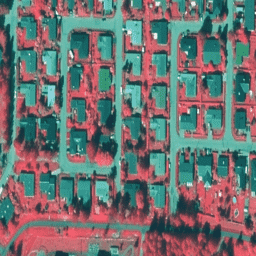
NLS Orthophotos are an aerial photo dataset covering the whole of Finland. This data is provided by SMK(The Energy Agency, formerly abbreviated SMK). An orthophoto is a combination of several individual aerial photos. The aerial photo dataset in orthophoto format is available as the most … falsecolor finland nrg orthophoto smk -
GFW (Global Fishing Watch) Daily Fishing Hours
Fishing effort, measured in hours of inferred fishing activity. Each asset is the effort for a given flag state and day, with one band for the fishing activity of each gear type. See sample Earth Engine scripts. Also see the main GFW site for program … fishing gfw marine monthly ocean -
GFW (Global Fishing Watch) Daily Vessel Hours

Fishing vessel presence, measured in hours per square km. Each asset is the vessel presence for a given flag state and day, with one band for the presence of each gear type. See sample Earth Engine scripts. Also see the main GFW site for program … fishing gfw marine monthly ocean -
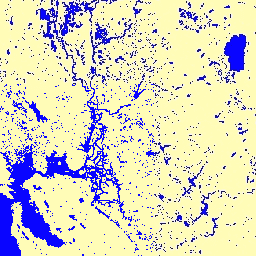
GLCF: Landsat Global Inland Water
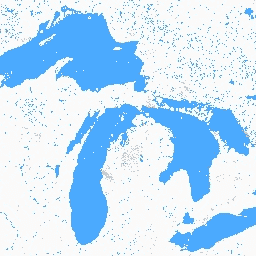
The Global Inland Water dataset shows inland surface water bodies, including fresh and saline lakes, rivers, and reservoirs. From the GLS 2000 epoch, 3,650,723 km2 of inland water were identified, around three quarters of which were in North America and Asia. Boreal forests and tundra … glcf landsat-derived nasa umd water -
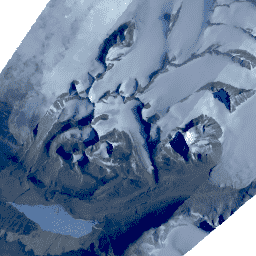
GLIMS 2023: Global Land Ice Measurements From Space
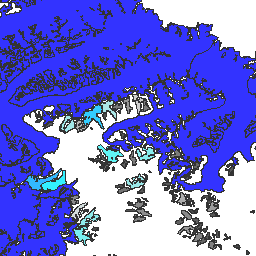
Global Land Ice Measurements from Space (GLIMS) is an international initiative with the goal of repeatedly surveying the world's estimated 200,000 glaciers. The project seeks to create a globally comprehensive inventory of land ice, including measurements of glacier area, geometry, surface velocity, and snow line … ice landcover nasa nsidc snow -
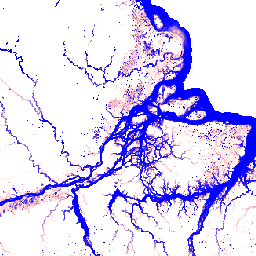
Global Flood Database v1 (2000-2018)
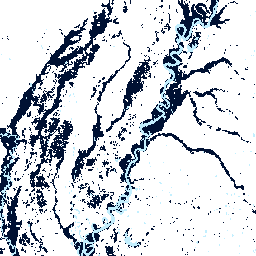
The Global Flood Database contains maps of the extent and temporal distribution of 913 flood events occurring between 2000-2018. For more information, see the associated journal article. Flood events were collected from the Dartmouth Flood Observatory and used to collect MODIS imagery. The selected 913 … flood surface water -
Google Street View Air Quality: High Resolution Air Pollution Mapping in California
This large vector dataset contains high resolution air pollution mapping of NO, NO2, O3, CH4, CO2, BC, PN2.5, and UFP concentrations in California between June 2015 and June 2019. The dataset consists of measurements collected using four Google Street View vehicles equipped with the Aclima … air-quality nitrogen-dioxide pollution -
Cloud Score+ S2_HARMONIZED V1
Cloud Score+ is a quality assessment (QA) processor for medium-to-high resolution optical satellite imagery. The Cloud Score+ S2_HARMONIZED dataset is being operationally produced from the harmonized Sentinel-2 L1C collection, and Cloud Score+ outputs can be used to identify relatively clear pixels and effectively remove clouds … cloud google sentinel2-derived -
Dynamic World V1
Dynamic World is a 10m near-real-time (NRT) Land Use/Land Cover (LULC) dataset that includes class probabilities and label information for nine classes. Dynamic World predictions are available for the Sentinel-2 L1C collection from 2015-06-27 to present. The revisit frequency of Sentinel-2 is between 2-5 days … global google landcover landuse nrt sentinel2-derived -
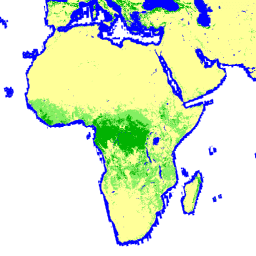
Open Buildings V3 Polygons
This large-scale open dataset consists of outlines of buildings derived from high-resolution 50 cm satellite imagery. It contains 1.8B building detections in Africa, Latin America, Caribbean, South Asia and Southeast Asia. The inference spanned an area of 58M km². For each building in this dataset … africa building -
GRIDMET DROUGHT: CONUS Drought Indices
This dataset contains drought indices derived from the 4-km daily Gridded Surface Meteorological (GRIDMET) dataset. The drought indices provided include the standardized precipitation index (SPI), the evaporative drought demand index (EDDI), the standardized precipitation evapotranspiration index (SPEI), the Palmer Drought Severity Index (PDSI) and Palmer … climate conus crop drought evapotranspiration geophysical -
Brandenburg (Germany) RGBN orthophotos 20 cm
Orthophotos are an aerial photo dataset covering the Brandenburg state of Germany. This data is provided by State government of Brandenburg (LGB). Digital orthophotos are digitally corrected aerial photos and show all objects that are visible from the air at the time of recording in … orthophoto -
HYCOM: Hybrid Coordinate Ocean Model, Sea Surface Elevation
The Hybrid Coordinate Ocean Model (HYCOM) is a data-assimilative hybrid isopycnal-sigma-pressure (generalized) coordinate ocean model. The subset of HYCOM data hosted in EE contains the variables salinity, temperature, velocity, and elevation. They have been interpolated to a uniform 0.08 degree lat/long grid between 80.48°S and … elevation hycom nopp ocean water -
HYCOM: Hybrid Coordinate Ocean Model, Water Temperature and Salinity
The Hybrid Coordinate Ocean Model (HYCOM) is a data-assimilative hybrid isopycnal-sigma-pressure (generalized) coordinate ocean model. The subset of HYCOM data hosted in EE contains the variables salinity, temperature, velocity, and elevation. They have been interpolated to a uniform 0.08 degree lat/long grid between 80.48°S and … hycom nopp ocean sst water -
HYCOM: Hybrid Coordinate Ocean Model, Water Velocity
The Hybrid Coordinate Ocean Model (HYCOM) is a data-assimilative hybrid isopycnal-sigma-pressure (generalized) coordinate ocean model. The subset of HYCOM data hosted in EE contains the variables salinity, temperature, velocity, and elevation. They have been interpolated to a uniform 0.08 degree lat/long grid between 80.48°S and … hycom nopp ocean velocity water -
GRIDMET: University of Idaho Gridded Surface Meteorological Dataset
The Gridded Surface Meteorological dataset provides high spatial resolution (~4-km) daily surface fields of temperature, precipitation, winds, humidity and radiation across the contiguous United States from 1979. The dataset blends the high resolution spatial data from PRISM with the high temporal resolution data from the … climate gridmet humidity merced metdata precipitation -
MACAv2-METDATA: University of Idaho, Multivariate Adaptive Constructed Analogs Applied to Global Climate Models
The MACAv2-METDATA dataset is a collection of 20 global climate models covering the conterminous USA. The Multivariate Adaptive Constructed Analogs (MACA) method is a statistical downscaling method which utilizes a training dataset (i.e. a meteorological observation dataset) to remove historical biases and match spatial patterns … climate conus geophysical idaho maca monthly -
MACAv2-METDATA Monthly Summaries: University of Idaho, Multivariate Adaptive Constructed Analogs Applied to Global Climate Models
The MACAv2-METDATA dataset is a collection of 20 global climate models covering the conterminous USA. The Multivariate Adaptive Constructed Analogs (MACA) method is a statistical downscaling method which utilizes a training dataset (i.e. a meteorological observation dataset) to remove historical biases and match spatial patterns … climate conus geophysical idaho maca monthly -
TerraClimate: Monthly Climate and Climatic Water Balance for Global Terrestrial Surfaces, University of Idaho
TerraClimate is a dataset of monthly climate and climatic water balance for global terrestrial surfaces. It uses climatically aided interpolation, combining high-spatial resolution climatological normals from the WorldClim dataset, with coarser spatial resolution, but time-varying data from CRU Ts4.0 and the Japanese 55-year Reanalysis (JRA55). … climate drought evapotranspiration geophysical global merced -
RGE ALTI: IGN RGE ALTI Digital Elevation 1m
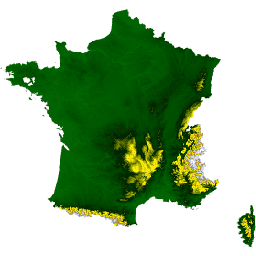
The RGE ALTI dataset describes the digital elevation model (DEM) of France with the pixel size of 1m. It was created from surveys obtained by airborne lidar or by correlation of aerial images. Lidar was deployed for flood-prone, coastal, and large forest areas. The vertical … dem elevation geophysical -
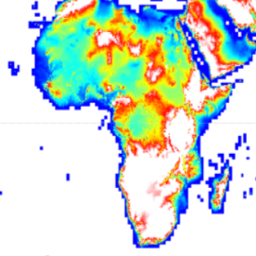
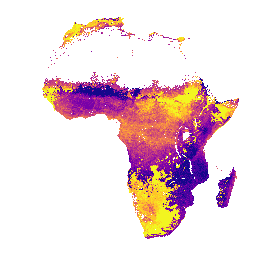
iSDAsoil extractable Aluminium
Extractable aluminium at soil depths of 0-20 cm and 20-50 cm, predicted mean and standard deviation. Pixel values must be back-transformed with exp(x/10)-1. Soil property predictions were made by Innovative Solutions for Decision Agriculture Ltd. (iSDA) at 30 m pixel size using machine learning coupled … africa aluminium isda soil -
iSDAsoil Depth to Bedrock
Depth to bedrock at 0-200 cm depth, predicted mean and standard deviation. Due to the potential cropland mask that was used for generating the data, many areas of exposed rock (where depth to bedrock would be 0 cm) have been masked out and therefore appear … africa bedrock isda soil -
iSDAsoil Bulk Density, <2mm Fraction
Bulk density, <2mm fraction at soil depths of 0-20 cm and 20-50 cm, predicted mean and standard deviation. Pixel values must be back-transformed with x/100. In areas of dense jungle (generally over central Africa), model accuracy is low and therefore artifacts such as banding (striping) … africa isda soil -
iSDAsoil Extractable Calcium
Extractable calcium at soil depths of 0-20 cm and 20-50 cm, predicted mean and standard deviation. Pixel values must be back-transformed with exp(x/10)-1. In areas of dense jungle (generally over central Africa), model accuracy is low and therefore artifacts such as banding (striping) might be … africa isda soil -
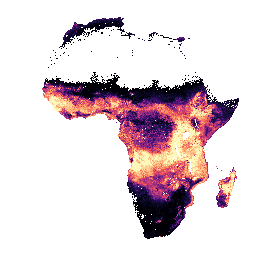
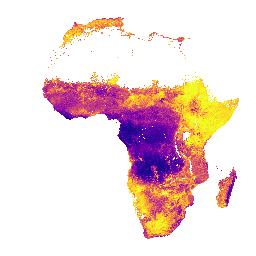
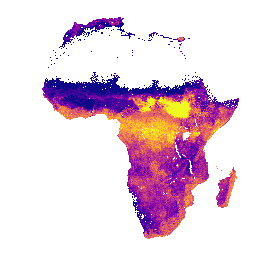
iSDAsoil Organic Carbon
Organic carbon at soil depths of 0-20 cm and 20-50 cm, predicted mean and standard deviation. Pixel values must be back-transformed with exp(x/10)-1. In areas of dense jungle (generally over central Africa), model accuracy is low and therefore artifacts such as banding (striping) might be … africa carbon isda soil -
iSDAsoil Total Carbon
Total carbon at soil depths of 0-20 cm and 20-50 cm, predicted mean and standard deviation. Pixel values must be back-transformed with exp(x/10)-1. In areas of dense jungle (generally over central Africa), model accuracy is low and therefore artifacts such as banding (striping) might be … africa aluminium isda soil -
iSDAsoil Effective Cation Exchange Capacity
Effective Cation Exchange Capacity predicted mean and standard deviation at soil depths of 0-20 cm and 20-50 cm, Pixel values must be back-transformed with exp(x/10)-1. In areas of dense jungle (generally over central Africa), model accuracy is low and therefore artifacts such as banding (striping) … africa aluminium isda soil -
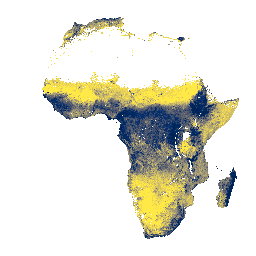
iSDAsoil Clay Content
Clay content at soil depths of 0-20 cm and 20-50 cm,\npredicted mean and standard deviation. In areas of dense jungle (generally over central Africa), model accuracy is low and therefore artifacts such as banding (striping) might be seen. Soil property predictions were made by Innovative … africa clay isda soil -
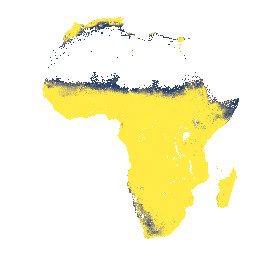
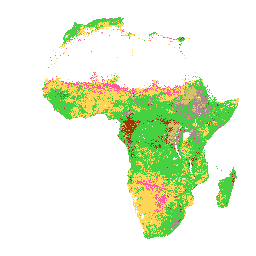
iSDAsoil Fertility Capability Classification
Soil fertility capability classification derived using slope, chemical, and physical soil properties. For more information about this layer, please visit this page. The classes for the 'fcc' band apply to pixel values that must be back-transformed with x modulo 3000. In areas of dense jungle … africa isda soil -
iSDAsoil Extractable Iron
Extractable iron at soil depths of 0-20 cm and 20-50 cm, predicted mean and standard deviation. Pixel values must be back-transformed with exp(x/10)-1. In areas of dense jungle (generally over central Africa), model accuracy is low and therefore artifacts such as banding (striping) might be … africa isda soil -
iSDAsoil Extractable Magnesium
Extractable magnesium at soil depths of 0-20 cm and 20-50 cm, predicted mean and standard deviation. Pixel values must be back-transformed with exp(x/10)-1. In areas of dense jungle (generally over central Africa), model accuracy is low and therefore artifacts such as banding (striping) might be … africa isda soil -
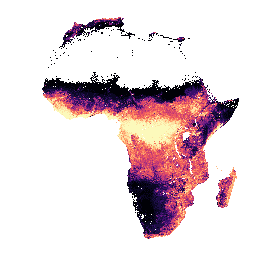
iSDAsoil Total Nitrogen
Total nitrogen at soil depths of 0-20 cm and 20-50 cm, predicted mean and standard deviation. Pixel values must be back-transformed with exp(x/100)-1. In areas of dense jungle (generally over central Africa), model accuracy is low and therefore artifacts such as banding (striping) might be … africa isda soil -
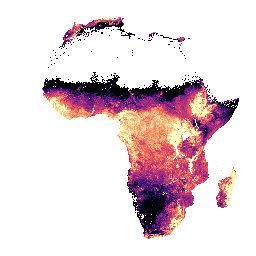
iSDAsoil pH
pH at soil depths of 0-20 cm and 20-50 cm, predicted mean and standard deviation. Pixel values must be back-transformed with x/10. In areas of dense jungle (generally over central Africa), model accuracy is low and therefore artifacts such as banding (striping) might be seen. … africa isda ph soil -
iSDAsoil Extractable Phosphorus
Extractable phosphorus at soil depths of 0-20 cm and 20-50 cm, predicted mean and standard deviation. Pixel values must be back-transformed with exp(x/10)-1. In areas of dense jungle (generally over central Africa), model accuracy is low and therefore artifacts such as banding (striping) might be … africa isda soil -
iSDAsoil Extractable Potassium
Extractable potassium at soil depths of 0-20 cm and 20-50 cm, predicted mean and standard deviation. Pixel values must be back-transformed with exp(x/10)-1. In areas of dense jungle (generally over central Africa), model accuracy is low and therefore artifacts such as banding (striping) might be … africa isda soil -
iSDAsoil Sand Content
Sand content at soil depths of 0-20 cm and 20-50 cm,\npredicted mean and standard deviation. In areas of dense jungle (generally over central Africa), model accuracy is low and therefore artifacts such as banding (striping) might be seen. Soil property predictions were made by Innovative … africa isda sand soil -
iSDAsoil Silt Content
Silt content at soil depths of 0-20 cm and 20-50 cm, predicted mean and standard deviation. Pixel values must be back-transformed with exp(x/10)-1. In areas of dense jungle (generally over central Africa), model accuracy is low and therefore artifacts such as banding (striping) might be … africa isda soil -
iSDAsoil Stone Content
Stone content at soil depths of 0-20 cm and 20-50 cm, predicted mean and standard deviation. Pixel values must be back-transformed with exp(x/10)-1. In areas of dense jungle (generally over central Africa), model accuracy is low and therefore artifacts such as banding (striping) might be … africa isda soil -
iSDAsoil Extractable Sulfur
Extractable sulfur at soil depths of 0-20 cm and 20-50 cm, predicted mean and standard deviation. Pixel values must be back-transformed with exp(x/10)-1. In areas of dense jungle (generally over central Africa), model accuracy is low and therefore artifacts such as banding (striping) might be … africa isda soil -
iSDAsoil USDA Texture Class
USDA Texture Class at soil depths of 0-20 cm and 20-50 cm. In areas of dense jungle (generally over central Africa), model accuracy is low and therefore artifacts such as banding (striping) might be seen. Soil property predictions were made by Innovative Solutions for Decision … africa aluminium isda soil -
iSDAsoil Extractable Zinc
Extractable zinc at soil depths of 0-20 cm and 20-50 cm, predicted mean and standard deviation. Pixel values must be back-transformed with exp(x/10)-1. In areas of dense jungle (generally over central Africa), model accuracy is low and therefore artifacts such as banding (striping) might be … africa isda soil -
ALOS/AVNIR-2 ORI
This dataset is contains orthorectified imagery from the Advanced Visible and Near Infrared Radiometer type 2 (AVNIR-2) sensor on-board the Advanced Land Observing Satellite (ALOS) "DAICHI". The AVNIR-2 ORI product was created from AVNIR-2 1B1 data after stereo matching with reference to ALOS's Panchromatic Remote-sensing … alos jaxa orthophoto visible -
ALOS DSM: Global 30m v3.2
ALOS World 3D - 30m (AW3D30) is a global digital surface model (DSM) dataset with a horizontal resolution of approximately 30 meters (1 arcsec mesh). The dataset is based on the DSM dataset (5-meter mesh version) of the World 3D Topographic Data. More details are … alos dem elevation geophysical jaxa topography -
ALOS-2 PALSAR-2 StripMap Level 2.1
Starting from the night of January 1st, 2024, based on the request from Japanese ministries and related organization, JAXA implemented ALOS-2 PALSAR-2 emergency observation. Since JAXA expects these emergency observation data to be extremely useful for disaster management, JAXA decided to open these data on … alos2 eroc jaxa palsar2 radar sar -
PALSAR-2 ScanSAR Level 2.2
The 25 m PALSAR-2 ScanSAR is normalized backscatter data of PALSAR-2 broad area observation mode with observation width of 350 km. The SAR imagery was ortho-rectificatied and slope corrected using the ALOS World 3D - 30 m (AW3D30) Digital Surface Model. Polarization data are stored … alos2 eroc jaxa palsar2 radar sar -
Global 3-class PALSAR-2/PALSAR Forest/Non-Forest Map
A newer version of this dataset with 4 classes for 2017-2020 can be found in JAXA/ALOS/PALSAR/YEARLY/FNF4 The global forest/non-forest map (FNF) is generated by classifying the SAR image (backscattering coefficient) in the global 25m resolution PALSAR-2/PALSAR SAR mosaic so that strong and low backscatter pixels … alos alos2 classification eroc forest jaxa -
Global 4-class PALSAR-2/PALSAR Forest/Non-Forest Map
The global forest/non-forest map (FNF) is generated by classifying the SAR image (backscattering coefficient) in the global 25m resolution PALSAR-2/PALSAR SAR mosaic so that strong and low backscatter pixels are assigned as "forest" and "non-forest", respectively. Here, "forest" is defined as the natural forest with … alos alos2 classification eroc forest jaxa -
Global PALSAR-2/PALSAR Yearly Mosaic, version 1

A newer version of this dataset with data for 2015-2021 can be found in JAXA/ALOS/PALSAR/YEARLY/SAR_EPOCH The global 25m PALSAR/PALSAR-2 mosaic is a seamless global SAR image created by mosaicking strips of SAR imagery from PALSAR/PALSAR-2. For each year and location, the strip data were selected … alos alos2 eroc jaxa palsar palsar2 -
Global PALSAR-2/PALSAR Yearly Mosaic, version 2
The global 25m PALSAR/PALSAR-2 mosaic is a seamless global SAR image created by mosaicking strips of SAR imagery from PALSAR/PALSAR-2. For each year and location, the strip data were selected through visual inspection of the browse mosaics available over the period, with those showing minimum … alos alos2 eroc jaxa palsar palsar2 -
GCOM-C/SGLI L3 Leaf Area Index (V1)
This product is the sum of the one-sided green leaf area per unit ground area. A newer version JAXA/GCOM-C/L3/LAND/LAI/V3 is also available for this dataset which uses this algorithm for processing. GCOM-C conducts long-term and continuous global observation and data collection to elucidate the mechanism … climate g-portal gcom gcom-c jaxa lai -
GCOM-C/SGLI L3 Leaf Area Index (V2)

This product is the sum of the one-sided green leaf area per unit ground area. For data after 2021-11-28, see the V3 dataset. GCOM-C conducts long-term and continuous global observation and data collection to elucidate the mechanism behind fluctuations in radiation budget and carbon cycle … climate g-portal gcom gcom-c jaxa lai -
GCOM-C/SGLI L3 Leaf Area Index (V3)

This product is the sum of the one-sided green leaf area per unit ground area. This is an ongoing dataset with a latency of 3-4 days. GCOM-C conducts long-term and continuous global observation and data collection to elucidate the mechanism behind fluctuations in radiation budget … climate g-portal gcom gcom-c jaxa lai -
GCOM-C/SGLI L3 Land Surface Temperature (V1)

This product is the temperature of terrestrial land surface. A newer version JAXA/GCOM-C/L3/LAND/LST/V3 is also available for this dataset which uses this algorithm for processing. GCOM-C conducts long-term and continuous global observation and data collection to elucidate the mechanism behind fluctuations in radiation budget and … climate g-portal gcom gcom-c jaxa land -
GCOM-C/SGLI L3 Land Surface Temperature (V2)
This product is the temperature of terrestrial land surface. For data after 2021-11-28, see the V3 dataset. GCOM-C conducts long-term and continuous global observation and data collection to elucidate the mechanism behind fluctuations in radiation budget and carbon cycle needed to make accurate projections regarding … climate g-portal gcom gcom-c jaxa land -
GCOM-C/SGLI L3 Land Surface Temperature (V3)

This product is the temperature of terrestrial land surface. This is an ongoing dataset with a latency of 3-4 days. GCOM-C conducts long-term and continuous global observation and data collection to elucidate the mechanism behind fluctuations in radiation budget and carbon cycle needed to make … climate g-portal gcom gcom-c jaxa land -
GCOM-C/SGLI L3 Chlorophyll-a Concentration (V1)
This product is the concentration of the photosynthetic pigment (chlorophyll-a) in phytoplankton in the sea surface layer. A newer version JAXA/GCOM-C/L3/OCEAN/CHLA/V3 is also available for this dataset which uses this algorithm for processing. GCOM-C conducts long-term and continuous global observation and data collection to elucidate … chla chlorophyll-a climate g-portal gcom gcom-c -
GCOM-C/SGLI L3 Chlorophyll-a Concentration (V2)

This product is the concentration of the photosynthetic pigment (chlorophyll-a) in phytoplankton in the sea surface layer. For data after 2021-11-28, see the V3 dataset. GCOM-C conducts long-term and continuous global observation and data collection to elucidate the mechanism behind fluctuations in radiation budget and … chla chlorophyll-a climate g-portal gcom gcom-c -
GCOM-C/SGLI L3 Chlorophyll-a Concentration (V3)

This product is the concentration of the photosynthetic pigment (chlorophyll-a) in phytoplankton in the sea surface layer. This is an ongoing dataset with a latency of 3-4 days. GCOM-C conducts long-term and continuous global observation and data collection to elucidate the mechanism behind fluctuations in … chla chlorophyll-a climate g-portal gcom gcom-c -
GCOM-C/SGLI L3 Sea Surface Temperature (V1)

This product is the temperature of sea surface. A newer version JAXA/GCOM-C/L3/OCEAN/SST/V3 is also available for this dataset which uses this algorithm for processing. GCOM-C conducts long-term and continuous global observation and data collection to elucidate the mechanism behind fluctuations in radiation budget and carbon … climate g-portal gcom gcom-c jaxa ocean -
GCOM-C/SGLI L3 Sea Surface Temperature (V2)
This product is the temperature of sea surface. For data after 2021-11-28, see the V3 dataset. GCOM-C conducts long-term and continuous global observation and data collection to elucidate the mechanism behind fluctuations in radiation budget and carbon cycle needed to make accurate projections regarding future … climate g-portal gcom gcom-c jaxa ocean -
GCOM-C/SGLI L3 Sea Surface Temperature (V3)

This product is the temperature of sea surface. This is an ongoing dataset with a latency of 3-4 days. GCOM-C conducts long-term and continuous global observation and data collection to elucidate the mechanism behind fluctuations in radiation budget and carbon cycle needed to make accurate … climate g-portal gcom gcom-c jaxa ocean -
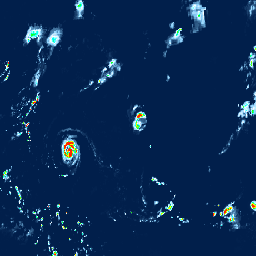
GSMaP Operational: Global Satellite Mapping of Precipitation - V6

Global Satellite Mapping of Precipitation (GSMaP) provides a global hourly rain rate with a 0.1 x 0.1 degree resolution. GSMaP is a product of the Global Precipitation Measurement (GPM) mission, which provides global precipitation observations at three hour intervals. Values are estimated using multi-band passive … climate geophysical gpm hourly jaxa precipitation -
GSMaP Reanalysis: Global Satellite Mapping of Precipitation
Global Satellite Mapping of Precipitation (GSMaP) provides a global hourly rain rate with a 0.1 x 0.1 degree resolution. GSMaP is a product of the Global Precipitation Measurement (GPM) mission, which provides global precipitation observations at three hour intervals. Values are estimated using multi-band passive … climate geophysical gpm hourly jaxa precipitation -
GSMaP Operational: Global Satellite Mapping of Precipitation - V7
Global Satellite Mapping of Precipitation (GSMaP) provides a global hourly rain rate with a 0.1 x 0.1 degree resolution. GSMaP is a product of the Global Precipitation Measurement (GPM) mission, which provides global precipitation observations at three hour intervals. Values are estimated using multi-band passive … climate geophysical gpm hourly jaxa precipitation -
GSMaP Operational: Global Satellite Mapping of Precipitation - V8
Global Satellite Mapping of Precipitation (GSMaP) provides a global hourly rain rate with a 0.1 x 0.1 degree resolution. GSMaP is a product of the Global Precipitation Measurement (GPM) mission, which provides global precipitation observations at three hour intervals. Values are estimated using multi-band passive … climate geophysical gpm hourly jaxa precipitation -
Murray Global Tidal Wetland Change v1.0 (1999-2019)
The Murray Global Tidal Wetland Change Dataset contains maps of the global extent of tidal wetlands and their change. The maps were developed from a three stage classification that sought to (i) estimate the global distribution of tidal wetlands (defined as either tidal marsh, tidal … coastal intertidal landsat-derived mangrove murray -
EUCROPMAP 2018
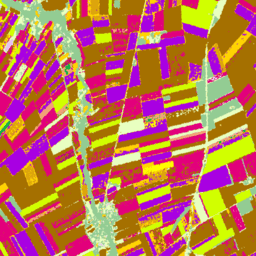
European crop type map based on Sentinel-1 and LUCAS Copernicus in-situ observations for 2018. Capitalizing on the unique LUCAS 2018 Copernicus in-situ survey, this dataset is the first continental crop type map with 10m pixel size for the EU based on S1A and S1B Synthetic … crop eu jrc lucas sentinel1-derived -
EC JRC global map of forest cover 2020, V1
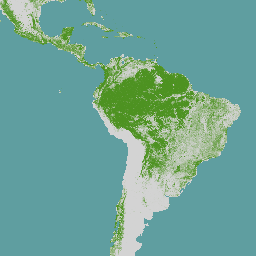
The EC JRC global map of forest cover provides a spatially explicit representation of forest presence and absence for the year 2020 at 10m spatial resolution. The year 2020 corresponds to the cut-off date of the Regulation from the European Union "on the making available … forest jrc -
GHSL: Global settlement characteristics (10 m) 2018 (P2023A)
This spatial raster dataset delineates human settlements at 10 m resolution, and describes their inner characteristics in terms of the functional and height-related components of the built environment. More information about the GHSL data products can be found in the GHSL Data Package 2023 report … building built builtup copernicus ghsl height -
GHSL: Global building height 2018 (P2023A)
This spatial raster dataset depicts the global distribution of building heights at a resolution of 100 m, referred to the year 2018. The input data used to predict building heights are the ALOS Global Digital Surface Model (30 m), the NASA Shuttle Radar Topographic Mission … alos building built built-environment builtup copernicus -
GHSL: Global built-up surface 1975-2030 (P2023A)
This raster dataset depicts the distribution of built-up surfaces, expressed in square metres per 100 m grid cell. The dataset measures: a) the total built-up surface, and b) the built-up surface allocated to grid cells of predominant non-residential (NRES) use. Data are spatially-temporally interpolated or … built built-environment builtup copernicus ghsl jrc -
GHSL: Global built-up surface 10m (P2023A)
This raster dataset depicts the distribution of built-up surfaces, expressed in square metres per 10 m grid cell, for 2018 as observed from the S2 image data. The datasets measure: a) the total built-up surface, and b) the built-up surface allocated to grid cells of … built built-environment builtup copernicus ghsl jrc -
GHSL: Global building volume 1975-2030 (P2023A)
This raster dataset depicts the global distribution of building volume, expressed in cubic metres per 100 m grid cell. The dataset measures the total building volume and the building volume allocated to grid cells of predominant non-residential (NRES) use. Estimates are based on the (built-up … alos building built-environment copernicus dem ghsl -
GHSL: Global population surfaces 1975-2030 (P2023A)
This raster dataset depicts the spatial distribution of residential population, expressed as the absolute number of inhabitants of the cell. Residential population estimates between 1975 and 2020 in 5-year intervals and projections to 2025 and 2030 derived from CIESIN GPWv4.11 were disaggregated from census or … ghsl jrc population sdg -
GHSL: Degree of Urbanization 1975-2030 (P2023A)
This raster dataset represents a global, multitemporal rural-urban classification, applying the "Degree of Urbanisation" stage I methodology recommended by UN Statistical Commission, based on global gridded population and built-up surface data generated by the GHSL project for the epochs 1975-2030 in 5-year intervals. The Degree … ghsl jrc sdg settlement -
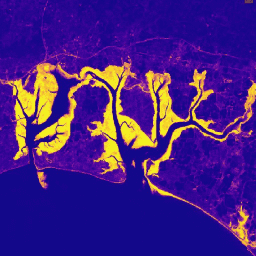
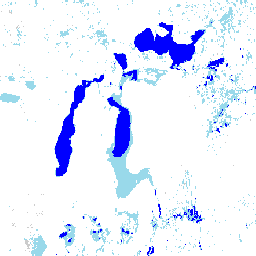
JRC Global Surface Water Mapping Layers, v1.4
This dataset contains maps of the location and temporal distribution of surface water from 1984 to 2021 and provides statistics on the extent and change of those water surfaces. For more information see the associated journal article: High-resolution mapping of global surface water and its … change-detection geophysical google jrc landsat-derived surface -
JRC Global Surface Water Metadata, v1.4
This dataset contains maps of the location and temporal distribution of surface water from 1984 to 2021 and provides statistics on the extent and change of those water surfaces. For more information see the associated journal article: High-resolution mapping of global surface water and its … geophysical google jrc landsat-derived surface water -
JRC Monthly Water History, v1.4
This dataset contains maps of the location and temporal distribution of surface water from 1984 to 2021 and provides statistics on the extent and change of those water surfaces. For more information see the associated journal article: High-resolution mapping of global surface water and its … geophysical google history jrc landsat-derived monthly -
JRC Monthly Water Recurrence, v1.4
This dataset contains maps of the location and temporal distribution of surface water from 1984 to 2021 and provides statistics on the extent and change of those water surfaces. For more information see the associated journal article: High-resolution mapping of global surface water and its … geophysical google history jrc landsat-derived monthly -
JRC Yearly Water Classification History, v1.4
This dataset contains maps of the location and temporal distribution of surface water from 1984 to 2021 and provides statistics on the extent and change of those water surfaces. For more information see the associated journal article: High-resolution mapping of global surface water and its … annual geophysical google history jrc landsat-derived -
GlobFire Daily Fire Event Detection Based on MCD64A1
Fire boundaries based on the MODIS dataset MCD64A1. The data were computed based on an algorithm that relies on encoding in a graph structure a space-time relationship among patches of burned areas. Each fire has a unique number identifying the event. area burnt disaster fire globfire mcd64a1 -
GlobFire Final Fire Event Detection Based on MCD64A1

Fire boundaries based on the MODIS dataset MCD64A1. The data were computed based on an algorithm that relies on encoding in a graph structure a space-time relationship among patches of burned areas. Each fire has a unique number identifying the event. area burnt disaster fire globfire mcd64a1 -
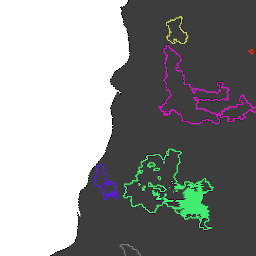
LUCAS Copernicus (Polygons with attributes, 2018) V1
The Land Use/Cover Area frame Survey (LUCAS) in the European Union (EU) was set up to provide statistical information. It represents a triennial in-situ landcover and land-use data-collection exercise that extends over the whole of the EU's territory. LUCAS collects information on land cover and … copernicus eu jrc landcover landuse lucas -
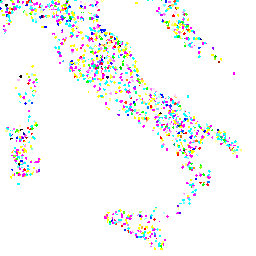
LUCAS Harmonized (Theoretical Location, 2006-2018) V1
The Land Use/Cover Area frame Survey (LUCAS) in the European Union (EU) was set up to provide statistical information. It represents a triennial in-situ landcover and land-use data-collection exercise that extends over the whole of the EU's territory. LUCAS collects information on land cover and … eu jrc landcover landuse lucas -
Iran Land Cover Map v1 13-class (2017)
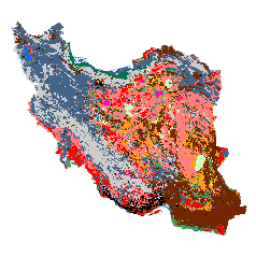
The Iran-wide land cover map was generated by processing Sentinel imagery within the Google Earth Engine Cloud platform. For this purpose, over 2,500 Sentinel-1 and over 11,000 Sentinel-2 images were processed to produce a single mosaic dataset for the year 2017. Then, an object-based Random … landcover -
LANDFIRE FRG (Fire Regime Groups) v1.2.0

LANDFIRE (LF), Landscape Fire and Resource Management Planning Tools, is a shared program between the wildland fire management programs of the U.S. Department of Agriculture's Forest Service, U.S. Department of the Interior's Geological Survey, and The Nature Conservancy. Landfire (LF) Historical fire regimes, intervals, and … doi fire landfire nature-conservancy usda usgs -
LANDFIRE MFRI (Mean Fire Return Interval) v1.2.0

LANDFIRE (LF), Landscape Fire and Resource Management Planning Tools, is a shared program between the wildland fire management programs of the U.S. Department of Agriculture's Forest Service, U.S. Department of the Interior's Geological Survey, and The Nature Conservancy. Landfire (LF) Historical fire regimes, intervals, and … doi fire landfire nature-conservancy usda usgs -
LANDFIRE PLS (Percent Low-severity Fire) v1.2.0
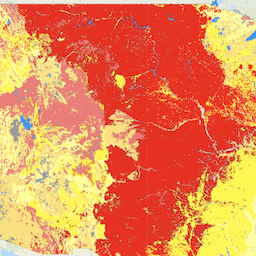
LANDFIRE (LF), Landscape Fire and Resource Management Planning Tools, is a shared program between the wildland fire management programs of the U.S. Department of Agriculture's Forest Service, U.S. Department of the Interior's Geological Survey, and The Nature Conservancy. Landfire (LF) Historical fire regimes, intervals, and … doi fire landfire nature-conservancy usda usgs -
LANDFIRE PMS (Percent of Mixed-severity Fire) v1.2.0

LANDFIRE (LF), Landscape Fire and Resource Management Planning Tools, is a shared program between the wildland fire management programs of the U.S. Department of Agriculture's Forest Service, U.S. Department of the Interior's Geological Survey, and The Nature Conservancy. Landfire (LF) Historical fire regimes, intervals, and … doi fire landfire nature-conservancy usda usgs -
LANDFIRE PRS (Percent of Replacement-severity Fire) v1.2.0

LANDFIRE (LF), Landscape Fire and Resource Management Planning Tools, is a shared program between the wildland fire management programs of the U.S. Department of Agriculture's Forest Service, U.S. Department of the Interior's Geological Survey, and The Nature Conservancy. Landfire (LF) Historical fire regimes, intervals, and … doi fire landfire nature-conservancy usda usgs -
LANDFIRE SClass (Succession Classes) v1.4.0

LANDFIRE (LF), Landscape Fire and Resource Management Planning Tools, is a shared program between the wildland fire management programs of the U.S. Department of Agriculture's Forest Service, U.S. Department of the Interior's Geological Survey, and The Nature Conservancy. Landfire (LF) Historical fire regimes, intervals, and … doi fire landfire nature-conservancy usda usgs -
LANDFIRE VCC (Vegetation Condition Class) v1.4.0

LANDFIRE (LF), Landscape Fire and Resource Management Planning Tools, is a shared program between the wildland fire management programs of the U.S. Department of Agriculture's Forest Service, U.S. Department of the Interior's Geological Survey, and The Nature Conservancy. Landfire (LF) Historical fire regimes, intervals, and … doi fire landfire nature-conservancy usda usgs -
LANDFIRE VDep (Vegetation Departure) v1.4.0

LANDFIRE (LF), Landscape Fire and Resource Management Planning Tools, is a shared program between the wildland fire management programs of the U.S. Department of Agriculture's Forest Service, U.S. Department of the Interior's Geological Survey, and The Nature Conservancy. Landfire (LF) Historical fire regimes, intervals, and … doi fire landfire nature-conservancy usda usgs -
LANDFIRE BPS (Biophysical Settings) v1.4.0

LANDFIRE (LF), Landscape Fire and Resource Management Planning Tools, is a shared program between the wildland fire management programs of the U.S. Department of Agriculture's Forest Service, U.S. Department of the Interior's Geological Survey, and The Nature Conservancy. LANDFIRE (LF) layers are created using predictive … doi fire landfire nature-conservancy usda usgs -
LANDFIRE ESP AK (Environmental Site Potential) v1.2.0
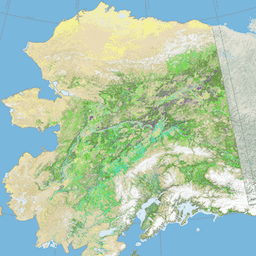
LANDFIRE (LF), Landscape Fire and Resource Management Planning Tools, is a shared program between the wildland fire management programs of the U.S. Department of Agriculture's Forest Service, U.S. Department of the Interior's Geological Survey, and The Nature Conservancy. LANDFIRE (LF) layers are created using predictive … doi fire landfire nature-conservancy usda usgs -
LANDFIRE ESP CONUS (Environmental Site Potential) v1.2.0

LANDFIRE (LF), Landscape Fire and Resource Management Planning Tools, is a shared program between the wildland fire management programs of the U.S. Department of Agriculture's Forest Service, U.S. Department of the Interior's Geological Survey, and The Nature Conservancy. LANDFIRE (LF) layers are created using predictive … doi fire landfire nature-conservancy usda usgs -
LANDFIRE ESP HI (Environmental Site Potential) v1.2.0
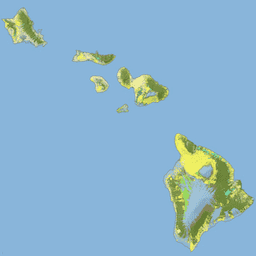
LANDFIRE (LF), Landscape Fire and Resource Management Planning Tools, is a shared program between the wildland fire management programs of the U.S. Department of Agriculture's Forest Service, U.S. Department of the Interior's Geological Survey, and The Nature Conservancy. LANDFIRE (LF) layers are created using predictive … doi fire landfire nature-conservancy usda usgs -
LANDFIRE EVC (Existing Vegetation Cover) v1.4.0

LANDFIRE (LF), Landscape Fire and Resource Management Planning Tools, is a shared program between the wildland fire management programs of the U.S. Department of Agriculture's Forest Service, U.S. Department of the Interior's Geological Survey, and The Nature Conservancy. LANDFIRE (LF) layers are created using predictive … doi fire landfire nature-conservancy usda usgs -
LANDFIRE EVH (Existing Vegetation Height) v1.4.0
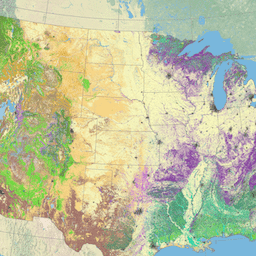
LANDFIRE (LF), Landscape Fire and Resource Management Planning Tools, is a shared program between the wildland fire management programs of the U.S. Department of Agriculture's Forest Service, U.S. Department of the Interior's Geological Survey, and The Nature Conservancy. LANDFIRE (LF) layers are created using predictive … doi fire landfire nature-conservancy usda usgs -
LANDFIRE EVT (Existing Vegetation Type) v1.4.0

LANDFIRE (LF), Landscape Fire and Resource Management Planning Tools, is a shared program between the wildland fire management programs of the U.S. Department of Agriculture's Forest Service, U.S. Department of the Interior's Geological Survey, and The Nature Conservancy. LANDFIRE (LF) layers are created using predictive … doi fire landfire nature-conservancy usda usgs -
Landsat Global Land Survey 1975
The Global Land Survey (GLS) 1975 is a global collection of imagery from the Landsat Multispectral Scanner (MSS). Most scenes were acquired by Landsat 1-3 in 1972-1983. A few gaps in the Landsat 1-3 data have been filled with scenes acquired by Landsat 4-5 during … global gls landsat radiance usgs -
Landsat Global Land Survey 2005, Landsat 5+7 scenes

The GLS2005 data set is a collection of 9500 orthorectified leaf-on medium-resolution satellite images collected between 2004 and 2007 and covering the Earth's land masses. GLS2005 uses mainly Landsat 5 and gap-filled Landsat 7 data with EO-1 ALI and Terra ASTER data filling in any … gls landsat radiance usgs -
Landsat Global Land Survey 2005, Landsat 5 scenes

The GLS2005 data set is a collection of 9500 orthorectified leaf-on medium-resolution satellite images collected between 2004 and 2007 and covering the Earth's land masses. GLS2005 uses mainly Landsat 5 and gap-filled Landsat 7 data with EO-1 ALI and Terra ASTER data filling in any … etm gls l5 landsat radiance usgs -
Landsat Global Land Survey 2005, Landsat 7 scenes
The GLS2005 data set is a collection of 9500 orthorectified leaf-on medium-resolution satellite images collected between 2004 and 2007 and covering the Earth's land masses. GLS2005 uses mainly Landsat 5 and gap-filled Landsat 7 data with EO-1 ALI and Terra ASTER data filling in any … etm gls l7 landsat radiance usgs -
USGS Landsat 8 Collection 2 Tier 1 Raw Scenes
Landsat 8 Collection 2 Tier 1 DN values, representing scaled, calibrated at-sensor radiance. Landsat scenes with the highest available data quality are placed into Tier 1 and are considered suitable for time-series processing analysis. Tier 1 includes Level-1 Precision Terrain (L1TP) processed data that have … c2 global l8 landsat lc8 oli-tirs -
USGS Landsat 8 Level 2, Collection 2, Tier 1

This dataset contains atmospherically corrected surface reflectance and land surface temperature derived from the data produced by the Landsat 8 OLI/TIRS sensors. These images contain 5 visible and near-infrared (VNIR) bands and 2 short-wave infrared (SWIR) bands processed to orthorectified surface reflectance, and one thermal … cfmask cloud fmask global l8sr landsat -
USGS Landsat 8 Collection 2 Tier 1 and Real-Time data Raw Scenes

Landsat 8 Collection 2 Tier 1 and Real-Time data DN values, representing scaled, calibrated at-sensor radiance. Landsat scenes with the highest available data quality are placed into Tier 1 and are considered suitable for time-series processing analysis. Tier 1 includes Level-1 Precision Terrain (L1TP) processed … c2 global l8 landsat lc8 nrt -
USGS Landsat 8 Collection 2 Tier 1 and Real-Time data TOA Reflectance

Landsat 8 Collection 2 Tier 1 and Real-Time data calibrated top-of-atmosphere (TOA) reflectance. Calibration coefficients are extracted from the image metadata. See Chander et al. (2009) for details on the TOA computation. Landsat scenes with the highest available data quality are placed into Tier 1 … c2 global l8 landsat lc8 toa -
USGS Landsat 8 Collection 2 Tier 1 TOA Reflectance

Landsat 8 Collection 2 Tier 1 calibrated top-of-atmosphere (TOA) reflectance. Calibration coefficients are extracted from the image metadata. See Chander et al. (2009) for details on the TOA computation. Landsat scenes with the highest available data quality are placed into Tier 1 and are considered … c2 global landsat toa usgs -
USGS Landsat 8 Collection 2 Tier 2 Raw Scenes

Landsat 8 Collection 2 Tier 2 DN values, representing scaled, calibrated at-sensor radiance. Scenes not meeting Tier 1 criteria during processing are assigned to Tier 2. This includes Systematic terrain (L1GT) and Systematic (L1GS) processed scenes, as well as any L1TP scenes that do not … c2 global l8 landsat lc8 oli-tirs -
USGS Landsat 8 Level 2, Collection 2, Tier 2

This dataset contains atmospherically corrected surface reflectance and land surface temperature derived from the data produced by the Landsat 8 OLI/TIRS sensors. These images contain 5 visible and near-infrared (VNIR) bands and 2 short-wave infrared (SWIR) bands processed to orthorectified surface reflectance, and one thermal … cfmask cloud fmask global l8sr landsat -
USGS Landsat 8 Collection 2 Tier 2 TOA Reflectance

Landsat 8 Collection 2 Tier 2 calibrated top-of-atmosphere (TOA) reflectance. Calibration coefficients are extracted from the image metadata. See Chander et al. (2009) for details on the TOA computation. Scenes not meeting Tier 1 criteria during processing are assigned to Tier 2. This includes Systematic … c2 global landsat toa usgs -
USGS Landsat 9 Collection 2 Tier 1 Raw Scenes

Landsat 9 Collection 2 Tier 1 DN values, representing scaled, calibrated at-sensor radiance. Landsat scenes with the highest available data quality are placed into Tier 1 and are considered suitable for time-series processing analysis. Tier 1 includes Level-1 Precision Terrain (L1TP) processed data that have … c2 global l9 landsat lc9 oli-tirs -
USGS Landsat 9 Level 2, Collection 2, Tier 1

This dataset contains atmospherically corrected surface reflectance and land surface temperature derived from the data produced by the Landsat 9 OLI/TIRS sensors. These images contain 5 visible and near-infrared (VNIR) bands and 2 short-wave infrared (SWIR) bands processed to orthorectified surface reflectance, and one thermal … cfmask cloud fmask global l9sr landsat -
USGS Landsat 9 Collection 2 Tier 1 TOA Reflectance
Landsat 9 Collection 2 Tier 1 calibrated top-of-atmosphere (TOA) reflectance. Calibration coefficients are extracted from the image metadata. See Chander et al. (2009) for details on the TOA computation. Landsat scenes with the highest available data quality are placed into Tier 1 and are considered … c2 global landsat toa usgs -
USGS Landsat 9 Collection 2 Tier 2 Raw Scenes

Landsat 9 Collection 2 Tier 2 DN values, representing scaled, calibrated at-sensor radiance. Scenes not meeting Tier 1 criteria during processing are assigned to Tier 2. This includes Systematic terrain (L1GT) and Systematic (L1GS) processed scenes, as well as any L1TP scenes that do not … c2 global l9 landsat lc9 oli-tirs -
USGS Landsat 9 Level 2, Collection 2, Tier 2

This dataset contains atmospherically corrected surface reflectance and land surface temperature derived from the data produced by the Landsat 9 OLI/TIRS sensors. These images contain 5 visible and near-infrared (VNIR) bands and 2 short-wave infrared (SWIR) bands processed to orthorectified surface reflectance, and one thermal … cfmask cloud fmask global l9sr landsat -
USGS Landsat 9 Collection 2 Tier 2 TOA Reflectance

Landsat 9 Collection 2 Tier 2 calibrated top-of-atmosphere (TOA) reflectance. Calibration coefficients are extracted from the image metadata. See Chander et al. (2009) for details on the TOA computation. Scenes not meeting Tier 1 criteria during processing are assigned to Tier 2. This includes Systematic … c2 global l9 landsat lc9 toa -
USGS Landsat 7 Collection 2 Tier 1 Raw Scenes

Landsat 7 Collection 2 Tier 1 DN values, representing scaled, calibrated at-sensor radiance. Landsat scenes with the highest available data quality are placed into Tier 1 and are considered suitable for time-series processing analysis. Tier 1 includes Level-1 Precision Terrain (L1TP) processed data that have … c2 etm global l7 landsat le7 -
USGS Landsat 7 Level 2, Collection 2, Tier 1

This dataset contains atmospherically corrected surface reflectance and land surface temperature derived from the data produced by the Landsat 7 ETM+ sensor. These images contain 4 visible and near-infrared (VNIR) bands and 2 short-wave infrared (SWIR) bands processed to orthorectified surface reflectance, and one thermal … cfmask cloud etm fmask global landsat -
USGS Landsat 7 Collection 2 Tier 1 and Real-Time data Raw Scenes

Landsat 7 Collection 2 Tier 1 and Real-Time data DN values, representing scaled, calibrated at-sensor radiance. Landsat scenes with the highest available data quality are placed into Tier 1 and are considered suitable for time-series processing analysis. Tier 1 includes Level-1 Precision Terrain (L1TP) processed … c2 etm global l7 landsat le7 -
USGS Landsat 7 Collection 2 Tier 1 and Real-Time data TOA Reflectance

Landsat 7 Collection 2 Tier 1 and Real-Time data calibrated top-of-atmosphere (TOA) reflectance. Calibration coefficients are extracted from the image metadata. See Chander et al. (2009) for details on the TOA computation. Note that Landsat 7's orbit has been drifting to an earlier acquisition time … c2 global landsat toa usgs -
USGS Landsat 7 Collection 2 Tier 1 TOA Reflectance

Landsat 7 Collection 2 Tier 1 calibrated top-of-atmosphere (TOA) reflectance. Calibration coefficients are extracted from the image metadata. See Chander et al. (2009) for details on the TOA computation. Note that Landsat 7's orbit has been drifting to an earlier acquisition time since 2017. c2 global landsat toa usgs -
USGS Landsat 7 Collection 2 Tier 2 Raw Scenes

Landsat 7 Collection 2 Tier 2 DN values, representing scaled, calibrated at-sensor radiance. Scenes not meeting Tier 1 criteria during processing are assigned to Tier 2. This includes Systematic terrain (L1GT) and Systematic (L1GS) processed scenes, as well as any L1TP scenes that do not … c2 etm global l7 landsat le7 -
USGS Landsat 7 Level 2, Collection 2, Tier 2
This dataset contains atmospherically corrected surface reflectance and land surface temperature derived from the data produced by the Landsat 7 ETM+ sensor. These images contain 4 visible and near-infrared (VNIR) bands and 2 short-wave infrared (SWIR) bands processed to orthorectified surface reflectance, and one thermal … cfmask cloud etm fmask global landsat -
USGS Landsat 7 Collection 2 Tier 2 TOA Reflectance

Landsat 7 Collection 2 Tier 2 calibrated top-of-atmosphere (TOA) reflectance. Calibration coefficients are extracted from the image metadata. See Chander et al. (2009) for details on the TOA computation. Note that Landsat 7's orbit has been drifting to an earlier acquisition time since 2017. c2 global landsat toa usgs -
USGS Landsat 1 MSS Collection 2 Tier 1 Raw Scenes

Landsat 1 MSS Collection 2 Tier 1 DN values, representing scaled, calibrated at-sensor radiance. Landsat scenes with the highest available data quality are placed into Tier 1 and are considered suitable for time-series processing analysis. Tier 1 includes Level-1 Precision Terrain (L1TP) processed data that … c2 global l1 landsat lm1 mss -
USGS Landsat 1 MSS Collection 2 Tier 2 Raw Scenes

Landsat 1 MSS Collection 2 Tier 2 DN values, representing scaled, calibrated at-sensor radiance. Scenes not meeting Tier 1 criteria during processing are assigned to Tier 2. This includes Systematic terrain (L1GT) and Systematic (L1GS) processed scenes, as well as any L1TP scenes that do … c2 global l1 landsat lm1 mss -
USGS Landsat 2 MSS Collection 2 Tier 1 Raw Scenes

Landsat 2 MSS Collection 2 Tier 1 DN values, representing scaled, calibrated at-sensor radiance. Landsat scenes with the highest available data quality are placed into Tier 1 and are considered suitable for time-series processing analysis. Tier 1 includes Level-1 Precision Terrain (L1TP) processed data that … c2 global l2 landsat lm2 mss -
USGS Landsat 2 MSS Collection 2 Tier 2 Raw Scenes

Landsat 2 MSS Collection 2 Tier 2 DN values, representing scaled, calibrated at-sensor radiance. Scenes not meeting Tier 1 criteria during processing are assigned to Tier 2. This includes Systematic terrain (L1GT) and Systematic (L1GS) processed scenes, as well as any L1TP scenes that do … c2 global l2 landsat lm2 mss -
USGS Landsat 3 MSS Collection 2 Tier 1 Raw Scenes

Landsat 3 MSS Collection 2 Tier 1 DN values, representing scaled, calibrated at-sensor radiance. Landsat scenes with the highest available data quality are placed into Tier 1 and are considered suitable for time-series processing analysis. Tier 1 includes Level-1 Precision Terrain (L1TP) processed data that … c2 global l3 landsat lm3 mss -
USGS Landsat 3 MSS Collection 2 Tier 2 Raw Scenes

Landsat 3 MSS Collection 2 Tier 2 DN values, representing scaled, calibrated at-sensor radiance. Scenes not meeting Tier 1 criteria during processing are assigned to Tier 2. This includes Systematic terrain (L1GT) and Systematic (L1GS) processed scenes, as well as any L1TP scenes that do … c2 global l3 landsat lm3 mss -
USGS Landsat 4 MSS Collection 2 Tier 1 Raw Scenes

Landsat 4 MSS Collection 2 Tier 1 DN values, representing scaled, calibrated at-sensor radiance. Landsat scenes with the highest available data quality are placed into Tier 1 and are considered suitable for time-series processing analysis. Tier 1 includes Level-1 Precision Terrain (L1TP) processed data that … c2 global l4 landsat lm4 mss -
USGS Landsat 4 MSS Collection 2 Tier 2 Raw Scenes

Landsat 4 MSS Collection 2 Tier 2 DN values, representing scaled, calibrated at-sensor radiance. Scenes not meeting Tier 1 criteria during processing are assigned to Tier 2. This includes Systematic terrain (L1GT) and Systematic (L1GS) processed scenes, as well as any L1TP scenes that do … c2 global l4 landsat lm4 mss -
USGS Landsat 5 MSS Collection 2 Tier 1 Raw Scenes

Landsat 5 MSS Collection 2 Tier 1 DN values, representing scaled, calibrated at-sensor radiance. Landsat scenes with the highest available data quality are placed into Tier 1 and are considered suitable for time-series processing analysis. Tier 1 includes Level-1 Precision Terrain (L1TP) processed data that … c2 global l5 landsat lm5 mss -
USGS Landsat 5 MSS Collection 2 Tier 2 Raw Scenes

Landsat 5 MSS Collection 2 Tier 2 DN values, representing scaled, calibrated at-sensor radiance. Scenes not meeting Tier 1 criteria during processing are assigned to Tier 2. This includes Systematic terrain (L1GT) and Systematic (L1GS) processed scenes, as well as any L1TP scenes that do … c2 global l5 landsat lm5 mss -
USGS Landsat 4 TM Collection 2 Tier 1 Raw Scenes

Landsat 4 TM Collection 2 Tier 1 DN values, representing scaled, calibrated at-sensor radiance. Landsat scenes with the highest available data quality are placed into Tier 1 and are considered suitable for time-series processing analysis. Tier 1 includes Level-1 Precision Terrain (L1TP) processed data that … c2 global l4 landsat lt4 radiance -
USGS Landsat 4 Level 2, Collection 2, Tier 1

This dataset contains atmospherically corrected surface reflectance and land surface temperature derived from the data produced by the Landsat TM sensor. These images contain 4 visible and near-infrared (VNIR) bands and 2 short-wave infrared (SWIR) bands processed to orthorectified surface reflectance, and one thermal infrared … cfmask cloud fmask global landsat lasrc -
USGS Landsat 4 TM Collection 2 Tier 1 TOA Reflectance

Landsat 4 TM Collection 2 Tier 1 calibrated top-of-atmosphere (TOA) reflectance. Calibration coefficients are extracted from the image metadata. See Chander et al. (2009) for details on the TOA computation. global landsat toa usgs -
USGS Landsat 4 TM Collection 2 Tier 2 Raw Scenes

Landsat 4 TM Collection 2 Tier 2 DN values, representing scaled, calibrated at-sensor radiance. Scenes not meeting Tier 1 criteria during processing are assigned to Tier 2. This includes Systematic terrain (L1GT) and Systematic (L1GS) processed scenes, as well as any L1TP scenes that do … c2 global l4 landsat lt4 radiance -
USGS Landsat 4 Level 2, Collection 2, Tier 2

This dataset contains atmospherically corrected surface reflectance and land surface temperature derived from the data produced by the Landsat TM sensor. These images contain 4 visible and near-infrared (VNIR) bands and 2 short-wave infrared (SWIR) bands processed to orthorectified surface reflectance, and one thermal infrared … cfmask cloud fmask global landsat lasrc -
USGS Landsat 4 TM Collection 2 Tier 2 TOA Reflectance
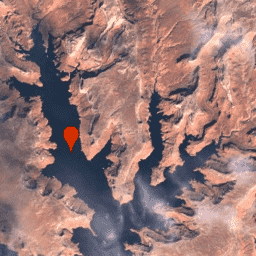
Landsat 4 TM Collection 2 Tier 2 calibrated top-of-atmosphere (TOA) reflectance. Calibration coefficients are extracted from the image metadata. See Chander et al. (2009) for details on the TOA computation. global landsat toa usgs -
USGS Landsat 5 TM Collection 2 Tier 1 Raw Scenes

Landsat 5 TM Collection 2 Tier 1 DN values, representing scaled, calibrated at-sensor radiance. Landsat scenes with the highest available data quality are placed into Tier 1 and are considered suitable for time-series processing analysis. Tier 1 includes Level-1 Precision Terrain (L1TP) processed data that … c2 global l5 landsat lt5 radiance -
USGS Landsat 5 Level 2, Collection 2, Tier 1

This dataset contains atmospherically corrected surface reflectance and land surface temperature derived from the data produced by the Landsat TM sensor. These images contain 4 visible and near-infrared (VNIR) bands and 2 short-wave infrared (SWIR) bands processed to orthorectified surface reflectance, and one thermal infrared … cfmask cloud fmask global landsat lasrc -
USGS Landsat 5 TM Collection 2 Tier 1 TOA Reflectance

Landsat 5 TM Collection 2 Tier 1 calibrated top-of-atmosphere (TOA) reflectance. Calibration coefficients are extracted from the image metadata. See Chander et al. (2009) for details on the TOA computation. global landsat toa usgs -
USGS Landsat 5 TM Collection 2 Tier 2 Raw Scenes

Landsat 5 TM Collection 2 Tier 2 DN values, representing scaled, calibrated at-sensor radiance. Scenes not meeting Tier 1 criteria during processing are assigned to Tier 2. This includes Systematic terrain (L1GT) and Systematic (L1GS) processed scenes, as well as any L1TP scenes that do … c2 global l5 landsat lt5 radiance -
USGS Landsat 5 Level 2, Collection 2, Tier 2

This dataset contains atmospherically corrected surface reflectance and land surface temperature derived from the data produced by the Landsat TM sensor. These images contain 4 visible and near-infrared (VNIR) bands and 2 short-wave infrared (SWIR) bands processed to orthorectified surface reflectance, and one thermal infrared … cfmask cloud fmask global landsat lasrc -
USGS Landsat 5 TM Collection 2 Tier 2 TOA Reflectance

Landsat 5 TM Collection 2 Tier 2 calibrated top-of-atmosphere (TOA) reflectance. Calibration coefficients are extracted from the image metadata. See Chander et al. (2009) for details on the TOA computation. global landsat toa usgs -
Global Mangrove Forests Distribution, v1 (2000)
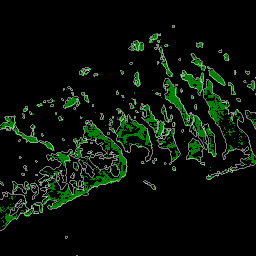
The database was prepared using Landsat satellite data from the year 2000. More than 1,000 Landsat scenes obtained from the USGS Earth Resources Observation and Science Center (EROS) were classified using hybrid supervised and unsupervised digital image classification techniques. This database is the first, most … annual ciesin global landsat-derived mangrove nasa -
GEDI L2A Vector Canopy Top Height (Version 2)
GEDI's Level 2A Geolocated Elevation and Height Metrics Product (GEDI02_A) is primarily composed of 100 Relative Height (RH) metrics, which collectively describe the waveform collected by GEDI. The original GEDI02_A product is a table of point with a spatial resolution (average footprint) of 25 meters. … elevation gedi larse nasa tree-cover usgs -
GEDI L2A table index

This is a feature collection created from the geometries of L2A tables in LARSE/GEDI/GEDI02_A_002. Each feature is a polygon footprint of a source table with its asset id and start/end timestamps. Please see User Guide for more information. The Global Ecosystem Dynamics Investigation GEDI mission … elevation gedi larse nasa tree-cover usgs -
GEDI L2A Raster Canopy Top Height (Version 2)
GEDI's Level 2A Geolocated Elevation and Height Metrics Product (GEDI02_A) is primarily composed of 100 Relative Height (RH) metrics, which collectively describe the waveform collected by GEDI. The original GEDI02_A product is a table of point with a spatial resolution (average footprint) of 25 meters. … elevation gedi larse nasa tree-cover usgs -
GEDI L2B Vector Canopy Cover Vertical Profile Metrics (Version 2)
GEDI Level 2B Canopy Cover and Vertical Profile Metrics product (GEDI02_B) extracts biophysical metrics from each GEDI waveform. These metrics are based on the directional gap probability profile derived from the L1B waveform. The vertical step between foliage profile measurements (known as dZ in GEDI … elevation gedi larse nasa tree-cover usgs -
GEDI L2B table index
This is a feature collection created from the geometries of L2B tables in LARSE/GEDI/GEDI02_B_002. Each feature is a polygon footprint of a source table with its asset id and start/end timestamps. Please see User Guide for more information. The Global Ecosystem Dynamics Investigation GEDI mission … elevation gedi larse nasa tree-cover usgs -
GEDI L2B Raster Canopy Cover Vertical Profile Metrics (Version 2)
GEDI Level 2B Canopy Cover and Vertical Profile Metrics product (GEDI02_B) extracts biophysical metrics from each GEDI waveform. These metrics are based on the directional gap probability profile derived from the L1B waveform. The vertical step between foliage profile measurements (known as dZ in GEDI … elevation gedi larse nasa tree-cover usgs -
GEDI L4A Aboveground Biomass Density, Version 2.1

This dataset contains Global Ecosystem Dynamics Investigation (GEDI) Level 4A (L4A) Version 2 predictions of the aboveground biomass density (AGBD; in Mg/ha) and estimates of the prediction standard error within each sampled geolocated laser footprint. In this version, the granules are in sub-orbits. Height metrics … elevation gedi larse nasa tree-cover usgs -
GEDI L4A table index

This is a feature collection created from the geometries of L4A tables in LARSE/GEDI/GEDI04_A_002. Each feature is a polygon footprint of a source table with its asset id and start/end timestamps. Please see User Guide for more information. The Global Ecosystem Dynamics Investigation GEDI mission … elevation gedi larse nasa tree-cover usgs -
GEDI L4A Raster Aboveground Biomass Density, Version 2.1

This dataset contains Global Ecosystem Dynamics Investigation (GEDI) Level 4A (L4A) Version 2 predictions of the aboveground biomass density (AGBD; in Mg/ha) and estimates of the prediction standard error within each sampled geolocated laser footprint. In this version, the granules are in sub-orbits. Height metrics … elevation gedi larse nasa tree-cover usgs -
GEDI L4B Gridded Aboveground Biomass Density (Version 2)
This Global Ecosystem Dynamics Investigation (GEDI) L4B product provides 1 km x 1 km estimates of mean aboveground biomass density (AGBD) based on observations from mission week 19 starting on 2019-04-18 to mission week 138 ending on 2021-08-04. The GEDI L4A Footprint Biomass product converts … elevation gedi larse nasa tree-cover usgs -
Latvia Color InfraRed (CIR) orthophotos
In Latvia, orthophoto maps are prepared in the Latvian coordinate system LKS-92 TM according to the TKS-93 map sheet division (scale 1:10000 map sheet corresponds to 5 x 5 kilometers in nature). Orthophoto maps are prepared for the whole territory of Latvia at the scale … latvia nrg orthophoto -
Latvia RGB orthophotos
In Latvia, orthophoto maps are prepared in the Latvian coordinate system LKS-92 TM according to the TKS-93 map sheet division (scale 1:10000 map sheet corresponds to 5 x 5 kilometers in nature). Orthophoto maps are prepared for the whole territory of Latvia at the scale … latvia orthophoto rgb -
MERIT DEM: Multi-Error-Removed Improved-Terrain DEM
MERIT DEM a high accuracy global DEM at 3 arc second resolution (~90 m at the equator) produced by eliminating major error components from existing DEMs (NASA SRTM3 DEM, JAXA AW3D DEM, Viewfinder Panoramas DEM). MERIT DEM separates absolute bias, stripe noise, speckle noise and … dem elevation merit topography -
MERIT Hydro: Global Hydrography Datasets
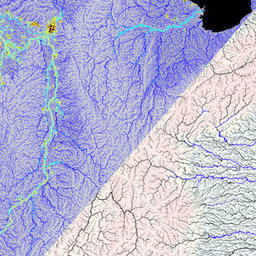
MERIT Hydro is a new global flow direction map at 3 arc-second resolution (~90 m at the equator) derived from the version 1.0.3 of the MERIT DEM elevation data and water body datasets (G1WBM, GSWO and OpenStreetMap). MERIT Hydro contains the output of a new … dem elevation flow-direction hand hydrography hydrosheds -
MERIT Hydro: Supplementary Visualization Layers

Supplementary visualization layers for MERIT Hydro dem elevation flow-direction hand hydrography hydrosheds -
MOD44B.006 Terra Vegetation Continuous Fields Yearly Global 250m
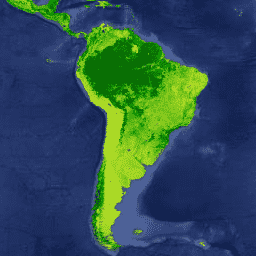
The Terra MODIS Vegetation Continuous Fields (VCF) product is a sub-pixel-level representation of surface vegetation cover estimates globally. Designed to continuously represent Earth's terrestrial surface as a proportion of basic vegetation traits, it provides a gradation of three surface cover components: percent tree cover, percent … annual geophysical global modis nasa terra -
MOD44W.006 Terra Land Water Mask Derived From MODIS and SRTM Yearly Global 250m
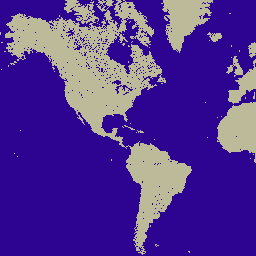
The MOD44W V6 land/water mask 250m product is derived using a decision tree classifier trained with MODIS data and validated with the MOD44W V5 product. A series of masks are applied to address known issues caused by terrain shadow, burn scars, cloudiness, or ice cover … geophysical mod44w modis nasa srtm usgs -
MODOCGA.006 Terra Ocean Reflectance Daily Global 1km

The MODOCGA V6 ocean reflectance product consists of 1 kilometer reflectance data from Terra MODIS bands 8-16. The product is referred to as ocean reflectance, because bands 8-16 are used primarily to produce ocean products, but this is not an ocean product as the tiles … daily global modis nasa ocean reflectance -
MYDOCGA.006 Aqua Ocean Reflectance Daily Global 1km
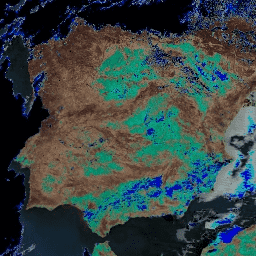
The MYDOCGA V6 ocean reflectance product consists of 1 kilometer reflectance data from Aqua MODIS bands 8-16. The product is referred to as ocean reflectance, because bands 8-16 are used primarily to produce ocean products, but this is not an ocean product as the tiles … aqua daily global modis nasa ocean -
MCD12C1.061 MODIS Land Cover Type Yearly Global 0.05 Deg CMG
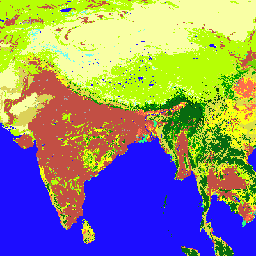
The Terra and Aqua combined Moderate Resolution Imaging Spectroradiometer (MODIS) Land Cover Climate Modeling Grid (CMG) (MCD12C1) Version 6.1 data product provides a spatially aggregated and reprojected version of the tiled MCD12Q1 Version 6.1 data product. Maps of the International Geosphere-Biosphere Programme (IGBP), University of … landcover modis nasa usgs yearly -
MCD12Q1.061 MODIS Land Cover Type Yearly Global 500m
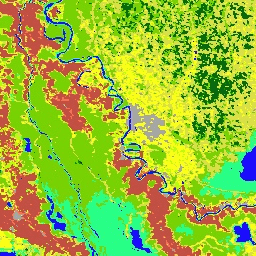
The Terra and Aqua combined Moderate Resolution Imaging Spectroradiometer (MODIS) Land Cover Type (MCD12Q1) Version 6.1 data product provides global land cover types at yearly intervals. The MCD12Q1 Version 6.1 data product is derived using supervised classifications of MODIS Terra and Aqua reflectance data. Land … landcover modis nasa usgs yearly -
MCD12Q2.006 Land Cover Dynamics Yearly Global 500m
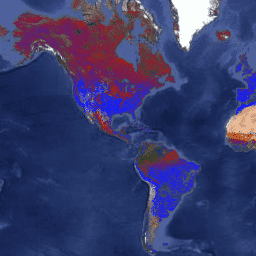
The Terra and Aqua combined Moderate Resolution Imaging Spectroradiometer (MODIS) Land Cover Dynamics (MCD12Q2) Version 6.1 data product provides global land surface phenology metrics at yearly intervals. The MCD12Q2 Version 6.1 data product is derived from time series of the 2-band Enhanced Vegetation Index (EVI2) … evi global modis onset-greenness phenology usgs -
MCD15A3H.061 MODIS Leaf Area Index/FPAR 4-Day Global 500m
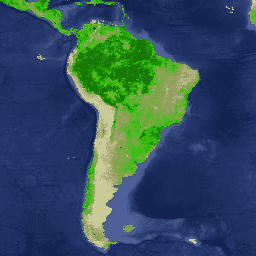
The MCD15A3H Version 6.1 Moderate Resolution Imaging Spectroradiometer (MODIS) Level 4, Combined Fraction of Photosynthetically Active Radiation (FPAR), and Leaf Area Index (LAI) product is a 4-day composite data set with 500 meter pixel size. The algorithm chooses the best pixel available from all the … fpar global lai modis nasa usgs -
MCD18A1.061 Surface Radiation Daily/3-Hour
The MCD18A1 Version 6.1 is a Moderate Resolution Imaging Spectroradiometer (MODIS) Terra and Aqua combined Downward Shortwave Radiation (DSR) gridded Level 3 product produced daily at 1 kilometer pixel resolution with estimates of DSR every 3 hours. DSR is incident solar radiation over land surfaces … par radiation -
MCD18C2.061 Photosynthetically Active Radiation Daily 3-Hour
The MCD18C2 Version 6.1 is a Moderate Resolution Imaging Spectroradiometer (MODIS) Terra and Aqua combined Photosynthetically Active Radiation (PAR) gridded Level 3 product produced daily at 0.05 degree (5,600 meters at the equator) resolution with estimates of PAR every 3 hours. PAR is incident solar … par radiation -
MCD19A1.061: Land Surface BRF Daily L2G Global 500m and 1km
The MCD19A1 Version 6.1 data product is a Moderate Resolution Imaging Spectroradiometer (MODIS) Terra and Aqua combined Land Surface Bidirectional Reflectance Factor (BRF) gridded Level 2 product produced daily at 500 meter and 1 kilometer resolution. For more information see the MAIAC user guide. aerosol aod aqua daily global maiac -
MCD19A2.061: Terra & Aqua MAIAC Land Aerosol Optical Depth Daily 1km
The MCD19A2 V6.1 data product is a MODIS Terra and Aqua combined Multi-angle Implementation of Atmospheric Correction (MAIAC) Land Aerosol Optical Depth (AOD) gridded Level 2 product produced daily at 1 km resolution. For more information see the MAIAC user guide. NOTE: This product has … aerosol aod aqua daily global maiac -
MCD43A1.061 MODIS BRDF-Albedo Model Parameters Daily 500m
The MCD43A1 V6.1 Bidirectional Reflectance Distribution Function and Albedo (BRDF/Albedo) Model Parameters dataset is a 500 meter daily 16-day product. The Julian date represents the 9th day of the 16-day retrieval period, and consequently the observations are weighted to estimate the BRDF/Albedo for that day. … albedo brdf daily global modis nasa -
MCD43A2.061 MODIS BRDF-Albedo Quality Daily 500m
The MCD43A2 V6.1 Bidirectional Reflectance Distribution Function and Albedo (BRDF/Albedo) Quality dataset is a 500 meter daily 16-day product. It contains all the quality information for the corresponding 16-day MCD43A3 Albedo and the MCD43A4 Nadir-BRDF (NBAR) products. The MCD43A2 contains individual band quality and observation … albedo brdf daily global modis nasa -
MCD43A3.061 MODIS Albedo Daily 500m
The MCD43A3 V6.1 Albedo Model dataset is a daily 16-day product. It provides both directional hemispherical reflectance (black sky albedo) and bihemispherical reflectance (white sky albedo) for each of the MODIS surface reflectance bands (band 1 through band 7) as well as 3 broad spectrum … albedo black-sky daily global modis nasa -
MCD43A4.061 MODIS Nadir BRDF-Adjusted Reflectance Daily 500m
The MCD43A4 V6.1 Nadir Bidirectional Reflectance Distribution Function Adjusted Reflectance (NBAR) product provides 500 meter reflectance data of the MODIS "land" bands 1-7. These are adjusted using a bidirectional reflectance distribution function to model the values as if they were collected from a nadir view. … albedo brdf daily global modis nasa -
MCD43C3.061 BRDF/Albedo Daily L3 0.05 Deg CMG
The MCD43C3 Version 6.1 Bidirectional Reflectance Distribution Function and Albedo (BRDF/Albedo) Albedo dataset is produced daily using 16 days of Terra and Aqua MODIS data in a 0.05 degree (5,600 meters at the equator) Climate Modeling Grid (CMG). Data are temporally weighted to the ninth … albedo black-sky brdf daily global modis -
MCD64A1.061 MODIS Burned Area Monthly Global 500m
The Terra and Aqua combined MCD64A1 Version 6.1 Burned Area data product is a monthly, global gridded 500m product containing per-pixel burned-area and quality information. The MCD64A1 burned-area mapping approach employs 500m MODIS Surface Reflectance imagery coupled with 1km MODIS active fire observations. The algorithm … burn change-detection fire geophysical global mcd64a1 -
MOD08_M3.061 Terra Atmosphere Monthly Global Product
MOD08_M3 V6.1 is an atmosphere global product that contains monthly 1 x 1 degree grid average values of atmospheric parameters. These parameters are related to atmospheric aerosol particle properties, total ozone burden, atmospheric water vapor, cloud optical and physical properties, and atmospheric stability indices. The … atmosphere geophysical global modis monthly nasa -
MOD09A1.061 Terra Surface Reflectance 8-Day Global 500m

The MOD09A1 V6.1 product provides an estimate of the surface spectral reflectance of Terra MODIS bands 1-7 at 500m resolution and corrected for atmospheric conditions such as gasses, aerosols, and Rayleigh scattering. Along with the seven reflectance bands is a quality layer and four observation … 8-day global modis nasa sr surface-reflectance -
MOD09CMG.061 Surface Reflectance Daily L3 Global 0.05 Deg CMG
The MOD09CMG Version 6.1 product provides an estimate of the surface spectral reflectance of Terra Moderate Resolution Imaging Spectroradiometer (MODIS) Bands 1 through 7, resampled to 5600 meter pixel resolution and corrected for atmospheric conditions such as gasses, aerosols, and Rayleigh scattering. The MOD09CMG data … ozone surface-reflectance terra -
MOD09GA.061 Terra Surface Reflectance Daily Global 1km and 500m

The MODIS Surface Reflectance products provide an estimate of the surface spectral reflectance as it would be measured at ground level in the absence of atmospheric scattering or absorption. Low-level data are corrected for atmospheric gases and aerosols. MOD09GA version 6.1 provides bands 1-7 in … daily global modis nasa sr surface-reflectance -
MOD09GQ.061 Terra Surface Reflectance Daily Global 250m

The MODIS Surface Reflectance products provide an estimate of the surface spectral reflectance as it would be measured at ground level in the absence of atmospheric scattering or absorption. Low-level data are corrected for atmospheric gases and aerosols. MOD09GQ version 6.1 provides bands 1 and … daily global modis nasa sr surface-reflectance -
MOD09Q1.061 Terra Surface Reflectance 8-Day Global 250m

The MOD09Q1 product provides an estimate of the surface spectral reflectance of bands 1 and 2 at 250m resolution and corrected for atmospheric conditions such as gasses, aerosols, and Rayleigh scattering. Along with the two reflectance bands, a quality layer is also included. For each … 8-day global mod09q1 modis nasa sr -
MOD10A1.061 Terra Snow Cover Daily Global 500m

The MOD10A1 V6.1 Snow Cover Daily Global 500m product contains snow cover, snow albedo, fractional snow cover, and quality assessment (QA) data. Snow cover data are based on a snow mapping algorithm that employs a Normalized Difference Snow Index (NDSI) and other criteria tests. General … albedo daily geophysical global modis nasa -
MOD11A1.061 Terra Land Surface Temperature and Emissivity Daily Global 1km

The MOD11A1 V6.1 product provides daily land surface temperature (LST) and emissivity values in a 1200 x 1200 kilometer grid. The temperature value is derived from the MOD11_L2 swath product. Above 30 degrees latitude, some pixels may have multiple observations where the criteria for clear-sky … daily emissivity global lst modis nasa -
MOD11A2.061 Terra Land Surface Temperature and Emissivity 8-Day Global 1km
The MOD11A2 V6.1 product provides an average 8-day land surface temperature (LST) in a 1200 x 1200 kilometer grid. Each pixel value in MOD11A2 is a simple average of all the corresponding MOD11A1 LST pixels collected within that 8 day period. The MOD11A2 does a … 8-day emissivity global lst mod11a2 modis -
MOD13A1.061 Terra Vegetation Indices 16-Day Global 500m

The MOD13A1 V6.1 product provides a Vegetation Index (VI) value at a per pixel basis. There are two primary vegetation layers. The first is the Normalized Difference Vegetation Index (NDVI) which is referred to as the continuity index to the existing National Oceanic and Atmospheric … 16-day evi global modis nasa ndvi -
MOD13A2.061 Terra Vegetation Indices 16-Day Global 1km

The MOD13A2 V6.1 product provides two Vegetation Indices (VI): the Normalized Difference Vegetation Index (NDVI) and the Enhanced Vegetation Index (EVI). The NDVI is referred to as the continuity index to the existing National Oceanic and Atmospheric Administration-Advanced Very High Resolution Radiometer (NOAA-AVHRR) derived NDVI. … 16-day evi global modis nasa ndvi -
MOD13A3.061 Vegetation Indices Monthly L3 Global 1 km SIN Grid
The MOD13A3 V6.1 product data is provided monthly at 1 kilometer (km) spatial resolution. In generating this monthly product, the algorithm ingests all the MOD13A2 products that overlap the month and employs a weighted temporal average. Vegetation indices are used for global monitoring of vegetation … evi global modis monthly nasa ndvi -
MOD13C1.061: Terra Vegetation Indices 16-Day L3 Global 0.05 Deg Climate Modeling Grid
The Terra Moderate Resolution Imaging Spectroradiometer (MODIS) Vegetation Indices 16-Day (MOD13C1) Version 6.1 product provides a Vegetation Index (VI) value at a per pixel basis. There are two primary vegetation layers. The first is the Normalized Difference Vegetation Index (NDVI), which maintains continuity with the … 16-day global nasa terra usgs vegetation -
MOD13Q1.061 Terra Vegetation Indices 16-Day Global 250m

The MOD13Q1 V6.1 product provides a Vegetation Index (VI) value at a per pixel basis. There are two primary vegetation layers. The first is the Normalized Difference Vegetation Index (NDVI) which is referred to as the continuity index to the existing National Oceanic and Atmospheric … 16-day evi global modis nasa ndvi -
MOD14A1.061: Terra Thermal Anomalies & Fire Daily Global 1km

The MOD14A1 V6.1 dataset provides daily fire mask composites at 1km resolution derived from the MODIS 4- and 11-micrometer radiances. The fire detection strategy is based on absolute detection of a fire (when the fire strength is sufficient to detect), and on detection relative to … daily fire global modis nasa terra -
MOD14A2.061: Terra Thermal Anomalies & Fire 8-Day Global 1km
The MOD14A2 V6.1 dataset provides 8-day fire mask composites at 1km resolution. It contains the maximum value of the individual pixel classes over the compositing period. Along with the fire mask, an associated quality information layer is also provided. Documentation: User's Guide Algorithm Theoretical Basis … 8-day fire global modis nasa terra -
MOD15A2H.061: Terra Leaf Area Index/FPAR 8-Day Global 500m
The MOD15A2H V6.1 MODIS combined Leaf Area Index (LAI) and Fraction of Photosynthetically Active Radiation (FPAR) product is an 8-day composite dataset at 500m resolution. The algorithm chooses the "best" pixel available from all the acquisitions of the Terra sensor from within the 8-day period. … 8-day fpar global lai modis nasa -
MOD16A2.061: Terra Net Evapotranspiration 8-Day Global 500m
The MOD16A2 Version 6.1 Evapotranspiration/Latent Heat Flux product is an 8-day composite product produced at 500 meter pixel resolution. The algorithm used for the MOD16 data product collection is based on the logic of the Penman-Monteith equation, which includes inputs of daily meteorological reanalysis data … 8-day evapotranspiration global mod16a2 modis nasa -
MOD16A2GF.061: Terra Net Evapotranspiration Gap-Filled 8-Day Global 500m
The Terra Moderate Resolution Imaging Spectroradiometer (MODIS) MOD16A2GF Version 6.1 Evapotranspiration/Latent Heat Flux (ET/LE) product is a year-end gap-filled 8-day composite dataset produced at 500 meter (m) pixel resolution. The algorithm used for the MOD16 data product collection is based on the logic of the … 8-day evapotranspiration global modis nasa -
MOD17A2H.061: Terra Gross Primary Productivity 8-Day Global 500m

The MOD17A2H V6.1 Gross Primary Productivity (GPP) product is a cumulative 8-day composite with a 500m pixel size. The product is based on the radiation-use efficiency concept and can be potentially used as inputs to data models to calculate terrestrial energy, carbon, water cycle processes, … 8-day global gpp modis nasa photosynthesis -
MOD17A3HGF.061: Terra Net Primary Production Gap-Filled Yearly Global 500m

The MOD17A3HGF V6.1 product provides information about annual Gross and Net Primary Productivity (GPP and NPP) at 500m pixel resolution. Annual NPP is derived from the sum of all 8-day Net Photosynthesis(PSN) products (MOD17A2H) from the given year. The PSN value is the difference of … global gpp nasa npp photosynthesis productivity -
MOD21A1D.061 Terra Land Surface Temperature and 3-Band Emissivity Daily Global 1km

The MOD21A1D dataset is produced daily from daytime Level 2 Gridded (L2G) intermediate LST products at a spatial resolution of 1,000 meters. The L2G process maps the daily MOD21 swath granules onto a sinusoidal MODIS grid and stores all observations falling over a gridded cell … daily emissivity global lst nasa surface-temperature -
MOD21A1N.061 Terra Land Surface Temperature and 3-Band Emissivity Daily Global 1km

The MOD21A1N dataset is produced daily from nighttime Level 2 Gridded (L2G) intermediate LST products at a spatial resolution of 1,000 meters. The L2G process maps the daily MOD21 swath granules onto a sinusoidal MODIS grid and stores all observations falling over a gridded cell … daily emissivity global lst nasa surface-temperature -
MOD21C1.061 Terra Land Surface Temperature and 3-Band Emissivity Daily L3 Global 0.05 Deg CMG

The MOD21C1 dataset is produced daily in a 0.05 degree (5,600 meters at the equator) Climate Modeling Grid (CMG) from daytime Level 2 Gridded (L2G) intermediate LST products. The L2G process maps the daily MOD21 swath granules onto a sinusoidal MODIS grid and stores all … daily emissivity global lst nasa surface-temperature -
MOD21C2.061 Terra Land Surface Temperature and 3-Band Emissivity 8-Day L3 Global 0.05 Deg CMG

The MOD21C2 dataset is an 8-day composite LST product that uses an algorithm based on a simple averaging method. The algorithm calculates the average from all the cloud free MOD21A1D and MOD21A1N daily acquisitions from the 8-day period. Unlike the MOD21A1 data sets where the … emissivity global lst nasa surface-temperature terra -
MOD21C3.061 Terra Land Surface Temperature and 3-Band Emissivity Monthly L3 Global 0.05 Deg CMG
The MOD21C3 dataset is a monthly composite LST product that uses an algorithm based on a simple averaging method. The algorithm calculates the average from all the cloud free MOD21A1D and MOD21A1N daily acquisitions from the 8-day period. Unlike the MOD21A1 data sets where the … emissivity global lst monthly nasa surface-temperature -
MYD08_M3.061 Aqua Atmosphere Monthly Global Product

MYD08_M3 V6.1 is an atmosphere global product that contains monthly 1 x 1 degree grid average values of atmospheric parameters. These parameters are related to atmospheric aerosol particle properties, total ozone burden, atmospheric water vapor, cloud optical and physical properties, and atmospheric stability indices. The … aqua atmosphere geophysical global modis monthly -
MYD09A1.061 Aqua Surface Reflectance 8-Day Global 500m
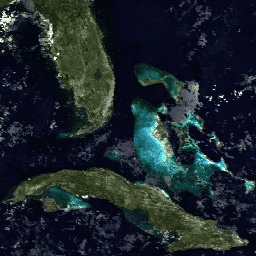
The MYD09A1 V6.1 product provides an estimate of the surface spectral reflectance of Aqua MODIS bands 1-7 at 500m resolution and corrected for atmospheric conditions such as gasses, aerosols, and Rayleigh scattering. Along with the seven reflectance bands is a quality layer and four observation … 8-day aqua global modis nasa sr -
MYD09GA.061 Aqua Surface Reflectance Daily Global 1km and 500m
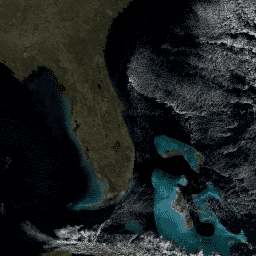
The MODIS Surface Reflectance products provide an estimate of the surface spectral reflectance as it would be measured at ground level in the absence of atmospheric scattering or absorption. Low-level data are corrected for atmospheric gases and aerosols. MYD09GA version 6.1 provides bands 1-7 in … aqua daily global modis nasa sr -
MYD09GQ.061 Aqua Surface Reflectance Daily Global 250m
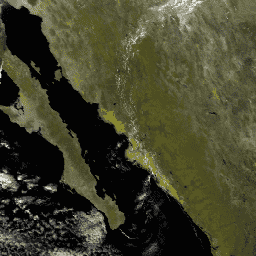
The MODIS Surface Reflectance products provide an estimate of the surface spectral reflectance as it would be measured at ground level in the absence of atmospheric scattering or absorption. Low-level data are corrected for atmospheric gases and aerosols. MYD09GQ version 6.1 provides bands 1 and … aqua daily global modis nasa sr -
MYD09Q1.061 Aqua Surface Reflectance 8-Day Global 250m
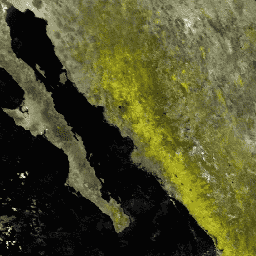
The MYD09Q1 product provides an estimate of the surface spectral reflectance of bands 1 and 2 at 250m resolution and corrected for atmospheric conditions such as gasses, aerosols, and Rayleigh scattering. Along with the two reflectance bands, a quality layer is also included. For each … 8-day aqua global modis nasa sr -
MYD10A1.061 Aqua Snow Cover Daily Global 500m
The MYD10A1 V6 Snow Cover Daily Global 500m product contains snow cover, snow albedo, fractional snow cover, and quality assessment (QA) data. Snow cover data are based on a snow mapping algorithm that employs a Normalized Difference Snow Index (NDSI) and other criteria tests. General … albedo aqua daily geophysical global modis -
MYD11A1.061 Aqua Land Surface Temperature and Emissivity Daily Global 1km

The MYD11A1 V6.1 product provides daily land surface temperature (LST) and emissivity values in a 1200 x 1200 kilometer grid. The temperature value is derived from the MYD11_L2 swath product. Above 30 degrees latitude, some pixels may have multiple observations where the criteria for clear-sky … aqua daily emissivity global lst modis -
MYD11A2.061 Aqua Land Surface Temperature and Emissivity 8-Day Global 1km

The MYD11A2 V6.1 product provides an average 8-day land surface temperature (LST) in a 1200 x 1200 kilometer grid. Each pixel value in MYD11A2 is a simple average of all the corresponding MYD11A1 LST pixels collected within that 8 day period. The MYD11A2 does a … 8-day aqua emissivity global lst modis -
MYD13A1.061 Aqua Vegetation Indices 16-Day Global 500m
The MYD13A1 V6.1 product provides a Vegetation Index (VI) value at a per pixel basis. There are two primary vegetation layers. The first is the Normalized Difference Vegetation Index (NDVI) which is referred to as the continuity index to the existing National Oceanic and Atmospheric … 16-day aqua evi global modis nasa -
MYD13A2.061 Aqua Vegetation Indices 16-Day Global 1km
The MYD13A2 V6.1 product provides two Vegetation Indices (VI): the Normalized Difference Vegetation Index (NDVI) and the Enhanced Vegetation Index (EVI). The NDVI is referred to as the continuity index to the existing National Oceanic and Atmospheric Administration-Advanced Very High Resolution Radiometer (NOAA-AVHRR) derived NDVI. … 16-day aqua evi global modis nasa -
MYD13A3.061 Aqua Vegetation Indices Monthly L3 Global 1 km SIN Grid
The Aqua Moderate Resolution Imaging Spectroradiometer (MODIS) Vegetation Indices (MYD13A3) Version 6.1 data are provided monthly at 1 kilometer (km) spatial resolution as a gridded Level 3 product in the sinusoidal projection. In generating this monthly product, the algorithm ingests all the MYD13A2 products that … aqua evi global modis monthly nasa -
MYD13C1.061: Aqua Vegetation Indices 16-Day L3 Global 0.05 Deg CMG
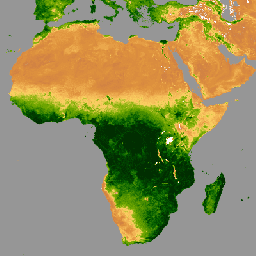
The Aqua Moderate Resolution Imaging Spectroradiometer (MODIS) Vegetation Indices 16-Day (MYD13C1) Version 6.1 product provides a Vegetation Index (VI) value at a per pixel basis. There are two primary vegetation layers. The first is the Normalized Difference Vegetation Index (NDVI), which maintains continuity with the … 16-day aqua global nasa usgs vegetation -
MYD13Q1.061 Aqua Vegetation Indices 16-Day Global 250m
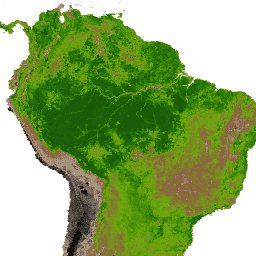
The MYD13Q1 V6.1 product provides a Vegetation Index (VI) value at a per pixel basis. There are two primary vegetation layers. The first is the Normalized Difference Vegetation Index (NDVI) which is referred to as the continuity index to the existing National Oceanic and Atmospheric … 16-day aqua evi global modis nasa -
MYD14A1.061: Aqua Thermal Anomalies & Fire Daily Global 1km
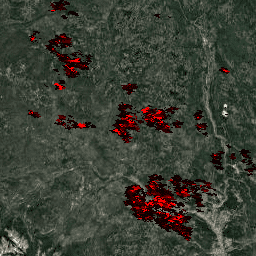
The MYD14A1 V6.1 dataset provides daily fire mask composites at 1km resolution derived from the MODIS 4- and 11-micrometer radiances. The fire detection strategy is based on absolute detection of a fire (when the fire strength is sufficient to detect), and on detection relative to … aqua daily fire global modis nasa -
MYD14A2.061: Aqua Thermal Anomalies & Fire 8-Day Global 1km

The MYD14A2 V6.1 dataset provides 8-day fire mask composites at 1km resolution. It contains the maximum value of the individual pixel classes over the compositing period. Along with the fire mask, an associated quality information layer is also provided. Documentation: User's Guide Algorithm Theoretical Basis … 8-day aqua fire global modis nasa -
MYD15A2H.061: Aqua Leaf Area Index/FPAR 8-Day Global 500m
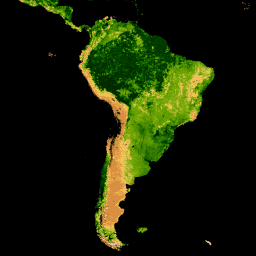
The MYD15A2H V6.1 MODIS combined Leaf Area Index (LAI) and Fraction of Photosynthetically Active Radiation (FPAR) product is an 8-day composite dataset at 500m resolution. The algorithm chooses the "best" pixel available from all the acquisitions of the Aqua sensor from within the 8-day period. … 8-day aqua fpar global lai modis -
MYD17A2H.061: Aqua Gross Primary Productivity 8-Day Global 500m
The MYD17A2H V6.1 Gross Primary Productivity (GPP) product is a cumulative 8-day composite with a 500m resolution. The product is based on the radiation-use efficiency concept and can be potentially used as inputs to data models to calculate terrestrial energy, carbon, water cycle processes, and … 8-day aqua global gpp modis nasa -
MYD17A3HGF.061: Aqua Net Primary Production Gap-Filled Yearly Global 500m
The MYD17A3HGF V6.1 product provides information about annual Gross and Net Primary Productivity (GPP and NPP) at 500m pixel resolution. Annual NPP is derived from the sum of all 8-day Net Photosynthesis(PSN) products (MYD17A2H) from the given year. The PSN value is the difference of … aqua global gpp nasa npp photosynthesis -
MYD21A1D.061 Aqua Land Surface Temperature and 3-Band Emissivity Daily Global 1km

The MYD21A1D dataset is produced daily from daytime Level 2 Gridded (L2G) intermediate LST products at a spatial resolution of 1,000 meters. The L2G process maps the daily MOD21 swath granules onto a sinusoidal MODIS grid and stores all observations falling over a gridded cell … aqua daily emissivity global lst nasa -
MYD21A1N.061 Aqua Land Surface Temperature and 3-Band Emissivity Daily Global 1km

The MYD21A1N dataset is produced daily from nighttime Level 2 Gridded (L2G) intermediate LST products at a spatial resolution of 1,000 meters. The L2G process maps the daily MOD21 swath granules onto a sinusoidal MODIS grid and stores all observations falling over a gridded cell … aqua daily emissivity global lst nasa -
MYD21C1.061 Aqua Land Surface Temperature and 3-Band Emissivity Daily L3 Global 0.05 Deg CMG

The MYD21C1 dataset is produced daily in a 0.05 degree (5,600 meters at the equator) Climate Modeling Grid (CMG) from daytime Level 2 Gridded (L2G) intermediate LST products. The L2G process maps the daily MYD21 swath granules onto a sinusoidal MODIS grid and stores all … aqua daily emissivity global lst nasa -
MYD21C2.061 Aqua Land Surface Temperature and 3-Band Emissivity 8-Day L3 Global 0.05 Deg CMG

The MYD21C2 dataset is an 8-day composite LST product that uses an algorithm based on a simple averaging method. The algorithm calculates the average from all the cloud free MYD21A1D and MYD21A1N daily acquisitions from the 8-day period. Unlike the MYD21A1 data sets where the … aqua emissivity global lst nasa surface-temperature -
MYD21C3.061 Aqua Land Surface Temperature and 3-Band Emissivity Monthly L3 Global 0.05 Deg CMG

The MYD21C3 dataset is a monthly composite LST product that uses an algorithm based on a simple averaging method. The algorithm calculates the average from all the cloud free MYD21A1D and MYD21A1N daily acquisitions from the 8-day period. Unlike the MYD21A1 data sets where the … aqua emissivity global lst monthly nasa -
MOD44W.005 Land Water Mask Derived From MODIS and SRTM
The Global Water Mask uses the SWBD (SRTM Water Body Data) in combination with MODIS 250m data to create a complete global map of surface water at 250m spatial resolution, circa 2000-2002. This dataset is intended for use in processing of raster data and for … geophysical mod44w modis srtm water-mask -
MOD16A2: MODIS Global Terrestrial Evapotranspiration 8-Day Global 1km
The MOD16A2 V105 product provides information about 8-day global terrestrial evapotranspiration at 1km pixel resolution. Evapotranspiration (ET) is the sum of evaporation and plant transpiration from the Earth's surface to the atmosphere. With long-term ET data, the effects of changes in climate, land use, and … 8-day evapotranspiration global mod16a2 modis -
AG100: ASTER Global Emissivity Dataset 100-meter V003
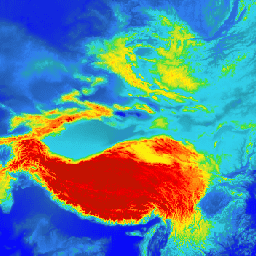
The Advanced Spaceborne Thermal Emission and Reflection Radiometer Global Emissivity Database (ASTER-GED) was developed by the National Aeronautics and Space Administration's (NASA) Jet Propulsion Laboratory (JPL), California Institute of Technology. This product includes the mean emissivity and standard deviation for all 5 ASTER Thermal Infrared … aster elevation emissivity geophysical infrared jpl -
Earth Surface Mineral Dust Source Investigation- Methane Enhancement
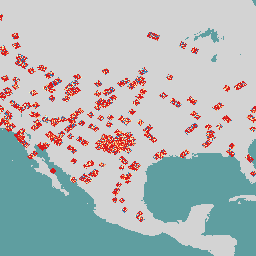
The EMIT Project is part of the Earth Venture-Instrument (EV-I) Program directed by the Program Director of the NASA Earth Science Division (ESD). EMIT is comprised of a VSWIR Infrared Dyson imaging spectrometer adapted for installation on the International Space Station (ISS). EMIT measures radiance … daily emit methane nasa -
Earth Surface Mineral Dust Source Investigation- Methane Plume Complexes
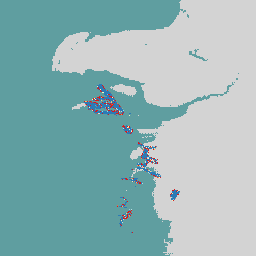
The EMIT Project is part of the Earth Venture-Instrument (EV-I) Program directed by the Program Director of the NASA Earth Science Division (ESD). EMIT is comprised of a VSWIR Infrared Dyson imaging spectrometer adapted for installation on the International Space Station (ISS). EMIT measures radiance … daily emit methane nasa -
FLDAS: Famine Early Warning Systems Network (FEWS NET) Land Data Assimilation System
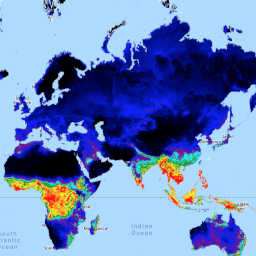
The FLDAS dataset (McNally et al. 2017), was designed to assist with food security assessments in data-sparse, developing country settings. It includes information on many climate-related variables including moisture content, humidity, evapotranspiration, average soil temperature, total precipitation rate, etc. There are multiple different FLDAS datasets; … climate evapotranspiration humidity ldas monthly nasa -
NEX-GDDP-CMIP6: NASA Earth Exchange Global Daily Downscaled Climate Projections
The NEX-GDDP-CMIP6 dataset is comprised of global downscaled climate scenarios derived from the General Circulation Model (GCM) runs conducted under the Coupled Model Intercomparison Project Phase 6 (CMIP6, see Thrasher et al. 2022) and across two of the four "Tier 1" greenhouse gas emissions scenarios … cag climate gddp geophysical nasa nex -
GEOS-CF fcst htf v1: Goddard Earth Observing System Composition Forecast
This dataset contains meteorological forecast (fcst) of high-temporal frequency data (htf). Use the 'creation_time' and 'forecast_time' properties to select data of interest. The Goddard Earth Observing System Composition Forecast (GEOS-CF) system is a high-resolution (0.25°) global constituent prediction system from NASA's Global Modeling and Assimilation … composition forecast geos gmao nasa -
GEOS-CF fcst tavg1hr v1: Goddard Earth Observing System Composition Forecast
This dataset contains meteorological forecast (fcst) of time-averaged frequency data (tavg1hr). Use the 'creation_time' and 'forecast_time' properties to select data of interest. The Goddard Earth Observing System Composition Forecast (GEOS-CF) system is a high-resolution (0.25°) global constituent prediction system from NASA's Global Modeling and Assimilation … composition forecast geos gmao nasa -
GEOS-CF rpl htf v1: Goddard Earth Observing System Composition Forecast
This dataset contains meteorological replay (rpl) of high-temporal frequency data (htf). The Goddard Earth Observing System Composition Forecast (GEOS-CF) system is a high-resolution (0.25°) global constituent prediction system from NASA's Global Modeling and Assimilation Office(GMAO). GEOS-CF offers a new tool for atmospheric chemistry research, with … composition forecast geos gmao nasa -
GEOS-CF rpl tavg1hr v1: Goddard Earth Observing System Composition Forecast
This dataset contains meteorological replay (rpl) of time-average one hour data (tavg1hr). It is built by merging the original GEOS-CF collections chm_tavg_1hr_g1440x721_v1, met_tavg_1hr_g1440x721_x1, and xgc_tavg_1hr_g1440x721_x1. The Goddard Earth Observing System Composition Forecast (GEOS-CF) system is a high-resolution (0.25°) global constituent prediction system from NASA's Global … composition forecast geos gmao nasa -
GIMMS NDVI From AVHRR Sensors (3rd Generation)
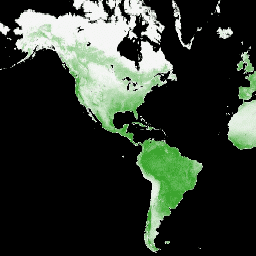
GIMMS NDVI is generated from several NOAA's AVHRR sensors for a global 1/12-degree lat/lon grid. The latest version of the GIMMS NDVI dataset is named NDVI3g (third generation GIMMS NDVI from AVHRR sensors). avhrr nasa ndvi noaa vegetation -
GLDAS-2.1: Global Land Data Assimilation System
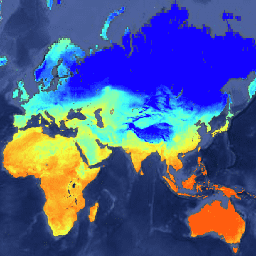
NASA Global Land Data Assimilation System Version 2 (GLDAS-2) has three components: GLDAS-2.0, GLDAS-2.1, and GLDAS-2.2. GLDAS-2.0 is forced entirely with the Princeton meteorological forcing input data and provides a temporally consistent series from 1948 through 2014. GLDAS-2.1 is forced with a combination of model … 3-hourly climate evaporation forcing geophysical gldas -
GLDAS-2.2: Global Land Data Assimilation System

NASA Global Land Data Assimilation System Version 2 (GLDAS-2) has three components: GLDAS-2.0, GLDAS-2.1, and GLDAS-2.2. GLDAS-2.0 is forced entirely with the Princeton meteorological forcing input data and provides a temporally consistent series from 1948 through 2014. GLDAS-2.1 is forced with a combination of model … 3-hourly climate evaporation forcing geophysical gldas -
Reprocessed GLDAS-2.0: Global Land Data Assimilation System

NASA Global Land Data Assimilation System Version 2 (GLDAS-2) has three components: GLDAS-2.0, GLDAS-2.1, and GLDAS-2.2. GLDAS-2.0 is forced entirely with the Princeton meteorological forcing input data and provides a temporally consistent series from 1948 through 2014. GLDAS-2.1 is forced with a combination of model … 3-hourly climate evaporation forcing geophysical gldas -
GPM: Monthly Global Precipitation Measurement (GPM) v6
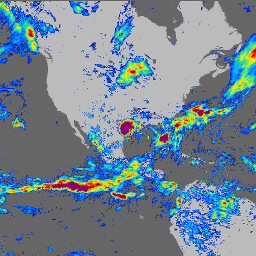
IMERG-Final version "06" stopped being produced in September, 2021. Version "07" is expected to be released in September 2022 Global Precipitation Measurement (GPM) is an international satellite mission to provide next-generation observations of rain and snow worldwide every three hours. The Integrated Multi-satellitE Retrievals for … climate geophysical gpm imerg jaxa monthly -
GPM: Global Precipitation Measurement (GPM) v6

Global Precipitation Measurement (GPM) is an international satellite mission to provide next-generation observations of rain and snow worldwide every three hours. The Integrated Multi-satellitE Retrievals for GPM (IMERG) is the unified algorithm that provides rainfall estimates combining data from all passive-microwave instruments in the GPM … climate geophysical gpm imerg jaxa nasa -
GRACE Monthly Mass Grids - Land
GRACE Tellus Monthly Mass Grids provides monthly gravitational anomalies relative to a 2004-2010 time-mean baseline. The data contained in this dataset are units of "Equivalent Water Thickness" which represent the deviations of mass in terms of vertical extent of water in centimeters. See the provider's … crs gfz grace gravity jpl land -
GRACE Monthly Mass Grids - Global Mascons

GRACE Tellus Monthly Mass Grids provides monthly gravitational anomalies relative to a 2004-2010 time-mean baseline. The data contained in this dataset are units of "Equivalent Water Thickness" which represent the deviations of mass in terms of vertical extent of water in centimeters. See the provider's … grace gravity jpl mascon mass nasa -
GRACE Monthly Mass Grids - Global Mascon (CRI Filtered)
GRACE Tellus Monthly Mass Grids provides monthly gravitational anomalies relative to a 2004-2010 time-mean baseline. The data contained in this dataset are units of "Equivalent Water Thickness" which represent the deviations of mass in terms of vertical extent of water in centimeters. See the provider's … grace gravity jpl mascon mass nasa -
GRACE Monthly Mass Grids - Ocean

GRACE Tellus Monthly Mass Grids provides monthly gravitational anomalies relative to a 2004-2010 time-mean baseline. The data contained in this dataset are units of "Equivalent Water Thickness" which represent the deviations of mass in terms of vertical extent of water in centimeters. See the provider's … crs gfz grace gravity jpl mass -
GRACE Monthly Mass Grids - Ocean EOFR
GRACE Tellus Monthly Mass Grids provides monthly gravitational anomalies relative to a 2004-2010 time-mean baseline. The data contained in this dataset are units of "Equivalent Water Thickness" which represent the deviations of mass in terms of vertical extent of water in centimeters. See the provider's … crs gfz grace gravity jpl mass -
GRACE Monthly Mass Grids Release 06 Version 04 - Land
The monthly land mass grids contain water mass anomalies given as equivalent water thickness derived from GRACE & GRACE-FO time-variable gravity observations during the specified timespan, and relative to the specified time-mean reference period. The equivalent water thickness represents the total terrestrial water storage anomalies … crs gfz grace gravity jpl land -
MERRA-2 M2T1NXAER: Aerosol Diagnostics V5.12.4
M2T1NXAER (or tavg1_2d_aer_Nx) is an hourly time-averaged 2-dimensional data collection in Modern-Era Retrospective analysis for Research and Applications version 2 (MERRA-2). This collection consists of assimilated aerosol diagnostics, such as column mass density of aerosol components (black carbon, dust, sea-salt, sulfate, and organic carbon), surface … aerosol carbon dust mass merra nasa -
MERRA-2 M2I3NVAER: Aerosol Mixing Ratio V5.12.4
M2I3NVAER (or inst3_3d_aer_Nv) is an instantaneous 3-dimensional 3-hourly data collection in Modern-Era Retrospective analysis for Research and Applications version 2 (MERRA-2). This collection consists of assimilations of aerosol mixing ratio parameters at 72 model layers, such as dust, sulphur dioxide, sea salt, black carbon, and … aerosol dust mass merra nasa sea-salt -
MERRA-2 M2T1NXFLX: Surface Flux Diagnostics V5.12.4
M2T1NXFLX (or tavg1_2d_flx_Nx) is an hourly time-averaged data collection in Modern-Era Retrospective analysis for Research and Applications version 2 (MERRA-2). This collection consists of assimilated surface flux diagnostics, such as total precipitation, bias corrected total precipitation, surface air temperature, surface specific humidity, surface wind speed, … merra sea-salt so2 so4 soil-moisture -
MERRA-2 M2T1NXLND: Land Surface Diagnostics V5.12.4
M2T1NXLND (or tavg1_2d_lnd_Nx) is an hourly time-averaged data collection in Modern-Era Retrospective analysis for Research and Applications version 2 (MERRA-2). This collection consists of land surface diagnostics, such a baseflow flux, runoff, surface soil wetness, root zone soil wetness, water at surface layer, water at … evaporation ice merra temperature -
MERRA-2 M2T1NXRAD: Radiation Diagnostics V5.12.4
M2T1NXRAD (or tavg1_2d_rad_Nx) is an hourly time-averaged data collection in Modern-Era Retrospective analysis for Research and Applications version 2 (MERRA-2). This collection consists of radiation diagnostics, such as surface albedo, cloud area fraction, in cloud optical thickness, surface incoming shortwave flux (i.e. solar radiation), surface … albedo emissivity merra shortwave temperature -
MERRA-2 M2T1NXSLV: Single-Level Diagnostics V5.12.4
M2T1NXSLV (or tavg1_2d_slv_Nx) is an hourly time-averaged 2-dimensional data collection in Modern-Era Retrospective analysis for Research and Applications version 2 (MERRA-2). This collection consists of meteorology diagnostics at popularly used vertical levels, such as air temperature at 2-meter (or at 10-meter, 850hPa, 500 hPa, 250hPa), … humidity merra nasa pressure temperature vapor -
HLSL30: HLS-2 Landsat Operational Land Imager Surface Reflectance and TOA Brightness Daily Global 30m
The Harmonized Landsat Sentinel-2 (HLS) project provides consistent surface reflectance (SR) and top of atmosphere (TOA) brightness data from a virtual constellation of satellite sensors. The Operational Land Imager (OLI) is housed aboard the joint NASA/USGS Landsat 8 and Landsat 9 satellites, while the Multi-Spectral … landsat nasa sentinel usgs -
Global Forest Canopy Height, 2005
This dataset represents global tree heights based on a fusion of spaceborne-lidar data (2005) from the Geoscience Laser Altimeter System (GLAS) and ancillary geospatial data. See Simard et al. (2011) for details. forest geophysical jpl nasa -
VJ114IMGTDL_NRT Daily Raster: VIIRS (NOAA-20) Band 375m Active Fire
NOAA-20 (JPSS-1) Visible Infrared Imaging Radiometer Suite (VIIRS) Active Fire detection product is based on the instrument's 375m nominal resolution data. Compared to other coarser resolution (≥ 1km) satellite fire detection products, the improved 375 m data provide greater response over fires of relatively small … eosdis fire firms geophysical hotspot lance -
VNP14IMGTDL_NRT Daily Raster: VIIRS (S-NPP) Band 375m Active Fire
Suomi NPP Visible Infrared Imaging Radiometer Suite (VIIRS) Active Fire detection product is based on the instrument's 375m nominal resolution data. Compared to other coarser resolution (≥ 1km) satellite fire detection products, the improved 375 m data provide greater response over fires of relatively small … eosdis fire firms geophysical hotspot lance -
Global Forest Cover Change (GFCC) Tree Cover Multi-Year Global 30m
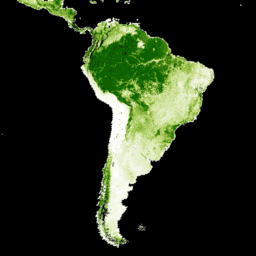
The Landsat Vegetation Continuous Fields (VCF) tree cover layers contain estimates of the percentage of horizontal ground in each 30-m pixel covered by woody vegetation greater than 5 meters in height. The dataset is available for four epochs centered on the years 2000, 2005, 2010 … forest glcf landsat-derived nasa umd -
NASADEM: NASA NASADEM Digital Elevation 30m
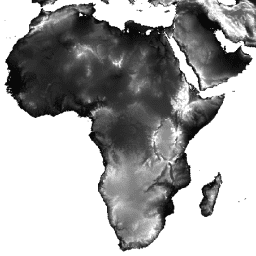
NASADEM is a reprocessing of STRM data, with improved accuracy by incorporating auxiliary data from ASTER GDEM, ICESat GLAS, and PRISM datasets. The most significant processing improvements involve void reduction through improved phase unwrapping and using ICESat GLAS data for control. Documentation: User's Guide dem elevation geophysical nasa srtm topography -
NEX-DCP30: NASA Earth Exchange Downscaled Climate Projections
The NASA NEX-DCP30 dataset is comprised of downscaled climate scenarios for the conterminous United States that are derived from the General Circulation Model (GCM) runs conducted under the Coupled Model Intercomparison Project Phase 5 (CMIP5, see Taylor et al. 2012) and across the four greenhouse … cag climate cmip5 geophysical nasa nex -
NEX-DCP30: Ensemble Stats for NASA Earth Exchange Downscaled Climate Projections

The NASA NEX-DCP30 dataset is comprised of downscaled climate scenarios for the conterminous United States that are derived from the General Circulation Model (GCM) runs conducted under the Coupled Model Intercomparison Project Phase 5 (CMIP5, see Taylor et al. 2012) and across the four greenhouse … cag climate cmip5 geophysical nasa nex -
NEX-GDDP: NASA Earth Exchange Global Daily Downscaled Climate Projections
The NASA NEX-GDDP dataset is comprised of downscaled climate scenarios for the globe that are derived from the General Circulation Model (GCM) runs conducted under the Coupled Model Intercomparison Project Phase 5 (CMIP5, see Taylor et al. 2012) and across two of the four greenhouse … cag climate cmip5 gddp geophysical nasa -
NLDAS-2: North American Land Data Assimilation System Forcing Fields
Land Data Assimilation System (LDAS) combines multiple sources of observations (such as precipitation gauge data, satellite data, and radar precipitation measurements) to produce estimates of climatological properties at or near the Earth''s surface. This dataset is the primary (default) forcing file (File A) for Phase … climate evaporation forcing geophysical hourly humidity -
Ocean Color SMI: Standard Mapped Image MODIS Aqua Data

This level 3 product includes ocean color and satellite ocean biology data produced or collected under EOSDIS. This dataset may be used for studying the biology and hydrology of coastal zones, changes in the diversity and geographical distribution of coastal marine habitats, biogeochemical fluxes and … biology chlorophyll climate modis nasa ocean -
Ocean Color SMI: Standard Mapped Image MODIS Terra Data
This level 3 product includes ocean color and satellite ocean biology data produced or collected under EOSDIS. This dataset may be used for studying the biology and hydrology of coastal zones, changes in the diversity and geographical distribution of coastal marine habitats, biogeochemical fluxes and … biology chlorophyll climate modis nasa ocean -
Ocean Color SMI: Standard Mapped Image SeaWiFS Data

This level 3 product includes ocean color and satellite ocean biology data produced or collected under EOSDIS. This dataset may be used for studying the biology and hydrology of coastal zones, changes in the diversity and geographical distribution of coastal marine habitats, biogeochemical fluxes and … biology chlorophyll climate nasa ocean oceandata -
Daymet V4: Daily Surface Weather and Climatological Summaries
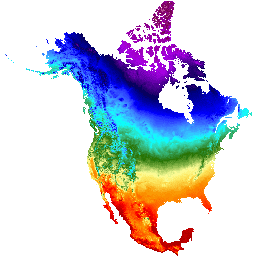
Daymet V4 provides gridded estimates of daily weather parameters for Continental North America, Hawaii, and Puerto Rico (Data for Puerto Rico is available starting in 1950). It is derived from selected meteorological station data and various supporting data sources. Compared to the previous version, Daymet … climate daily daylight flux geophysical nasa -
Global Aboveground and Belowground Biomass Carbon Density Maps
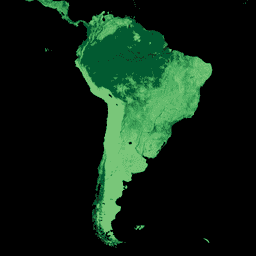
This dataset provides temporally consistent and harmonized global maps of aboveground and belowground biomass carbon density for the year 2010 at a 300-m spatial resolution. The aboveground biomass map integrates land-cover specific, remotely sensed maps of woody, grassland, cropland, and tundra biomass. Input maps were … aboveground biomass carbon density forest nasa -
SPL3SMP_E.005 SMAP L3 Radiometer Global Daily 9 km Soil Moisture

Data starting from 2023-12-04 are available in the NASA/SMAP/SPL3SMP_E/006 collection. This Level-3 (L3) soil moisture product provides a daily composite of global land surface conditions retrieved by the Soil Moisture Active Passive (SMAP) L-Band radiometer. The daily data here were collected from the descending (local … drought nasa smap soil-moisture surface weather -
SPL3SMP_E.006 SMAP L3 Radiometer Global Daily 9 km Soil Moisture
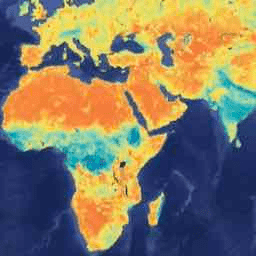
Data prior from 2023-12-04 are available in the older NASA/SMAP/SPL3SMP_E/005 collection. They will eventually be reprocessed and added to this collection. This Level-3 (L3) soil moisture product provides a daily composite of global land surface conditions retrieved by the Soil Moisture Active Passive (SMAP) L-Band … drought nasa smap soil-moisture surface weather -
SPL4SMGP.007 SMAP L4 Global 3-hourly 9-km Surface and Root Zone Soil Moisture
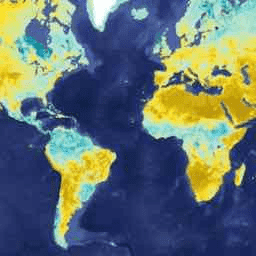
The SMAP Level-4 (L4) Soil Moisture product includes surface soil moisture (0-5 cm vertical average), root-zone soil moisture (0-100 cm vertical average), and additional research products (not validated), including surface meteorological forcing variables, soil temperature, evapotranspiration, and net radiation. SMAP L4 provides uninterrupted soil moisture … drought nasa smap soil-moisture surface weather -
NCEP/NCAR Reanalysis Data, Sea-Level Pressure
The NCEP/NCAR Reanalysis Project is a joint project between the National Centers for Environmental Prediction (NCEP, formerly "NMC") and the National Center for Atmospheric Research (NCAR). The goal of this joint effort is to produce new atmospheric analyses using historical data as well as to … atmosphere climate geophysical ncep noaa pressure -
NCEP/NCAR Reanalysis Data, Surface Temperature
The NCEP/NCAR Reanalysis Project is a joint project between the National Centers for Environmental Prediction (NCEP, formerly "NMC") and the National Center for Atmospheric Research (NCAR). The goal of this joint effort is to produce new atmospheric analyses using historical data as well as to … atmosphere climate geophysical ncep noaa reanalysis -
NCEP/NCAR Reanalysis Data, Water Vapor
The NCEP/NCAR Reanalysis Project is a joint project between the National Centers for Environmental Prediction (NCEP, formerly "NMC") and the National Center for Atmospheric Research (NCAR). The goal of this joint effort is to produce new atmospheric analyses using historical data as well as to … atmosphere climate geophysical ncep noaa reanalysis -
NOAA CDR: Ocean Near-Surface Atmospheric Properties, Version 2
The Ocean Near-Surface Atmospheric Properties dataset is part of the NOAA Ocean Surface Bundle (OSB) and provides a high quality Climate Data Record (CDR) of air temperature, wind speed, and specific humidity over ice-free ocean surfaces. These atmospheric properties are calculated based on brightness temperature … atmospheric cdr hourly humidity noaa ocean -
NOAA CDR AVHRR AOT: Daily Aerosol Optical Thickness Over Global Oceans, v04
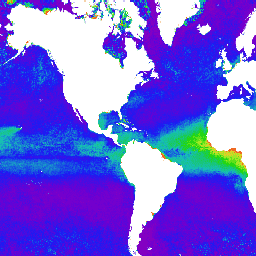
The NOAA Climate Data Record (CDR) of Aerosol Optical Thickness (AOT) is a collection of global daily 0.1 degree derived data from the PATMOS-x AVHRR level-2b channel 1 (0.63 micron) orbital clear-sky radiance. The aerosol product is generated from AVHRR imagery in cloud-free conditions during … aerosol atmospheric avhrr cdr daily noaa -
NOAA CDR AVHRR LAI FAPAR: Leaf Area Index and Fraction of Absorbed Photosynthetically Active Radiation, Version 5
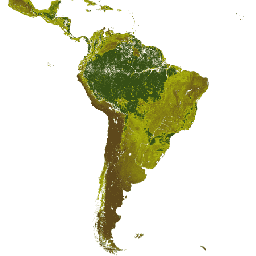
The NOAA Climate Data Record (CDR) of AVHRR Leaf Area Index (LAI) and Fraction of Absorbed Photosynthetically Active Radiation (FAPAR) dataset contains derived values that characterize the canopy and photosynthetic activity of plants. This dataset is derived from the NOAA AVHRR Surface Reflectance product and … avhrr cdr daily fapar lai land -
NOAA CDR AVHRR NDVI: Normalized Difference Vegetation Index, Version 5
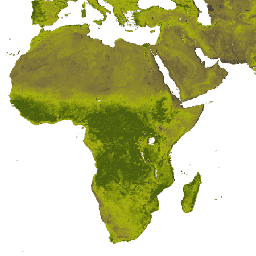
The NOAA Climate Data Record (CDR) of AVHRR Normalized Difference Vegetation Index (NDVI) contains gridded daily NDVI derived from the NOAA AVHRR Surface Reflectance product. It provides a measurement of surface vegetation coverage activity, gridded at a resolution of 0.05° and computed globally over land … avhrr cdr daily land ndvi noaa -
NOAA CDR AVHRR: Surface Reflectance, Version 5
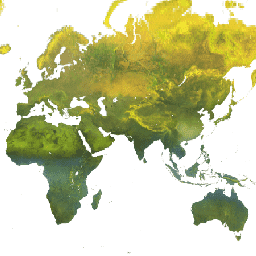
The NOAA Climate Data Record (CDR) of AVHRR Surface Reflectance contains gridded daily surface reflectance and brightness temperatures derived from the Advanced Very High Resolution Radiometer (AVHRR) sensors onboard seven NOAA polar orbiting satellites. The data are gridded at a resolution of 0.05° and computed … avhrr cdr daily land noaa reflectance -
NOAA CDR GRIDSAT-B1: Geostationary IR Channel Brightness Temperature
This dataset provides a high quality Climate Data Record (CDR) of global infrared measurements from geostationary satellites. The geostationary satellite data (GridSat-B1) provides data from 3 channels: the CDR-quality infrared window (IRWIN) channel (near 11µm), the visible channel (near 0.6µm) and the infrared water vapor … brightness cdr infrared noaa reflectance sr -
NOAA CDR: Ocean Heat Fluxes, Version 2

The Ocean Heat Fluxes dataset is part of the NOAA Ocean Surface Bundle (OSB) and provides a high quality Climate Data Record (CDR) of the air/ocean heat fluxes over ice-free oceans. This dataset is calculated from the OSB CDR parameters of near-surface atmospheric and sea … atmospheric cdr flux heat hourly noaa -
NOAA CDR OISST v02r01: Optimum Interpolation Sea Surface Temperature
The NOAA 1/4 degree daily Optimum Interpolation Sea Surface Temperature (OISST) provides complete ocean temperature fields constructed by combining bias-adjusted observations from different platforms (satellite, ships, buoys) on a regular global grid, with gaps filled in by interpolation. Satellite data from the Advanced Very High … avhrr cdr daily ice noaa ocean -
NOAA CDR PATMOSX: Cloud Properties, Reflectance, and Brightness Temperatures, Version 5.3
This dataset provides high quality Climate Data Record (CDR) of multiple cloud properties along with Advanced Very High Resolution Radiometer (AVHRR) Pathfinder Atmospheres Extended (PATMOS-x) brightness temperatures and reflectances. These data have been fitted to a 0.1 x 0.1 equal angle-grid with both ascending and … atmospheric avhrr brightness cdr cloud noaa -
NOAA AVHRR Pathfinder Version 5.3 Collated Global 4km Sea Surface Temperature
The AVHRR Pathfinder Version 5.3 Sea Surface Temperature dataset (PFV53) is a collection of global, twice-daily 4km sea surface temperature data produced in a partnership by the NOAA National Oceanographic Data Center and the University of Miami's Rosenstiel School of Marine and Atmospheric Science. PFV53 … avhrr noaa sst temperature wind -
NOAA CDR WHOI: Sea Surface Temperature, Version 2
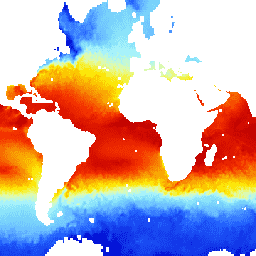
The Sea Surface Temperature - WHOI dataset is part of the NOAA Ocean Surface Bundle (OSB) and provides a high quality Climate Data Record (CDR) of sea surface temperature over ice-free oceans. The SST values are found through modeling the diurnal variability in combination with … atmospheric cdr hourly noaa ocean oisst -
CFSR: Climate Forecast System Reanalysis
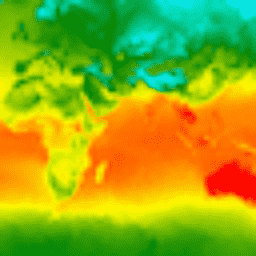
The National Centers for Environmental Prediction (NCEP) Climate Forecast System Reanalysis (CFSR) was designed and executed as a global, high-resolution, coupled atmosphere-ocean-land surface-sea ice system to provide the best estimate of the state of these coupled domains over the 32-year period of record from January … climate daylight flux forecast geophysical ncep -
CFSV2: NCEP Climate Forecast System Version 2, 6-Hourly Products
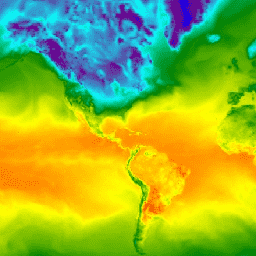
The National Centers for Environmental Prediction (NCEP) Climate Forecast System (CFS) is a fully coupled model representing the interaction between the Earth's atmosphere, oceans, land, and sea ice. CFS was developed at the Environmental Modeling Center (EMC) at NCEP. The operational CFS was upgraded to … climate daylight flux forecast geophysical ncep -
DMSP OLS: Global Radiance-Calibrated Nighttime Lights Version 4, Defense Meteorological Program Operational Linescan System
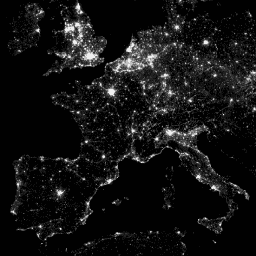
The Defense Meteorological Program (DMSP) Operational Line-Scan System (OLS) has a unique capability to detect visible and near-infrared (VNIR) emission sources at night. This collection contains global nighttime lights images with no sensor saturation. The sensor is typically operated at a high-gain setting to enable … dmsp eog imagery lights nighttime ols -
DMSP OLS: Nighttime Lights Time Series Version 4, Defense Meteorological Program Operational Linescan System

The Defense Meteorological Program (DMSP) Operational Line-Scan System (OLS) has a unique capability to detect visible and near-infrared (VNIR) emission sources at night. Version 4 of the DMSP-OLS Nighttime Lights Time Series consists of cloud-free composites made using all the available archived DMSP-OLS smooth resolution … dmsp eog imagery lights nighttime ols -
GFS: Global Forecast System 384-Hour Predicted Atmosphere Data
The Global Forecast System (GFS) is a weather forecast model produced by the National Centers for Environmental Prediction (NCEP). The GFS dataset consists of selected model outputs (described below) as gridded forecast variables. The 384-hour forecasts, with 1-hour (up to 120 hours) and 3-hour (after … climate cloud flux forecast geophysical humidity -
GOES-16 FDCC Series ABI Level 2 Fire/Hot Spot Characterization CONUS
The Fire (HSC) product contains four images: one in the form of a fire mask and the other three with pixel values identifying fire temperature, fire area, and fire radiative power. The ABI L2+ FHS metadata mask assigns a flag to every earth-navigated pixel that … abi climate fdc fire goes goes-16 -
GOES-16 FDCF Series ABI Level 2 Fire/Hot Spot Characterization Full Disk
The Fire (HSC) product contains four images: one in the form of a fire mask and the other three with pixel values identifying fire temperature, fire area, and fire radiative power. The ABI L2+ FHS metadata mask assigns a flag to every earth-navigated pixel that … abi climate fdc fire goes goes-16 -
GOES-16 MCMIPC Series ABI Level 2 Cloud and Moisture Imagery CONUS
The Cloud and Moisture Imagery products are all at 2km resolution. Bands 1-6 are reflective. The dimensionless "reflectance factor" quantity is normalized by the solar zenith angle. These bands support the characterization of clouds, vegetation, snow/ice, and aerosols. Bands 7-16 are emissive. The brightness temperature … abi climate goes goes-16 goes-east goes-r -
GOES-16 MCMIPF Series ABI Level 2 Cloud and Moisture Imagery Full Disk
The Cloud and Moisture Imagery products are all at 2km resolution. Bands 1-6 are reflective. The dimensionless "reflectance factor" quantity is normalized by the solar zenith angle. These bands support the characterization of clouds, vegetation, snow/ice, and aerosols. Bands 7-16 are emissive. The brightness temperature … abi climate goes goes-16 goes-east goes-r -
GOES-16 MCMIPM Series ABI Level 2 Cloud and Moisture Imagery Mesoscale
The Cloud and Moisture Imagery products are all at 2km resolution. Bands 1-6 are reflective. The dimensionless "reflectance factor" quantity is normalized by the solar zenith angle. These bands support the characterization of clouds, vegetation, snow/ice, and aerosols. Bands 7-16 are emissive. The brightness temperature … abi climate goes goes-16 goes-east goes-r -
GOES-17 FDCC Series ABI Level 2 Fire/Hot Spot Characterization CONUS
The Fire (HSC) product contains four images: one in the form of a fire mask and the other three with pixel values identifying fire temperature, fire area, and fire radiative power. The ABI L2+ FHS metadata mask assigns a flag to every earth-navigated pixel that … abi climate fdc fire goes goes-17 -
GOES-17 FDCF Series ABI Level 2 Fire/Hot Spot Characterization Full Disk

The Fire (HSC) product contains four images: one in the form of a fire mask and the other three with pixel values identifying fire temperature, fire area, and fire radiative power. The ABI L2+ FHS metadata mask assigns a flag to every earth-navigated pixel that … abi climate fdc fire goes goes-17 -
GOES-17 MCMIPC Series ABI Level 2 Cloud and Moisture Imagery CONUS

The Cloud and Moisture Imagery products are all at 2km resolution. Bands 1-6 are reflective. The dimensionless "reflectance factor" quantity is normalized by the solar zenith angle. These bands support the characterization of clouds, vegetation, snow/ice, and aerosols. Bands 7-16 are emissive. The brightness temperature … abi climate goes goes-17 goes-s mcmip -
GOES-17 MCMIPF Series ABI Level 2 Cloud and Moisture Imagery Full Disk

The Cloud and Moisture Imagery products are all at 2km resolution. Bands 1-6 are reflective. The dimensionless "reflectance factor" quantity is normalized by the solar zenith angle. These bands support the characterization of clouds, vegetation, snow/ice, and aerosols. Bands 7-16 are emissive. The brightness temperature … abi climate goes goes-17 goes-s mcmip -
GOES-17 MCMIPM Series ABI Level 2 Cloud and Moisture Imagery Full Disk

The Cloud and Moisture Imagery products are all at 2km resolution. Bands 1-6 are reflective. The dimensionless "reflectance factor" quantity is normalized by the solar zenith angle. These bands support the characterization of clouds, vegetation, snow/ice, and aerosols. Bands 7-16 are emissive. The brightness temperature … abi climate goes goes-17 goes-s mcmip -
GOES-18 FDCC Series ABI Level 2 Fire/Hot Spot Characterization CONUS

The Fire (HSC) product contains four images: one in the form of a fire mask and the other three with pixel values identifying fire temperature, fire area, and fire radiative power. The ABI L2+ FHS metadata mask assigns a flag to every earth-navigated pixel that … abi climate fdc fire goes goes-18 -
GOES-18 FDCF Series ABI Level 2 Fire/Hot Spot Characterization Full Disk
The Fire (HSC) product contains four images: one in the form of a fire mask and the other three with pixel values identifying fire temperature, fire area, and fire radiative power. The ABI L2+ FHS metadata mask assigns a flag to every earth-navigated pixel that … abi climate fdc fire goes goes-18 -
GOES-18 MCMIPC Series ABI Level 2 Cloud and Moisture Imagery CONUS
The Cloud and Moisture Imagery products are all at 2km resolution. Bands 1-6 are reflective. The dimensionless "reflectance factor" quantity is normalized by the solar zenith angle. These bands support the characterization of clouds, vegetation, snow/ice, and aerosols. Bands 7-16 are emissive. The brightness temperature … abi climate goes goes-18 goes-t goes-west -
GOES-18 MCMIPF Series ABI Level 2 Cloud and Moisture Imagery Full Disk
The Cloud and Moisture Imagery products are all at 2km resolution. Bands 1-6 are reflective. The dimensionless "reflectance factor" quantity is normalized by the solar zenith angle. These bands support the characterization of clouds, vegetation, snow/ice, and aerosols. Bands 7-16 are emissive. The brightness temperature … abi climate goes goes-18 goes-t goes-west -
GOES-18 MCMIPM Series ABI Level 2 Cloud and Moisture Imagery Full Disk
The Cloud and Moisture Imagery products are all at 2km resolution. Bands 1-6 are reflective. The dimensionless "reflectance factor" quantity is normalized by the solar zenith angle. These bands support the characterization of clouds, vegetation, snow/ice, and aerosols. Bands 7-16 are emissive. The brightness temperature … abi climate goes goes-18 goes-t goes-west -
NCEP-DOE Reanalysis 2 (Gaussian Grid), Total Cloud Coverage
NCEP-DOE Reanalysis 2 project is using a state-of-the-art analysis/forecast system to perform data assimilation using past data from 1979 through the previous year. atmosphere climate cloud geophysical ncep noaa -
ETOPO1: Global 1 Arc-Minute Elevation
ETOPO1 is a 1 arc-minute global relief model of Earth''s surface that integrates land topography and ocean bathymetry. It was built from numerous global and regional data sets. It contains two elevation bands: ice_surface and bedrock. bedrock dem elevation geophysical ice noaa -
NOAA NHC HURDAT2 Atlantic Hurricane Catalog
Hurricane best track database (HURDAT2). Atlantic basin 1851-2018. hurricane nhc noaa weather -
NOAA NHC HURDAT2 Pacific Hurricane Catalog
Hurricane best track database (HURDAT2). Pacific basin 1949-2018. hurricane nhc noaa weather -
RTMA: Real-Time Mesoscale Analysis
The Real-Time Mesoscale Analysis (RTMA) is a high-spatial and temporal resolution analysis for near-surface weather conditions. This dataset includes hourly analyses at 2.5 km for CONUS. climate cloud geophysical humidity noaa nws -
PERSIANN-CDR: Precipitation Estimation From Remotely Sensed Information Using Artificial Neural Networks-Climate Data Record
PERSIANN-CDR is a daily quasi-global precipitation product that spans the period from 1983-01-01 to present. The data is produced quarterly, with a typical lag of three months. The product is developed by the Center for Hydrometeorology and Remote Sensing at the University of California, Irvine … cdr climate geophysical noaa precipitation weather -
VNP09GA: VIIRS Surface Reflectance Daily 500m and 1km
The Visible Infrared Imaging Radiometer Suite (VIIRS) daily surface reflectance (VNP09GA) product provides an estimate of land surface reflectance from the Suomi National Polar-Orbiting Partnership (S-NPP) VIIRS sensor. Data are provided for three imagery bands (I1, I2, I3) at nominal 500 meter resolution (~463 meter) … daily nasa noaa npp reflectance sr -
VNP09H1: VIIRS Surface Reflectance 8-Day L3 Global 500m
The 8-day Visible Infrared Imaging Radiometer Suite (VIIRS) Surface Reflectance (VNP09H1) Version 1 composite product provides an estimate of land surface reflectance from the Suomi National Polar-orbiting Partnership (Suomi NPP) VIIRS sensor for three imagery bands (I1, I2, I3) at nominal 500m resolution (~463m). The … daily nasa noaa npp reflectance sr -
VNP13A1: VIIRS Vegetation Indices 16-Day 500m
The Suomi National Polar-Orbiting Partnership (S-NPP) NASA Visible Infrared Imaging Radiometer Suite (VIIRS) Vegetation Indices (VNP13A1) data product provides vegetation indices by a process of selecting the best available pixel over a 16-day acquisition period at 500 meter resolution. The VNP13 data products are designed … 16-day evi nasa ndvi noaa npp -
VNP14A1: Thermal Anomalies/Fire Daily L3 Global 1km SIN Grid
The daily Suomi National Polar-Orbiting Partnership NASA Visible Infrared Imaging Radiometer Suite (VIIRS) Thermal Anomalies/Fire (VNP14A1) Version 1 data product provides daily information about active fires and other thermal anomalies. The VNP14A1 data product is a global, 1km gridded composite of fire pixels detected from … fire land nasa noaa surface viirs -
VNP15A2H: LAI/FPAR 8-Day L4 Global 500m SIN Grid
The Visible Infrared Imaging Radiometer Suite (VIIRS) Leaf Area Index (LAI) and Fraction of Photosynthetically Active Radiation (FPAR) Version 1 data product provides information about the vegetative canopy layer at 500 meter resolution (VNP15A2H). The VIIRS sensor is located onboard the NOAA/NASA joint Suomi National … land nasa noaa surface viirs -
VNP21A1D: Day Land Surface Temperature and Emissivity Daily 1km
The NASA Suomi National Polar-Orbiting Partnership (Suomi NPP) Visible Infrared Imaging Radiometer Suite (VIIRS) Land Surface Temperature and Emissivity (LST&E) Day Version 1 product (VNP21A1D) is compiled daily from daytime Level 2 Gridded (L2G) intermediate products. The L2G process maps the daily VNP21 swath granules … daily day land nasa noaa surface -
VNP21A1N: Night Land Surface Temperature and Emissivity Daily 1km
The NASA Suomi National Polar-Orbiting Partnership (Suomi NPP) Visible Infrared Imaging Radiometer Suite (VIIRS) Land Surface Temperature and Emissivity (LST&E) Night Version 1 product (VNP21A1N) is compiled daily from nighttime Level 2 Gridded (L2G) intermediate products. The L2G process maps the daily VNP21 swath granules … daily land nasa night noaa surface -
VNP22Q2: Land Surface Phenology Yearly L3 Global 500m SIN Grid
The Suomi National Polar-Orbiting Partnership (Suomi NPP) NASA Visible Infrared Imaging Radiometer Suite (VIIRS) Land Cover Dynamics data product provides global land surface phenology (GLSP) metrics at yearly intervals. The VNP22Q2 data product is derived from time series of the two-band Enhanced Vegetation Index (EVI2) … land nasa ndvi noaa npp onset-greenness -
VNP43IA1: BRDF/Albedo Model Parameters Daily L3 Global 500m SIN Grid
The Suomi National Polar-Orbiting Partnership (Suomi NPP) NASA Visible Infrared Imaging Radiometer Suite (VIIRS) Bidirectional Reflectance Distribution Function (BRDF) and Albedo Model Parameters (VNP43IA1) Version 1 product provides kernel weights (parameters) at 500 resolution. The VNP43IA1 product is produced daily using 16 days of VIIRS … land nasa noaa surface viirs -
VNP43IA2: BRDF/Albedo Quality Daily L3 Global 500m SIN Grid
The Suomi National Polar-Orbiting Partnership (Suomi NPP) NASA Visible Infrared Imaging Radiometer Suite (VIIRS) Bidirectional Reflectance Distribution Function (BRDF) and Albedo Quality (VNP43IA2) Version 1 product provides BRDF and Albedo quality at 500m resolution. The VNP43IA2 product is produced daily using 16 days of VIIRS … land nasa noaa surface viirs -
VNP46A1: VIIRS Daily Gridded Day Night Band 500m Linear Lat Lon Grid Night
The Suomi National Polar-orbiting Partnership (SNPP) Visible Infrared Imaging Radiometer Suite (VIIRS) supports a Day-Night Band (DNB) sensor that provides global daily measurements of nocturnal visible and near-infrared (NIR) light that are suitable for Earth system science and applications. The VIIRS DNB's ultra-sensitivity in lowlight … daily dnb nasa noaa viirs -
VNP46A2: VIIRS Lunar Gap-Filled BRDF Nighttime Lights Daily L3 Global 500m
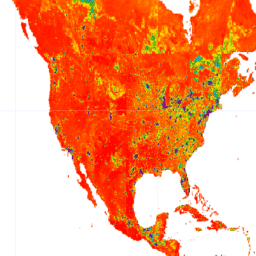
The Suomi National Polar-orbiting Partnership (SNPP) Visible Infrared Imaging Radiometer Suite (VIIRS) supports a Day-Night Band (DNB) sensor that provides global daily measurements of nocturnal visible and near-infrared (NIR) light that are suitable for Earth system science and applications. The VIIRS DNB's ultra-sensitivity in lowlight … brdf daily nasa noaa viirs -
VNP64A1: Burned Area Monthly L4 Global 500m SIN Grid
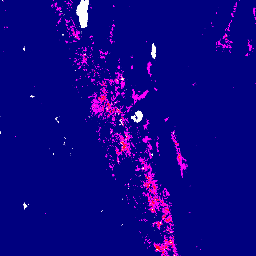
The daily Suomi National Polar-Orbiting Partnership (Suomi NPP) NASA Visible Infrared Imaging Radiometer Suite (VIIRS) Burned Area (VNP64A1) Version 1 data product is a monthly, global gridded 500m product containing per-pixel burned area and quality information. The VNP64 burned area mapping approach employs 750m VIIRS … burn change-detection land nasa noaa surface -
VIIRS Nighttime Day/Night Annual Band Composites V2.1
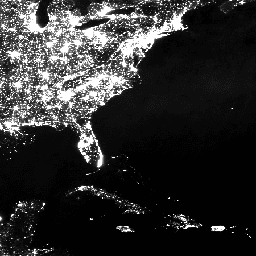
Annual global VIIRS nighttime lights dataset is a time series produced from monthly cloud-free average radiance grids spanning 2013 to 2021. Data for 2022 are available in the NOAA/VIIRS/DNB/ANNUAL_V22 dataset. An initial filtering step removed sunlit, moonlit and cloudy pixels, leading to rough composites that … annual dnb eog lights nighttime noaa -
VIIRS Nighttime Day/Night Annual Band Composites V2.2

Annual global VIIRS nighttime lights dataset is a time series produced from monthly cloud-free average radiance grids for 2022. Data for earlier years are available in the NOAA/VIIRS/DNB/ANNUAL_V21 dataset. An initial filtering step removed sunlit, moonlit and cloudy pixels, leading to rough composites that contains … annual dnb eog lights nighttime noaa -
VIIRS Nighttime Day/Night Band Composites Version 1
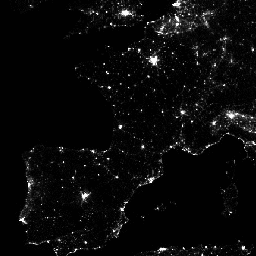
Monthly average radiance composite images using nighttime data from the Visible Infrared Imaging Radiometer Suite (VIIRS) Day/Night Band (DNB). As these data are composited monthly, there are many areas of the globe where it is impossible to get good quality data coverage for that month. … dnb eog lights monthly nighttime noaa -
VIIRS Stray Light Corrected Nighttime Day/Night Band Composites Version 1

Monthly average radiance composite images using nighttime data from the Visible Infrared Imaging Radiometer Suite (VIIRS) Day/Night Band (DNB). As these data are composited monthly, there are many areas of the globe where it is impossible to get good quality data coverage for that month. … dnb eog lights monthly nighttime noaa -
Canadian Digital Elevation Model
The Canadian Digital Elevation Model (CDEM) is part of Natural Resources Canada's (NRCan) altimetry system and stems from the existing Canadian Digital Elevation Data (CDED). In these data, elevations can be either ground or reflective surface elevations. The CDEM is comprised of multiple DEMs with … canada dem elevation geophysical topography -
Netherlands orthophotos
Orthophotos of Netherlands is a set of color orthoimages. Two nationwide aerial photographs are collected per year: a leafless image at 7.5 cm resolution in the spring and one with leaves on trees at 25 cm resolution in the summer. For more information, please see … netherlands orthophoto rgb -
PRISM Daily Spatial Climate Dataset AN81d
The PRISM daily and monthly datasets are gridded climate datasets for the conterminous United States, produced by the PRISM Climate Group at Oregon State University. Grids are developed using PRISM (Parameter-elevation Regressions on Independent Slopes Model). PRISM interpolation routines simulate how weather and climate vary … climate daily geophysical oregonstate precipitation pressure -
PRISM Monthly Spatial Climate Dataset AN81m

The PRISM daily and monthly datasets are gridded climate datasets for the conterminous United States, produced by the PRISM Climate Group at Oregon State University. Grids are developed using PRISM (Parameter-elevation Regressions on Independent Slopes Model). PRISM interpolation routines simulate how weather and climate vary … climate geophysical monthly oregonstate precipitation pressure -
PRISM Long-Term Average Climate Dataset Norm91m

The PRISM daily and monthly datasets are gridded climate datasets for the conterminous United States, produced by the PRISM Climate Group at Oregon State University. Grids are developed using PRISM (Parameter-elevation Regressions on Independent Slopes Model). PRISM interpolation routines simulate how weather and climate vary … climate geophysical oregonstate precipitation pressure prism -
Greenland Ice & Ocean Mask - Greenland Mapping Project (GIMP)
This dataset provides complete land ice and ocean classification masks at 15 m for the Greenland ice sheet. Ice cover was mapped using a combination of orthorectified panchromatic (band 8) imagery from the Landsat 7 Enhanced Thematic Mapper Plus (ETM+), distributed by the USGS, and … arctic gimp greenland ice nasa polar -
2000 Greenland Mosaic - Greenland Ice Mapping Project (GIMP)
This dataset provides a complete 15 m resolution image mosaic of the Greenland ice sheet derived from Landsat 7 ETM+ and RADARSAT-1 SAR imagery from the years 1999 to 2002. The methods include a combination of image cloud masking, pan sharpening, image sampling and resizing, … arctic gimp greenland imagery nasa polar -
Greenland DEM - Greenland Mapping Project (GIMP)
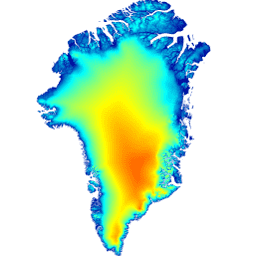
This Digital Elevation Model (DEM) is constructed from a combination of ASTER and SPOT-5 DEM's for the ice sheet periphery and margin (i.e. below the equilbrium line elevation) south of approximately 82.5°N and AVHRR photoclinometry in the ice sheet interior and far north (Scambos and … arctic gimp greenland nasa polar -
MEaSUREs Greenland Ice Velocity: Selected Glacier Site Velocity Maps from Optical Images Version 2
This dataset, part of the NASA Making Earth System Data Records for Use in Research Environments (MEaSUREs) program, consists of mean monthly velocity maps for selected glacier outlet areas. The maps are generated by tracking visible features between optical image pairs acquired by the Landsat … arctic gimp greenland ice nasa polar -
OpenET CONUS DisALEXI Monthly Evapotranspiration v2.0
Atmosphere-Land Exchange Inverse / Disaggregation of the Atmosphere-Land Exchange Inverse (ALEXI/DisALEXI) DisALEXI was recently ported to Google Earth Engine as part of the OpenET framework and the baseline ALEXI/DisALEXI model structure is described by Anderson et al. (2012, 2018). The ALEXI evapotranspiration (ET) model specifically … conus evapotranspiration gridmet-derived landsat-derived monthly openet -
OpenET CONUS eeMETRIC Monthly Evapotranspiration v2.0
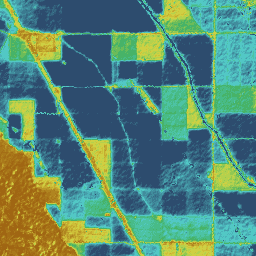
Google Earth Engine implementation of the Mapping Evapotranspiration at high Resolution with Internalized Calibration model (eeMETRIC) eeMETRIC applies the advanced METRIC algorithms and process of Allen et al. (2007; 2015) and Allen et al. (2013b), where a singular relationship between the near surface air temperature … conus evapotranspiration gridmet-derived landsat-derived monthly openet -
OpenET CONUS Ensemble Monthly Evapotranspiration v2.0
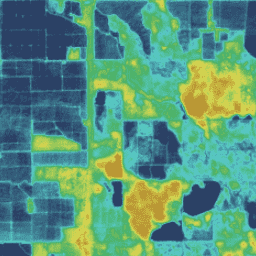
The OpenET dataset includes satellite-based data on the total amount of water that is transferred from the land surface to the atmosphere through the process of evapotranspiration (ET). OpenET provides ET data from multiple satellite-driven models, and also calculates a single "ensemble value" from the … conus evapotranspiration gridmet-derived landsat-derived monthly openet -
OpenET CONUS geeSEBAL Monthly Evapotranspiration v2.0
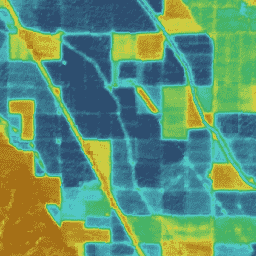
Implementation of geeSEBAL was recently completed within the OpenET framework and an overview of the current geeSEBAL version can be found in Laipelt et al. (2021), which is based on the original algorithms developed by Bastiaanssen et al. (1998). The OpenET geeSEBAL implementation uses land … conus evapotranspiration gridmet-derived landsat-derived monthly openet -
OpenET CONUS PT-JPL Monthly Evapotranspiration v2.0
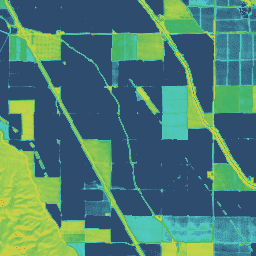
Priestley-Taylor Jet Propulsion Laboratory (PT-JPL) The core formulation of the PT-JPL model within the OpenET framework has not changed from the original formulation detailed in Fisher et al. (2008). However, enhancements and updates to model inputs and time integration for PT-JPL were made to take … conus evapotranspiration gridmet-derived landsat-derived monthly openet -
OpenET CONUS SIMS Monthly Evapotranspiration v2.0
Satellite Irrigation Management Support The NASA Satellite Irrigation Management Support (SIMS) model was originally developed to support satellite mapping of crop coefficients and evapotranspiration (ET) from irrigated lands and to increase access to this data to support use in irrigation scheduling and regional assessment of … conus evapotranspiration gridmet-derived landsat-derived monthly openet -
OpenET CONUS SSEBop Monthly Evapotranspiration v2.0
Operational Simplified Surface Energy Balance (SSEBop) The Operational Simplified Surface Energy Balance (SSEBop) model by Senay et al. (2013, 2017) is a thermal-based simplified surface energy model for estimating actual ET based on the principles of satellite psychrometry (Senay 2018). The OpenET SSEBop implementation uses … conus evapotranspiration gridmet-derived landsat-derived monthly openet -
OpenLandMap Long-term Land Surface Temperature Monthly Day-Night Difference
Long-term MODIS LST day-time and night-time differences at 1 km based on the 2000-2017 time series Derived using the data.table package and quantile function in R. For more info about the MODIS LST product see this page. Antarctica is not included. To access and visualize … day envirometrix lst mod11a2 modis monthly -
OpenLandMap Long-term Land Surface Temperature Daytime Monthly Median
Land Surface Temperature daytime monthly mean value 2000-2017. Derived using the data.table package and quantile function in R. For more info about the MODIS LST product see this page. Antarctica is not included. To access and visualize maps outside of Earth Engine, use this page. … envirometrix lst mod11a2 modis monthly opengeohub -
OpenLandMap Long-term Land Surface Temperature Daytime Monthly Standard Deviation
Long-term MODIS LST day-time and night-time temperatures standard deviation at 1 km based on the 2000-2017 time series. Derived using the data.table package and quantile function in R. For more info about the MODIS LST product see this page. Antarctica is not included. To access … envirometrix lst mod11a2 modis monthly opengeohub -
OpenLandMap Precipitation Monthly
Monthly precipitation in mm at 1 km resolution based on SM2RAIN-ASCAT 2007-2018, IMERG, CHELSA Climate, and WorldClim. Downscaled to 1 km resolution using gdalwarp (cubic splines) and an average between WorldClim, CHELSA Climate, and IMERG monthly product (see, e.g, "3B-MO-L.GIS.IMERG.20180601.V05B.tif"). 3x higher weight is given … envirometrix imerg monthly opengeohub openlandmap precipitation -
OpenLandMap Potential Distribution of Biomes
Potential Natural Vegetation biomes global predictions of classes (based on predictions using the BIOMES 6000 dataset's 'current biomes' category.) Potential Natural Vegetation (PNV) is the vegetation cover in equilibrium with climate that would exist at a given location non-impacted by human activities. PNV is useful … envirometrix opengeohub openlandmap potential -
OpenLandMap Potential FAPAR Monthly
Potential Natural Vegetation FAPAR predicted monthly median (based on PROB-V FAPAR 2014-2017). Description. To access and visualize maps outside of Earth Engine, use this page. If you discover a bug, artifact or inconsistency in the LandGIS maps or if you have a question please use … envirometrix fapar monthly opengeohub openlandmap potential -
OpenLandMap Soil Bulk Density
Soil bulk density (fine earth) 10 x kg / m3 at 6 standard depths (0, 10, 30, 60, 100 and 200 cm) at 250 m resolution. Processing steps are described in detail here. Antarctica is not included. To access and visualize maps outside of Earth … density envirometrix opengeohub openlandmap soil -
OpenLandMap Clay Content
Clay content in % (kg / kg) at 6 standard depths (0, 10, 30, 60, 100 and 200 cm) at 250 m resolution Based on machine learning predictions from global compilation of soil profiles and samples. Processing steps are described in detail here. Antarctica is … clay envirometrix opengeohub openlandmap soil usda -
OpenLandMap Predicted Hapludalfs Probability
Predicted USDA soil great groups at 250 m (probabilities). Distribution of the USDA soil great groups based on machine learning predictions from global compilation of soil profiles. To learn more about soil great groups please refer to the Illustrated Guide to Soil Taxonomy - NRCS … envirometrix opengeohub openlandmap -
OpenLandMap USDA Soil Taxonomy Great Groups
Predicted USDA soil great group probabilities at 250m. Distribution of the USDA soil great groups based on machine learning predictions from global compilation of soil profiles. To learn more about soil great groups please refer to the Illustrated Guide to Soil Taxonomy - NRCS - … envirometrix opengeohub openlandmap soil usda -
OpenLandMap Soil Organic Carbon Content
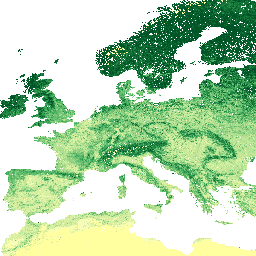
Soil organic carbon content in x 5 g / kg at 6 standard depths (0, 10, 30, 60, 100 and 200 cm) at 250 m resolution Predicted from a global compilation of soil points. Processing steps are described in detail here. Antarctica is not included. … carbon envirometrix opengeohub openlandmap soil -
OpenLandMap Soil pH in H2O
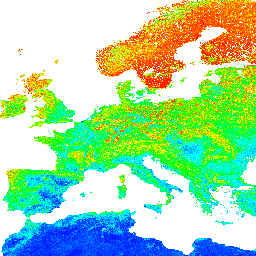
Soil pH in H2O at 6 standard depths (0, 10, 30, 60, 100 and 200 cm) at 250 m resolution Processing steps are described in detail here. Antarctica is not included. To access and visualize maps outside of Earth Engine, use this page. If you … envirometrix opengeohub openlandmap ph soil -
OpenLandMap Sand Content
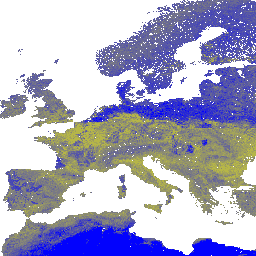
Sand content in % (kg / kg) at 6 standard depths (0, 10, 30, 60, 100 and 200 cm) at 250 m resolution Based on machine learning predictions from global compilation of soil profiles and samples. Processing steps are described in detail here. Antarctica is … envirometrix opengeohub openlandmap sand soil usda -
OpenLandMap Soil Texture Class (USDA System)
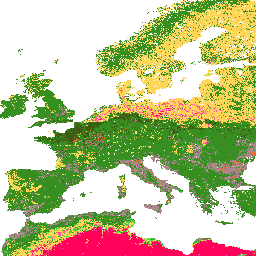
Soil texture classes (USDA system) for 6 soil depths (0, 10, 30, 60, 100 and 200 cm) at 250 m Derived from predicted soil texture fractions using the soiltexture package in R. Processing steps are described in detail here. Antarctica is not included. To access … envirometrix opengeohub openlandmap soil usda -
OpenLandMap Soil Water Content at 33kPa (Field Capacity)
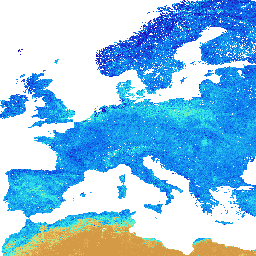
Soil water content (volumetric %) for 33kPa and 1500kPa suctions predicted at 6 standard depths (0, 10, 30, 60, 100 and 200 cm) at 250 m resolution Training points are based on a global compilation of soil profiles: USDA NCSS AfSPDB ISRIC WISE EGRPR SPADE … envirometrix opengeohub openlandmap soil -
Oxford MAP EVI: Malaria Atlas Project Gap-Filled Enhanced Vegetation Index
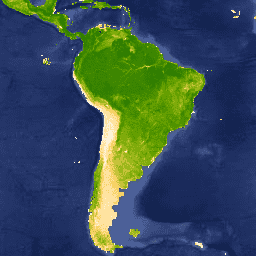
The underlying dataset for this Enhanced Vegetation Index (EVI) product is MODIS BRDF-corrected imagery (MCD43B4), which was gap-filled using the approach outlined in Weiss et al. (2014) to eliminate missing data caused by factors such as cloud cover. Gap-free outputs were then aggregated temporally and … evi map oxford vegetation -
Oxford MAP: Malaria Atlas Project Fractional International Geosphere-Biosphere Programme Landcover
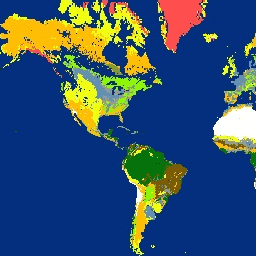
The underlying dataset for this landcover product is the IGBP layer found within the MODIS annual landcover product (MCD12Q1). This data was converted from its categorical format, which has a ≈500 meter resolution, to a fractional product indicating the integer percentage (0-100) of the output … landcover map oxford -
Oxford MAP LST: Malaria Atlas Project Gap-Filled Daytime Land Surface Temperature
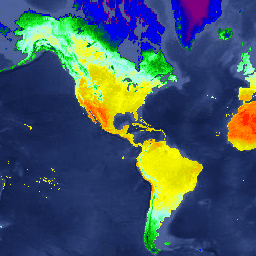
The underlying dataset for this daytime product is MODIS land surface temperature data (MOD11A2), which was gap-filled using the approach outlined in Weiss et al. (2014) to eliminate missing data caused by factors such as cloud cover. Gap-free outputs were then aggregated temporally and spatially … lst map oxford surface-temperature -
Oxford MAP LST: Malaria Atlas Project Gap-Filled Nighttime Land Surface Temperature
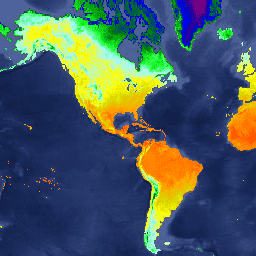
The underlying dataset for this nighttime product is MODIS land surface temperature data (MOD11A2), which was gap-filled using the approach outlined in Weiss et al. (2014) to eliminate missing data caused by factors such as cloud cover. Gap-free outputs were then aggregated temporally and spatially … lst map oxford surface-temperature -
Oxford MAP TCB: Malaria Atlas Project Gap-Filled Tasseled Cap Brightness
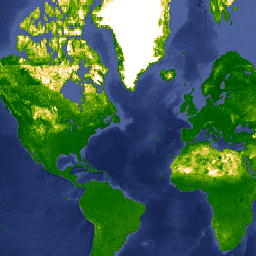
This gap-filled Tasseled Cap Brightness (TCB) dataset was created by applying the tasseled-cap equations defined in Lobser and Cohen (2007) to MODIS BRDF-corrected imagery (MCD43B4). The resulting data were gap-filled using the approach outlined in Weiss et al. (2014) to eliminate missing data caused by … brightness map oxford tasseled-cap tcb -
Oxford MAP TCW: Malaria Atlas Project Gap-Filled Tasseled Cap Wetness
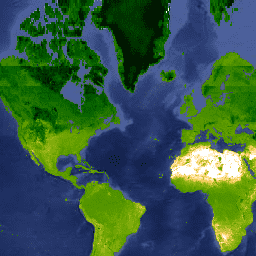
This gap-filled Tasseled Cap Wetness (TCW) dataset was created by applying the tasseled-cap equations defined in Lobser and Cohen (2007) to MODIS BRDF-corrected imagery (MCD43B4). The resulting data were gap-filled using the approach outlined in Weiss et al. (2014) to eliminate missing data caused by … map oxford tasseled-cap tcb -
Accessibility to Healthcare 2019
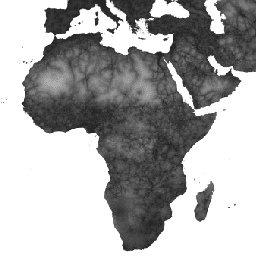
This global accessibility map enumerates land-based travel time (in minutes) to the nearest hospital or clinic for all areas between 85 degrees north and 60 degrees south for a nominal year 2019. It also includes "walking-only" travel time, using non-motorized means of transportation only. Major … accessibility jrc map oxford twente -
Global Friction Surface 2019
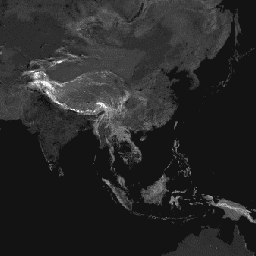
This global friction surface enumerates land-based travel speed for all land pixels between 85 degrees north and 60 degrees south for a nominal year 2019. It also includes "walking-only" travel speed, using non-motorized means of transportation only. This map was produced through a collaboration between … accessibility jrc map oxford twente -
RESOLVE Ecoregions 2017
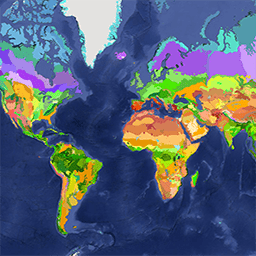
The RESOLVE Ecoregions dataset, updated in 2017, offers a depiction of the 846 terrestrial ecoregions that represent our living planet. View the stylized map at https://ecoregions2017.appspot.com/ or in Earth Engine. Ecoregions, in the simplest definition, are ecosystems of regional extent. Specifically, ecoregions represent distinct assemblages … biodiversity conservation ecoregions global -
Global map of Local Climate Zones, latest version
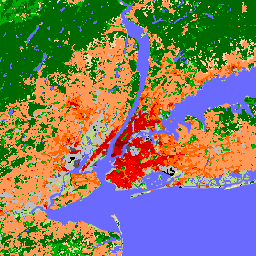
Since their introduction in 2012, Local Climate Zones (LCZs) emerged as a new standard for characterizing urban landscapes, providing a holistic classification approach that takes into account micro-scale land-cover and associated physical properties. This global map of Local Climate Zones, at 100m pixel size and … climate landcover urban -
Planet SkySat Public Ortho Imagery, Multispectral
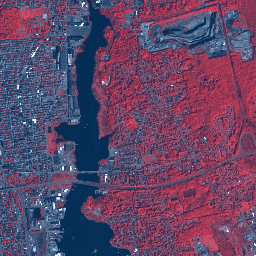
This data from Planet labs Inc. SkySat satellites was collected for the experimental "Skybox for Good Beta" program in 2015, as well as for various crisis response events and a few other projects. The data is available in both a 5-band Multispectral/Pan collection, and a … highres multispectral pansharpened planet skysat -
Planet SkySat Public Ortho Imagery, RGB
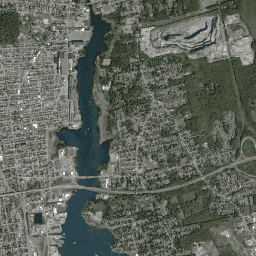
This data from Planet labs Inc. SkySat satellites was collected for the experimental "Skybox for Good Beta" program in 2015, as well as for various crisis response events and a few other projects. The data is available in both a 5-band Multispectral/Pan collection, and a … highres pansharpened planet rgb skysat -
Breathing Earth System Simulator (BESS) Radiation v1
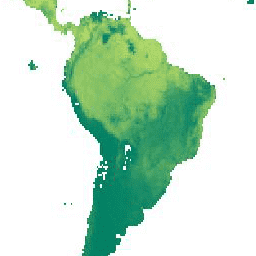
Breathing Earth System Simulator (BESS) is a simplified process-based model that couples atmosphere and canopy radiative transfers, canopy photosynthesis, transpiration, and energy balance. It couples an atmospheric radiative transfer model and artificial neural network with forcings from MODIS atmospheric products to generate 5-km daily products. … evapotranspiration gpp modis-derived par radiation shortwave -
Slovakia orthophotos
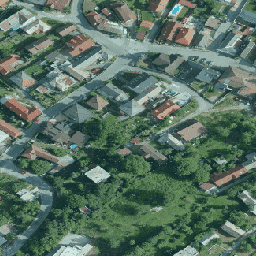
Orthophotomosaic of the Slovak Republic is a set of color orthoimages without overlaps, gaps and visible brightness and color differences along the connecting lines. For more information, please see the Slovakia orthophotos documentation orthophoto rgb -
Spain RGB orthophotos 10 cm
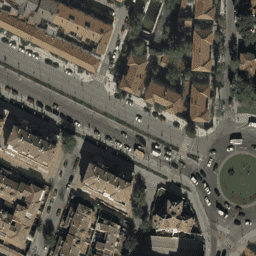
Mosaics of orthophotos from flights carried out between 2007 and 2018 by various public administration bodies at 10cm pixel resolution. This data is provided by National Plan for Aerial Orthophotography Spain (PNOA). For more information, please see the Spain orthophotos documentation orthophoto rgb -
SWISSIMAGE 10 cm RGB imagery
The SWISSIMAGE 10 cm orthophoto mosaic is an assembly of new color digital aerial images over the whole of Switzerland with a ground resolution of 10 cm in the plains and the main alpine valleys and 25 cm in the Alps. It is updated annually. … orthophoto rgb -
Actual Evapotranspiration for Australia (CMRSET Landsat V2.2)
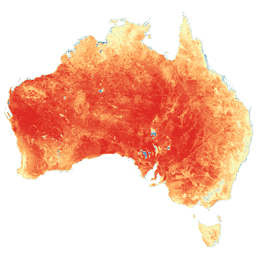
This dataset provides accurate actual evapotranspiration (AET or ETa) for Australia using the CMRSET algorithm. The AET band (named 'ETa') contains the average daily value from the CMRSET model for all cloud-free Landsat observations in that month (indicated with value 3 in the AET Data … agriculture australia csiro evaporation evapotranspiration hydrology -
TIGER: US Census Block Groups (BG) 2010

The United States Census Bureau regularly releases a geodatabase named TIGER. This dataset contains the 2010 census block groups, which is a cluster of blocks within the same census tract that have the same first digit of their four-digit census block number. There are just … census city neighborhood tiger urban us -
TIGER: US Census Blocks
The United States Census Bureau regularly releases a geodatabase named TIGER. This dataset contains the 2010 census blocks, roughly equivalent to a city block. There are just over 11 million polygon features covering the United States, the District of Columbia, Puerto Rico, and the Island … census city neighborhood tiger urban us -
TIGER: US Census Tracts Demographic - Profile 1
The United States Census Bureau regularly releases a geodatabase named TIGER. This table contains the 2010 census Demographic Profile 1 values aggregated by census tract. Tract areas vary tremendously, but in urban areas are roughly equivalent to a neighborhood. There are about 74,000 polygon features … census tiger us -
TIGER: US Census 5-digit ZIP Code Tabulation Areas 2010
ZIP Code tabulation areas (ZCTAs) are approximate area representations of U.S. Postal Service (USPS) 5-digit ZIP Codes. The Census Bureau defines ZCTAs by allocating each Census block that contains addresses to a single ZIP Code tabulation area, usually to the ZCTA that reflects the most … census tiger us -
TIGER: US Census Counties 2016

The United States Census Bureau TIGER dataset contains the 2016 boundaries for primary legal divisions of US states. In most states, these entities are termed "counties". In Louisiana, these divisions are known as "parishes". Alaska has governmental entities called "boroughs" which fill a similar governmental … census county tiger us -
TIGER: US Census Roads
This United States Census Bureau TIGER dataset contains all road segments from the 2016 release, containing more than 19 million individual line features covering the United States, the District of Columbia, Puerto Rico, and the Island Areas. Each feature represents a road segment geometry (a … census roads tiger us -
TIGER: US Census States 2016

The United States Census Bureau TIGER dataset contains the 2016 boundaries for the primary governmental divisions of the United States. In addition to the fifty states, the Census Bureau treats the District of Columbia, Puerto Rico, and each of the island areas (American Samoa, the … census state states tiger us -
TIGER: US Census Counties 2018
The United States Census Bureau TIGER dataset contains the 2018 boundaries for primary legal divisions of US states. In most states, these entities are termed "counties". In Louisiana, these divisions are known as "parishes". Alaska has governmental entities called "boroughs" which fill a similar governmental … census county tiger us -
TIGER: US Census States 2018
The United States Census Bureau TIGER dataset contains the 2018 boundaries for the primary governmental divisions of the United States. In addition to the fifty states, the Census Bureau treats the District of Columbia, Puerto Rico, and each of the island areas (American Samoa, the … census state states tiger us -
TIGER: US Census Block Groups (BG) 2020
The United States Census Bureau regularly releases a geodatabase named TIGER. This dataset contains the 2020 census block groups, which is a cluster of blocks within the same census tract that have the same first digit of their four-digit census block number. There are just … census city neighborhood tiger urban us -
TIGER: 2020 Tabulation (Census) Block
The United States Census Bureau regularly releases a geodatabase named TIGER. This dataset contains the 2020 census blocks, roughly equivalent to a city block. There are just over eight million polygon features covering the United States, the District of Columbia, Puerto Rico, and the Island … census city neighborhood tiger urban us -
TIGER: US Census Tracts
The United States Census Bureau regularly releases a geodatabase named TIGER. This dataset contains the 2020 census tracts. Tract areas vary tremendously, but in urban areas are roughly equivalent to a neighborhood. There are just over 85000 polygon features covering the United States, the District … census city neighborhood tiger urban us -
TOMS and OMI Merged Ozone Data
The Total Ozone Mapping Spectrometer (TOMS) data represent the primary long-term, continuous record of satellite-based observations available for use in monitoring global and regional trends in total ozone over the past 25 years. The data are produced by the Laboratory for Atmospheres at NASA's Goddard … atmosphere climate geophysical nasa ozone -
TRMM 3B42: 3-Hourly Precipitation Estimates
The Tropical Rainfall Measuring Mission (TRMM) is a joint mission between NASA and the Japan Aerospace Exploration Agency (JAXA) designed to monitor and study tropical rainfall. The 34B2 product contains a gridded, TRMM-adjusted, merged infrared precipitation (mm/hr) and RMS precipitation-error estimate, with a 3-hour temporal … 3-hourly climate geophysical jaxa nasa precipitation -
TRMM 3B43: Monthly Precipitation Estimates
This collection is no longer being updated. See IMERG monthly This dataset algorithmically merges microwave data from multiple satellites, including SSMI, SSMIS, MHS, AMSU-B and AMSR-E, each inter-calibrated to the TRMM Combined Instrument. Algorithm 3B43 is executed once per calendar month to produce the single, … climate geophysical jaxa nasa precipitation rainfall -
TUBerlin/BigEarthNet/v1
BigEarthNet is a new large-scale Sentinel-2 benchmark archive, consisting of 590,326 Sentinel-2 image patches. To construct BigEarthNet, 125 Sentinel-2 tiles were acquired between June 2017 and May 2018 over the 10 countries (Austria, Belgium, Finland, Ireland, Kosovo, Lithuania, Luxembourg, Portugal, Serbia, Switzerland) of Europe. All … copernicus sentinel -
DESS China Terrace Map v1
This dataset is a China terrace map at 30 m resolution in 2018. It was developed through supervised pixel-based classification using multisource and multi-temporal data based on the Google Earth Engine platform. The overall accuracy and kappa coefficient achieved 94% and 0.72, respectively. This first … agriculture landcover landuse tsinghua -
Tsinghua FROM-GLC Year of Change to Impervious Surface
This dataset contains annual change information of global impervious surface area from 1985 to 2018 at a 30m resolution. Change from pervious to impervious was determined using a combined approach of supervised classification and temporal consistency checking. Impervious pixels are defined as above 50% impervious. … built tsinghua urban -
CHIRPS Daily: Climate Hazards Group InfraRed Precipitation With Station Data (Version 2.0 Final)

Climate Hazards Group InfraRed Precipitation with Station data (CHIRPS) is a 30+ year quasi-global rainfall dataset. CHIRPS incorporates 0.05° resolution satellite imagery with in-situ station data to create gridded rainfall time series for trend analysis and seasonal drought monitoring. chg climate geophysical precipitation ucsb weather -
CHIRPS Pentad: Climate Hazards Group InfraRed Precipitation With Station Data (Version 2.0 Final)
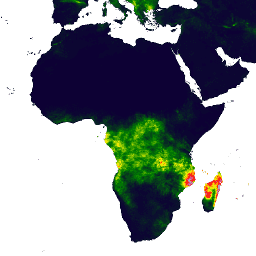
Climate Hazards Group InfraRed Precipitation with Station data (CHIRPS) is a 30+ year quasi-global rainfall dataset. CHIRPS incorporates 0.05° resolution satellite imagery with in-situ station data to create gridded rainfall time series for trend analysis and seasonal drought monitoring. chg climate geophysical precipitation ucsb weather -
England 1m Composite DTM/DSM (Environment Agency)
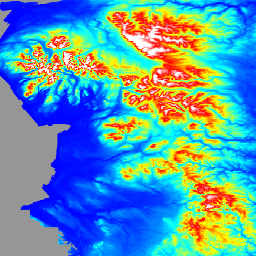
The LIDAR Composite DTM/DSM is a raster terrain model covering ~99% of England at 1m spatial resolution, produced by the UK Environment Agency in 2022. The model contains 3 bands of terrain data: a Digital Terrain Model (DTM), a first return Digital Surface Model (DSM), … dem elevation lidar -
Primary Humid Tropical Forests
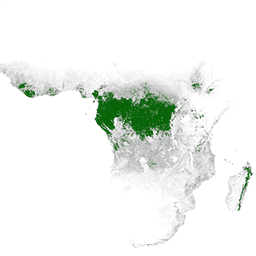
Primary humid tropical forests provide numerous global ecosystem services, but are under continuing threat of clearing from economic drivers. To facilitate national land use planning and balancing the goals of economic development and maintenance of ecosystem services, a primary humid tropical forest map was created … forest global landsat-derived umd -
Hansen Global Forest Change v1.11 (2000-2023)
Results from time-series analysis of Landsat images in characterizing global forest extent and change. The 'first' and 'last' bands are reference multispectral imagery from the first and last available years for Landsat spectral bands corresponding to red, NIR, SWIR1, and SWIR2. Reference composite imagery represents … forest geophysical landsat-derived umd -
ArcticDEM Strips

ArcticDEM is a National Geospatial-Intelligence Agency (NGA) and National Science Foundation (NSF) public-private initiative to automatically produce a high-resolution, high-quality digital surface model (DSM) of the Arctic using optical stereo imagery, high-performance computing, and open source photogrammetry software. It includes vegetation, tree canopy, buildings, and … arctic dem geophysical pgc umn -
ArcticDEM Mosaic
ArcticDEM is a National Geospatial-Intelligence Agency (NGA) and National Science Foundation (NSF) public-private initiative to automatically produce a high-resolution, high-quality digital surface model (DSM) of the Arctic using optical stereo imagery, high-performance computing, and open source photogrammetry software. It includes vegetation, tree canopy, buildings, and … arctic dem geophysical pgc umn -
REMA Strips 2m

The Reference Elevation Model of Antarctica (REMA) is a high resolution, time-stamped Digital Surface Model (DSM) of Antarctica at 2-meter and 8-meter spatial resolutions. Strip DEM files correspond to the overlapping area of the input stereoscopic imagery pair strips as they are collected by DigitalGlobe's … dem geophysical pgc rema umn -
REMA Strips 8m

The Reference Elevation Model of Antarctica (REMA) is a high resolution, time-stamped Digital Surface Model (DSM) of Antarctica at 2-meter and 8-meter spatial resolutions. Strip DEM files correspond to the overlapping area of the input stereoscopic imagery pair strips as they are collected by DigitalGlobe's … dem geophysical pgc rema umn -
REMA Mosaic

The Reference Elevation Model of Antarctica (REMA) is a high resolution, time-stamped Digital Surface Model (DSM) of Antarctica at 2-meter and 8-meter spatial resolutions. Mosaicked DEM files are compiled from multiple strips that have been co-registered, blended, and feathered to reduce edge-matching artifacts. dem geophysical pgc rema umn -
IrrMapper Irrigated Lands, Version 1.2
IrrMapper is an annual classification of irrigation status in the 11 Western United States made at Landsat scale (i.e., 30 m) using the Random Forest algorithm, covering years 1986 - present. While the IrrMapper paper describes classification of four classes (i.e., irrigated, dryland, uncultivated, wetland), … landsat-derived -
Landsat Gross Primary Production CONUS

The Landsat Gross Primary Production (GPP) CONUS dataset estimates GPP using Landsat Surface Reflectance for CONUS. GPP is the amount of carbon captured by plants in an ecosystem and is an essential component in the calculations of Net Primary Production (NPP). GPP is calculated using … 16-day conus gpp gridmet-derived landsat mod17 -
Landsat Net Primary Production CONUS
The Landsat Net Primary Production (NPP) CONUS dataset estimates NPP using Landsat Surface Reflectance for CONUS. NPP is the amount of carbon captured by plants in an ecosystem, after accounting for losses due to respiration. NPP is calculated using the MOD17 algorithm (see MOD17 User … conus gridmet-derived landsat mod17 nlcd-derived npp -
MODIS Gross Primary Production CONUS
The MODIS Gross Primary Production (GPP) CONUS dataset estimates GPP using MODIS Surface Reflectance for CONUS. GPP is the amount of carbon captured by plants in an ecosystem and is an essential component in the calculations of Net Primary Production (NPP). GPP is calculated using … 8-day conus gpp gridmet-derived mod09q1 mod17 -
MODIS Net Primary Production CONUS
The MODIS Net Primary Production (NPP) CONUS dataset estimates NPP using MODIS Surface Reflectance for CONUS. NPP is the amount of carbon captured by plants in an ecosystem, after accounting for losses due to respiration. NPP is calculated using the MOD17 algorithm (see MOD17 User … conus gridmet-derived mod09q1 mod17 modis nlcd-derived -
Murray Global Intertidal Change Data Mask

The Murray Global Intertidal Change Dataset contains global maps of tidal flat ecosystems produced via a supervised classification of 707,528 Landsat Archive images. Each pixel was classified into tidal flat, permanent water or other with reference to a globally distributed set of training data. The … coastal google intertidal landsat-derived murray tidal-flats -
Murray Global Intertidal Change Classification
The Murray Global Intertidal Change Dataset contains global maps of tidal flat ecosystems produced via a supervised classification of 707,528 Landsat Archive images. Each pixel was classified into tidal flat, permanent water or other with reference to a globally distributed set of training data. The … coastal google intertidal landsat-derived murray tidal-flats -
Murray Global Intertidal Change QA Pixel Count

The Murray Global Intertidal Change Dataset contains global maps of tidal flat ecosystems produced via a supervised classification of 707,528 Landsat Archive images. Each pixel was classified into tidal flat, permanent water or other with reference to a globally distributed set of training data. The … coastal google intertidal landsat-derived murray tidal-flats -
NAIP: National Agriculture Imagery Program
The National Agriculture Imagery Program (NAIP) acquires aerial imagery during the agricultural growing seasons in the continental U.S. NAIP projects are contracted each year based upon available funding and the imagery acquisition cycle. Beginning in 2003, NAIP was acquired on a 5-year cycle. 2008 was … agriculture highres imagery usda -
USDA NASS Cropland Data Layers
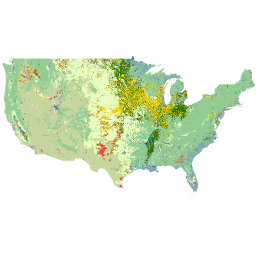
The Cropland Data Layer (CDL) is a crop-specific land cover data layer created annually for the continental United States using moderate resolution satellite imagery and extensive agricultural ground truth. The CDL is created by the USDA, National Agricultural Statistics Service (NASS), Research and Development Division, … cropland landcover usda -
LSIB 2017: Large Scale International Boundary Polygons, Detailed

The United States Office of the Geographer provides the Large Scale International Boundary (LSIB) dataset. It is derived from two other datasets: a LSIB line vector file and the World Vector Shorelines (WVS) from the National Geospatial-Intelligence Agency (NGA). The interior boundaries reflect U.S. government … borders countries dos political usdos -
LSIB 2017: Large Scale International Boundary Polygons, Simplified
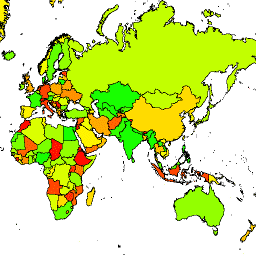
The United States Office of the Geographer provides the Large Scale International Boundary (LSIB) dataset. The detailed version (2013) is derived from two other datasets: a LSIB line vector file and the World Vector Shorelines (WVS) from the National Geospatial-Intelligence Agency (NGA). The interior boundaries … borders countries dos political usdos -
USFS Landscape Change Monitoring System version (CONUS and OCONUS)
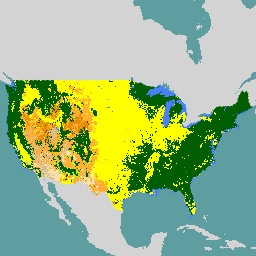
This product is part of the Landscape Change Monitoring System (LCMS) data suite. It shows LCMS-modeled change, land cover, and/or land use classes for each year that covers the Conterminous United States (CONUS) and Southeastern Alaska, Hawaii and Puerto Rico-US Virgin Islands (OCONUS). Hawaii and … change-detection forest gtac landcover landsat landuse -
Monitoring Trends in Burn Severity (MTBS) Burn Severity Images
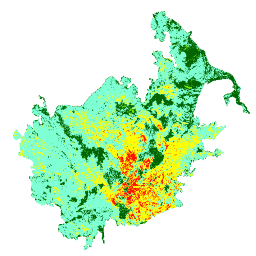
The burn severity mosaics consist of thematic raster images of MTBS burn severity classes for all currently completed MTBS fires for the continental United States, Alaska, Hawaii and Puerto Rico. Mosaicked burn severity images are compiled annually for each year by US State and the … eros fire forest gtac landcover landsat-derived -
MTBS Burned Area Boundaries
The Monitoring Trends in Burn Severity (MTBS) burned area boundaries dataset contains the extent polygons of the burned areas of all currently completed MTBS fires for the continental United States, Alaska, Hawaii, and Puerto Rico. Below NBR stands for "Normalized Burn Ratio", while dNBR stands … eros fire gtac mtbs usda usfs -
USFS TreeMap v2016 (Conterminous United States)
This product is part of the TreeMap data suite. It provides detailed spatial information on forest characteristics including number of live and dead trees, biomass, and carbon across the entire forested extent of the continental United States in 2016. TreeMap v2016 contains one image, a … biomass carbon climate-change conus forest gtac -
USGS 3DEP 10m National Map Seamless (1/3 Arc-Second)
This is the seamless 3DEP DEM dataset for the U.S. with full coverage of the 48 conterminous states, Hawaii, and U.S. territories. Alaska coverage is partially available now and is being expanded to statewide coverage as part of the Alaska Mapping Initiative. Ground spacing is … 3dep dem elevation geophysical topography usgs -
USGS 3DEP National Map Spatial Metadata 1/3 Arc-Second (10m)
This is a table with metadata for the 3DEP 10m DEM asset. The Work unit Extent Spatial Metadata (WESM) contains current lidar data availability and basic information about lidar projects, including lidar quality level, data acquisition dates, and links to project-level metadata. See more details … 3dep usgs -
USGS 3DEP 1m National Map
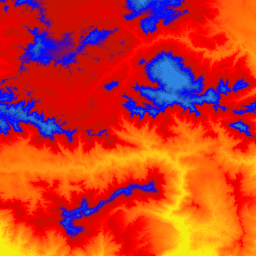
This is a tiled collection of images with 1m pixel size from the 3D Elevation Program (3DEP). The 3DEP data holdings serve as the elevation layer of The National Map and provide foundational elevation information for earth science studies and mapping applications in the United … 3dep dem elevation geophysical topography usgs -
USGS GAP Alaska 2001
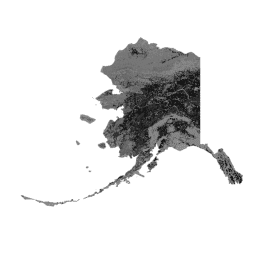
The GAP/LANDFIRE National Terrestrial Ecosystems data represents a detailed vegetation and land cover classification for the Conterminous U.S., Alaska, Hawaii, and Puerto Rico.GAP/LF 2011 Ecosystems for the Conterminous U.S. is an update of the National Gap Analysis Program Land Cover Data - Version 2.2. Alaska … gap landcover landfire usgs vegetation -
USGS GAP CONUS 2011
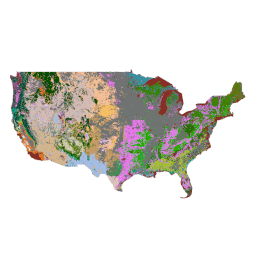
The GAP/LANDFIRE National Terrestrial Ecosystems data represents a detailed vegetation and land cover classification for the Conterminous U.S., Alaska, Hawaii, and Puerto Rico.GAP/LF 2011 Ecosystems for the Conterminous U.S. is an update of the National Gap Analysis Program Land Cover Data - Version 2.2. Alaska … gap landcover landfire usgs vegetation -
USGS GAP Hawaii 2001
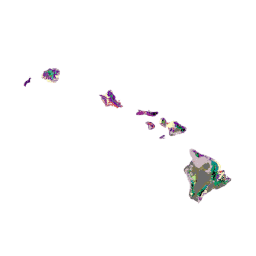
The GAP/LANDFIRE National Terrestrial Ecosystems data represents a detailed vegetation and land cover classification for the Conterminous U.S., Alaska, Hawaii, and Puerto Rico.GAP/LF 2011 Ecosystems for the Conterminous U.S. is an update of the National Gap Analysis Program Land Cover Data - Version 2.2. Alaska … gap landcover landfire usgs vegetation -
Designation: USGS GAP PAD-US v2.0
PAD-US is America's official national inventory of U.S. terrestrial and marine protected areas that are dedicated to the preservation of biological diversity and to other natural, recreation and cultural uses, managed for these purposes through legal or other effective means. This database is separated into … conservation-easements designation management ownership protected-areas public-lands -
Easement: USGS GAP PAD-US v2.0
PAD-US is America's official national inventory of U.S. terrestrial and marine protected areas that are dedicated to the preservation of biological diversity and to other natural, recreation and cultural uses, managed for these purposes through legal or other effective means. This database is separated into … conservation-easements designation management ownership protected-areas public-lands -
Fee: USGS GAP PAD-US v2.0
PAD-US is America's official national inventory of U.S. terrestrial and marine protected areas that are dedicated to the preservation of biological diversity and to other natural, recreation and cultural uses, managed for these purposes through legal or other effective means. This database is separated into … conservation-easements designation management ownership protected-areas public-lands -
Proclamation: USGS GAP PAD-US v2.0
PAD-US is America's official national inventory of U.S. terrestrial and marine protected areas that are dedicated to the preservation of biological diversity and to other natural, recreation and cultural uses, managed for these purposes through legal or other effective means. This database is separated into … conservation-easements designation management ownership protected-areas public-lands -
USGS GAP Puerto Rico 2001
The GAP/LANDFIRE National Terrestrial Ecosystems data represents a detailed vegetation and land cover classification for the Conterminous U.S., Alaska, Hawaii, and Puerto Rico.GAP/LF 2011 Ecosystems for the Conterminous U.S. is an update of the National Gap Analysis Program Land Cover Data - Version 2.2. Alaska … gap landcover landfire usgs vegetation -
GFSAD1000: Cropland Extent 1km Multi-Study Crop Mask, Global Food-Support Analysis Data
The GFSAD is a NASA-funded project to provide high-resolution global cropland data and their water use that contributes towards global food security in the twenty-first century. The GFSAD products are derived through multi-sensor remote sensing data (e.g., Landsat, MODIS, AVHRR), secondary data, and field-plot data … crop cropland landcover usgs -
GMTED2010: Global Multi-resolution Terrain Elevation Data 2010
The Global Multi-resolution Terrain Elevation Data 2010 (GMTED2010) dataset contains elevation data for the globe collected from various sources at 7.5 arc-seconds resolution. More details are available in the dataset report. The primary source dataset for GMTED2010 is NGA''s SRTM Digital Terrain Elevation Data (DTED®, … dem elevation geophysical srtm topography usgs -
GTOPO30: Global 30 Arc-Second Elevation
GTOPO30 is a global digital elevation model (DEM) with a horizontal grid spacing of 30 arc seconds (approximately 1 kilometer). The DEM was derived from several raster and vector sources of topographic information. Completed in late 1996, GTOPO30 was developed over a three-year period through … dem elevation geophysical nasa topography usgs -
Landsat Image Mosaic of Antarctica (LIMA) 16-Bit Pan-Sharpened Mosaic

The Landsat Image Mosaic of Antarctica (LIMA) is a seamless and virtually cloudless mosaic created from processed Landsat 7 ETM+ scenes. This LIMA dataset is the 16-bit Intermediate LIMA. The mosaic consists of pan-sharpened normalized surface reflectance scenes (Landsat ETM+ bands 1, 2, 3, and … antarctica ice landsat-derived lima mosaic sr -
Landsat Image Mosaic of Antarctica (LIMA) - Processed Landsat Scenes (16 bit)
The Landsat Image Mosaic of Antarctica (LIMA) is a seamless and virtually cloudless mosaic created from processed Landsat 7 ETM+ scenes. Processed Landsat Scenes (16 bit) are Level 1Gt NLAPS scenes converted to 16 bit, processed with sun-angle correction, and converted to reflectance values (Bindschadler … antarctica ice landsat-derived lima mosaic sr -
Landsat Image Mosaic of Antarctica (LIMA) - Processed Landsat Scenes (16 bit) Metadata
The Landsat Image Mosaic of Antarctica (LIMA) is a seamless and virtually cloudless mosaic created from processed Landsat 7 ETM+ scenes. Processed Landsat Scenes (16 bit) are Level 1Gt NLAPS scenes converted to 16 bit, processed with sun-angle correction, and converted to reflectance values (Bindschadler … antarctica ice landsat-derived lima mosaic sr -
NLCD 2019: USGS National Land Cover Database, 2019 release
NLCD (the National Land Cover Database) is a 30-m Landsat-based land cover database spanning 8 epochs (2001, 2004, 2006, 2008, 2011, 2013, 2016, and 2019). A ninth epoch for 2021 is also available here. The images rely on the imperviousness data layer for the urban … blm landcover mrlc nlcd usgs -
Land Cover of North America at 30 meters, 2020
The 2020 North American Land Cover 30-meter dataset was produced as part of the North American Land Change Monitoring System (NALCMS), a trilateral effort between Natural Resources Canada, the United States Geological Survey, and three Mexican organizations including the National Institute of Statistics and Geography … landcover landsat nlcd reflectance -
NLCD 2021: USGS National Land Cover Database, 2021 release
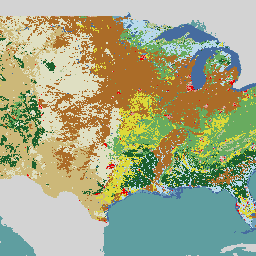
The U.S. Geological Survey (USGS), in partnership with several federal agencies, has now developed and released seven National Land Cover Database (NLCD) products: NLCD 1992, 2001, 2006, 2011, 2016, 2019, and 2021. Beginning with the 2016 release, land cover products were created for two-to-three-year intervals … blm landcover mrlc nlcd usgs -
USFS Tree Canopy Cover v2021-4 (CONUS and OCONUS)
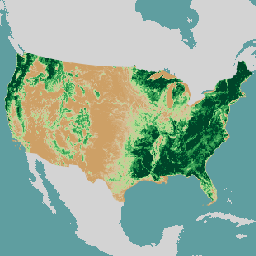
This product is part of the Tree Canopy Cover (TCC) data suite. It includes modeled TCC, standard error (SE), and National Land Cover Database's (NLCD) TCC data for each year. TCC data produced by the the United States Department of Agriculture, Forest Service (USFS) are … forest gtac landsat-derived redcastle-resources sentinel2-derived time-series -
RCMAP Rangeland Component Timeseries (1985-2023), v06
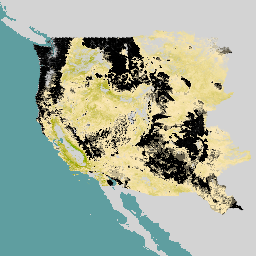
'The RCMAP (Rangeland Condition Monitoring Assessment and Projection) dataset quantifies the percent cover of rangeland components across western North America using Landsat imagery from 1985-2023. The RCMAP product suite consists of ten fractional components: annual herbaceous, bare ground, herbaceous, litter, non-sagebrush shrub, perennial herbaceous, sagebrush, … climate-change disturbance landsat-derived nlcd rangeland trends -
RCMAP Rangeland Trends for Component Timeseries (1985-2023), v06
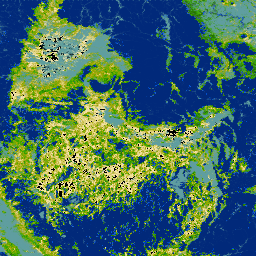
The RCMAP (Rangeland Condition Monitoring Assessment and Projection) dataset quantifies the percent cover of rangeland components across western North America using Landsat imagery from 1985-2023. The RCMAP product suite consists of ten fractional components: annual herbaceous, bare ground, herbaceous, litter, non-sagebrush shrub, perennial herbaceous, sagebrush, … climate-change disturbance landsat-derived nlcd rangeland trends -
RCMAP Rangeland Trends Year for Component Timeseries (1985-2023), v06
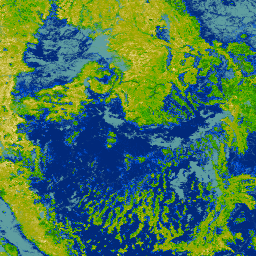
This collection includes RCMAP yearly products from 1985 through 2023. The RCMAP (Rangeland Condition Monitoring Assessment and Projection) dataset quantifies the percent cover of rangeland components across western North America using Landsat imagery from 1985-2023. The RCMAP product suite consists of ten fractional components: annual … climate-change disturbance landsat-derived nlcd rangeland trends -
NASA SRTM Digital Elevation 30m
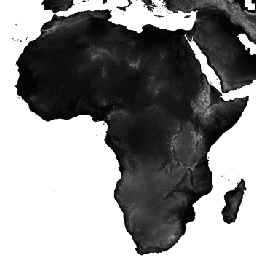
The Shuttle Radar Topography Mission (SRTM, see Farr et al. 2007) digital elevation data is an international research effort that obtained digital elevation models on a near-global scale. This SRTM V3 product (SRTM Plus) is provided by NASA JPL at a resolution of 1 arc-second … dem elevation geophysical nasa srtm topography -
HUC02: USGS Watershed Boundary Dataset of Regions
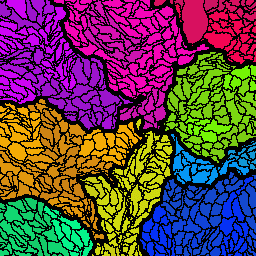
The Watershed Boundary Dataset (WBD) is a comprehensive aggregated collection of hydrologic unit (HU) data consistent with the national criteria for delineation and resolution. It defines the areal extent of surface water drainage to a point except in coastal or lake front areas where there … hydrology usgs water watershed wbd -
HUC04: USGS Watershed Boundary Dataset of Subregions

The Watershed Boundary Dataset (WBD) is a comprehensive aggregated collection of hydrologic unit (HU) data consistent with the national criteria for delineation and resolution. It defines the areal extent of surface water drainage to a point except in coastal or lake front areas where there … hydrology usgs water watershed wbd -
HUC06: USGS Watershed Boundary Dataset of Basins

The Watershed Boundary Dataset (WBD) is a comprehensive aggregated collection of hydrologic unit (HU) data consistent with the national criteria for delineation and resolution. It defines the areal extent of surface water drainage to a point except in coastal or lake front areas where there … hydrology usgs water watershed wbd -
HUC08: USGS Watershed Boundary Dataset of Subbasins

The Watershed Boundary Dataset (WBD) is a comprehensive aggregated collection of hydrologic unit (HU) data consistent with the national criteria for delineation and resolution. It defines the areal extent of surface water drainage to a point except in coastal or lake front areas where there … hydrology usgs water watershed wbd -
HUC10: USGS Watershed Boundary Dataset of Watersheds

The Watershed Boundary Dataset (WBD) is a comprehensive aggregated collection of hydrologic unit (HU) data consistent with the national criteria for delineation and resolution. It defines the areal extent of surface water drainage to a point except in coastal or lake front areas where there … hydrology usgs water watershed wbd -
HUC12: USGS Watershed Boundary Dataset of Subwatersheds

The Watershed Boundary Dataset (WBD) is a comprehensive aggregated collection of hydrologic unit (HU) data consistent with the national criteria for delineation and resolution. It defines the areal extent of surface water drainage to a point except in coastal or lake front areas where there … hydrology usgs water watershed wbd -
KBDI: Keetch-Byram Drought Index
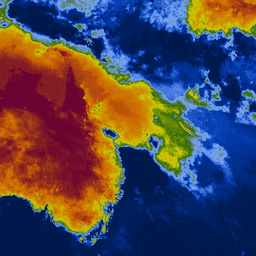
Keetch-Byram Drought Index (KBDI) is a continuous reference scale for estimating the dryness of the soil and duff layers. The index increases for each day without rain (the amount of increase depends on the daily high temperature) and decreases when it rains. This system is … drought rainfall -
PROBA-V C1 Top Of Canopy Daily Synthesis 100m
Proba-V is a satellite mission tasked to map land cover and vegetation growth. It was designed to provide continuity for the VGT optical instrument from the SPOT-4 and SPOT-5 missions. The sensor collects data in three VNIR (visible and near-infrared) bands and one SWIR (short-wave … esa multispectral nir proba probav swir -
PROBA-V C1 Top Of Canopy Daily Synthesis 333m

Proba-V is a satellite mission tasked to map land cover and vegetation growth. It was designed to provide continuity for the VGT optical instrument from the SPOT-4 and SPOT-5 missions. The sensor collects data in three VNIR (visible and near-infrared) bands and one SWIR (short-wave … esa multispectral nir proba probav swir -
WDPA: World Database on Protected Areas (points)
The World Database on Protected Areas (WDPA) is the most up-to-date and complete source of information on protected areas, updated monthly with submissions from governments, non-governmental organizations, landowners, and communities. It is managed by the United Nations Environment Programme's World Conservation Monitoring Centre (UNEP-WCMC) with … boundaries iucn marine mpa protected wcmc -
WDPA: World Database on Protected Areas (polygons)
The World Database on Protected Areas (WDPA) is the most up-to-date and complete source of information on protected areas, updated monthly with submissions from governments, non-governmental organizations, landowners, and communities. It is managed by the United Nations Environment Programme's World Conservation Monitoring Centre (UNEP-WCMC) with … boundaries iucn marine mpa protected wcmc -
WCMC Above and Below Ground Biomass Carbon Density
This dataset represents above- and below-ground terrestrial carbon storage (tonnes (t) of C per hectare (ha)) for circa 2010. The dataset was constructed by combining the most reliable publicly available datasets and overlaying them with the ESA CCI landcover map for the year 2010 (ESA, … biomass carbon wcmc -
WHRC Pantropical National Level Carbon Stock Dataset
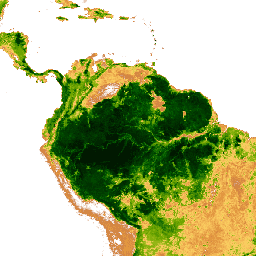
A national-level map of above-ground live woody biomass density for tropical countries at 500m. This dataset was assembled from a combination of co-located field measurements, LiDAR observations, and imagery recorded from the Moderate Resolution Imaging Spectroradiometer (MODIS). aboveground biomass carbon geophysical umd -
geoBoundaries: Political administrative boundaries at Country level (ADM0), v6.0.0
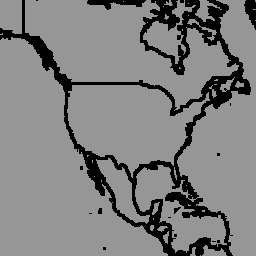
The geoBoundaries Global Database of Political Administrative Boundaries Database is an online, open license resource of boundaries (i.e., state, county) for every country in the world. Currently 199 total entities are tracked, including all 195 UN member states, Greenland, Taiwan, Niue, and Kosovo. Comprehensive Global … borders countries -
geoBoundaries: Political administrative boundaries at District level (ADM1), v6.0.0
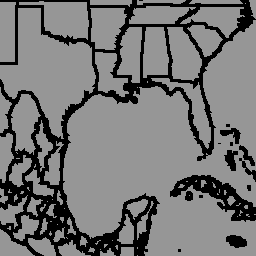
The geoBoundaries Global Database of Political Administrative Boundaries Database is an online, open license resource of boundaries (i.e., state, county) for every country in the world. Currently 199 total entities are tracked, including all 195 UN member states, Greenland, Taiwan, Niue, and Kosovo. Comprehensive Global … borders countries -
geoBoundaries: Political administrative boundaries at Municipality level (ADM2), v6.0.0
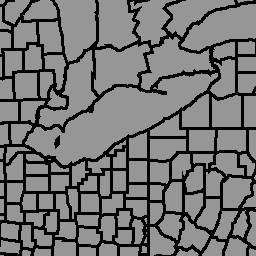
The geoBoundaries Global Database of Political Administrative Boundaries Database is an online, open license resource of boundaries (i.e., state, county) for every country in the world. Currently 199 total entities are tracked, including all 195 UN member states, Greenland, Taiwan, Niue, and Kosovo. Comprehensive Global … borders countries -
WorldClim BIO Variables V1
WorldClim V1 Bioclim provides bioclimatic variables that are derived from the monthly temperature and rainfall in order to generate more biologically meaningful values. The bioclimatic variables represent annual trends (e.g., mean annual temperature, annual precipitation), seasonality (e.g., annual range in temperature and precipitation), and extreme … berkeley climate monthly precipitation temperature weather -
WorldClim Climatology V1

WorldClim version 1 has average monthly global climate data for minimum, mean, and maximum temperature and for precipitation. WorldClim version 1 was developed by Robert J. Hijmans, Susan Cameron, and Juan Parra, at the Museum of Vertebrate Zoology, University of California, Berkeley, in collaboration with … berkeley climate monthly precipitation temperature weather -
WRI Aqueduct Floods Hazard Maps Version 2
Aqueduct Floods data measures riverine and coastal food risks under both current baseline conditions and future projections in 2030, 2050, and 2080. In addition to providing hazard maps and assessing risks, Aqueduct Floods helps to conduct comprehensive cost-benefit analysis to evaluate the value of dike … flood monitoring wri -
FORMA Alerts
NOTE from WRI: WRI decided to stop updating FORMA alerts. The goal was to simplify the Global Forest Watch user experience and reduce redundancy. We found that Terra-i and GLAD were more frequently used. Moreover, using GLAD as a standard, found that Terra-i outperformed FORMA … daily deforestation forest forma gfw modis -
FORMA Raw Output FIRMS
NOTE from WRI: WRI decided to stop updating FORMA alerts. The goal was to simplify the Global Forest Watch user experience and reduce redundancy. We found that Terra-i and GLAD were more frequently used. Moreover, using GLAD as a standard, found that Terra-i outperformed FORMA … daily deforestation forest forma gfw modis -
FORMA Raw Output NDVI
NOTE from WRI: WRI decided to stop updating FORMA alerts. The goal was to simplify the Global Forest Watch user experience and reduce redundancy. We found that Terra-i and GLAD were more frequently used. Moreover, using GLAD as a standard, found that Terra-i outperformed FORMA … daily deforestation forest forma gfw modis -
FORMA Alert Thresholds
NOTE from WRI: WRI decided to stop updating FORMA alerts. The goal was to simplify the Global Forest Watch user experience and reduce redundancy. We found that Terra-i and GLAD were more frequently used. Moreover, using GLAD as a standard, found that Terra-i outperformed FORMA … daily deforestation forest forma gfw modis -
FORMA Vegetation T-Statistics
NOTE from WRI: WRI decided to stop updating FORMA alerts. The goal was to simplify the Global Forest Watch user experience and reduce redundancy. We found that Terra-i and GLAD were more frequently used. Moreover, using GLAD as a standard, found that Terra-i outperformed FORMA … daily deforestation forest forma gfw modis -
Global Power Plant Database
The Global Power Plant Database is a comprehensive, open source database of power plants around the world. It centralizes power plant data to make it easier to navigate, compare and draw insights. Each power plant is geolocated and entries contain information on plant capacity, generation, … climate wri -
WWF HydroATLAS Basins Level 03
BasinATLAS is a component of the HydroATLAS database, which is a component of HydroSHEDS. BasinATLAS provides a standardized compendium of hydro-environmental attribute information for all watersheds of the world at high spatial resolution. This dataset includes data for 56 variables, partitioned into 281 attributes and … geophysical hydroatlas hydrography hydrology hydrosheds srtm -
WWF HydroATLAS Basins Level 04
BasinATLAS is a component of the HydroATLAS database, which is a component of HydroSHEDS. BasinATLAS provides a standardized compendium of hydro-environmental attribute information for all watersheds of the world at high spatial resolution. This dataset includes data for 56 variables, partitioned into 281 attributes and … geophysical hydroatlas hydrography hydrology hydrosheds srtm -
WWF HydroATLAS Basins Level 05
BasinATLAS is a component of the HydroATLAS database, which is a component of HydroSHEDS. BasinATLAS provides a standardized compendium of hydro-environmental attribute information for all watersheds of the world at high spatial resolution. This dataset includes data for 56 variables, partitioned into 281 attributes and … geophysical hydroatlas hydrography hydrology hydrosheds srtm -
WWF HydroATLAS Basins Level 06
BasinATLAS is a component of the HydroATLAS database, which is a component of HydroSHEDS. BasinATLAS provides a standardized compendium of hydro-environmental attribute information for all watersheds of the world at high spatial resolution. This dataset includes data for 56 variables, partitioned into 281 attributes and … geophysical hydroatlas hydrography hydrology hydrosheds srtm -
WWF HydroATLAS Basins Level 07
BasinATLAS is a component of the HydroATLAS database, which is a component of HydroSHEDS. BasinATLAS provides a standardized compendium of hydro-environmental attribute information for all watersheds of the world at high spatial resolution. This dataset includes data for 56 variables, partitioned into 281 attributes and … geophysical hydroatlas hydrography hydrology hydrosheds srtm -
WWF HydroATLAS Basins Level 08
BasinATLAS is a component of the HydroATLAS database, which is a component of HydroSHEDS. BasinATLAS provides a standardized compendium of hydro-environmental attribute information for all watersheds of the world at high spatial resolution. This dataset includes data for 56 variables, partitioned into 281 attributes and … geophysical hydroatlas hydrography hydrology hydrosheds srtm -
WWF HydroATLAS Basins Level 09
BasinATLAS is a component of the HydroATLAS database, which is a component of HydroSHEDS. BasinATLAS provides a standardized compendium of hydro-environmental attribute information for all watersheds of the world at high spatial resolution. This dataset includes data for 56 variables, partitioned into 281 attributes and … geophysical hydroatlas hydrography hydrology hydrosheds srtm -
WWF HydroATLAS Basins Level 10
BasinATLAS is a component of the HydroATLAS database, which is a component of HydroSHEDS. BasinATLAS provides a standardized compendium of hydro-environmental attribute information for all watersheds of the world at high spatial resolution. This dataset includes data for 56 variables, partitioned into 281 attributes and … geophysical hydroatlas hydrography hydrology hydrosheds srtm -
WWF HydroATLAS Basins Level 11
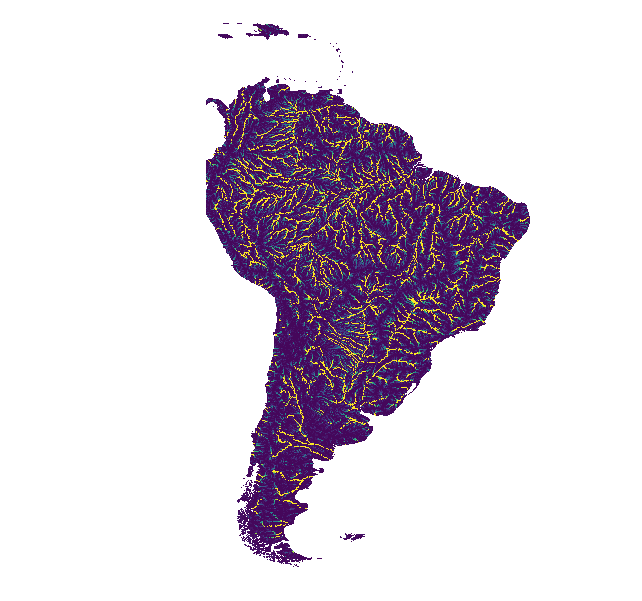
BasinATLAS is a component of the HydroATLAS database, which is a component of HydroSHEDS. BasinATLAS provides a standardized compendium of hydro-environmental attribute information for all watersheds of the world at high spatial resolution. This dataset includes data for 56 variables, partitioned into 281 attributes and … geophysical hydroatlas hydrography hydrology hydrosheds srtm -
WWF HydroATLAS Basins Level 12
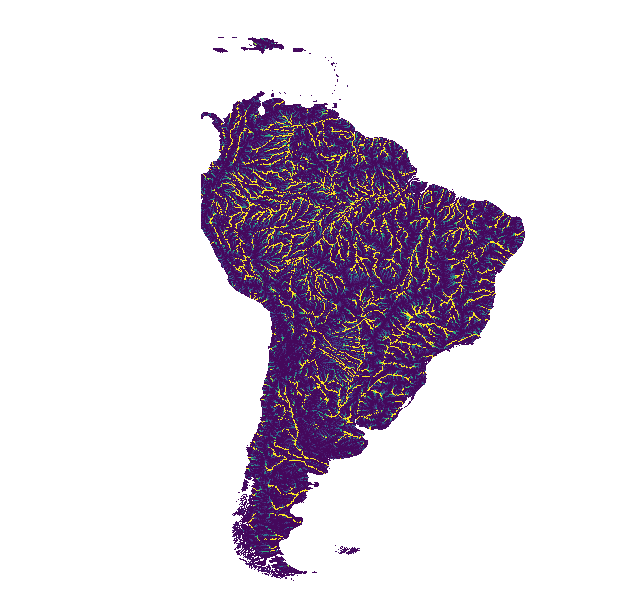
BasinATLAS is a component of the HydroATLAS database, which is a component of HydroSHEDS. BasinATLAS provides a standardized compendium of hydro-environmental attribute information for all watersheds of the world at high spatial resolution. This dataset includes data for 56 variables, partitioned into 281 attributes and … geophysical hydroatlas hydrography hydrology hydrosheds srtm -
WWF HydroSHEDS Hydrologically Conditioned DEM, 3 Arc-Seconds
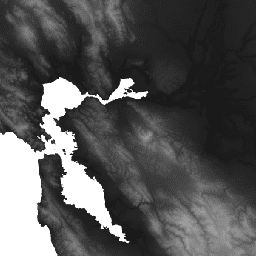
HydroSHEDS is a mapping product that provides hydrographic information for regional and global-scale applications in a consistent format. It offers a suite of geo-referenced datasets (vector and raster) at various scales, including river networks, watershed boundaries, drainage directions, and flow accumulations. HydroSHEDS is based on … conditioned dem elevation geophysical hydrography hydrology -
WWF HydroSHEDS Drainage Direction, 3 Arc-Seconds
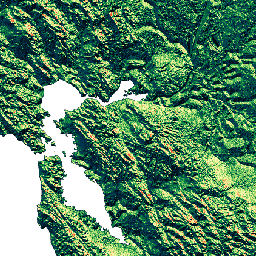
HydroSHEDS is a mapping product that provides hydrographic information for regional and global-scale applications in a consistent format. It offers a suite of geo-referenced datasets (vector and raster) at various scales, including river networks, watershed boundaries, drainage directions, and flow accumulations. HydroSHEDS is based on … direction drainage flow geophysical hydrography hydrology -
WWF HydroSHEDS Void-Filled DEM, 3 Arc-Seconds
HydroSHEDS is a mapping product that provides hydrographic information for regional and global-scale applications in a consistent format. It offers a suite of geo-referenced datasets (vector and raster) at various scales, including river networks, watershed boundaries, drainage directions, and flow accumulations. HydroSHEDS is based on … dem elevation geophysical hydrography hydrology hydrosheds -
WWF HydroSHEDS Flow Accumulation, 15 Arc-Seconds
HydroSHEDS is a mapping product that provides hydrographic information for regional and global-scale applications in a consistent format. It offers a suite of geo-referenced datasets (vector and raster) at various scales, including river networks, watershed boundaries, drainage directions, and flow accumulations. HydroSHEDS is based on … accumulation drainage flow geophysical hydrography hydrology -
WWF HydroSHEDS Hydrologically Conditioned DEM, 15 Arc-Seconds
HydroSHEDS is a mapping product that provides hydrographic information for regional and global-scale applications in a consistent format. It offers a suite of geo-referenced datasets (vector and raster) at various scales, including river networks, watershed boundaries, drainage directions, and flow accumulations. HydroSHEDS is based on … conditioned dem elevation geophysical hydrography hydrology -
WWF HydroSHEDS Drainage Direction, 15 Arc-Seconds
HydroSHEDS is a mapping product that provides hydrographic information for regional and global-scale applications in a consistent format. It offers a suite of geo-referenced datasets (vector and raster) at various scales, including river networks, watershed boundaries, drainage directions, and flow accumulations. HydroSHEDS is based on … direction drainage flow geophysical hydrography hydrology -
WWF HydroSHEDS Flow Accumulation, 30 Arc-Seconds
HydroSHEDS is a mapping product that provides hydrographic information for regional and global-scale applications in a consistent format. It offers a suite of geo-referenced datasets (vector and raster) at various scales, including river networks, watershed boundaries, drainage directions, and flow accumulations. HydroSHEDS is based on … accumulation drainage flow geophysical hydrography hydrology -
WWF HydroSHEDS Hydrologically Conditioned DEM, 30 Arc-Seconds
HydroSHEDS is a mapping product that provides hydrographic information for regional and global-scale applications in a consistent format. It offers a suite of geo-referenced datasets (vector and raster) at various scales, including river networks, watershed boundaries, drainage directions, and flow accumulations. HydroSHEDS is based on … conditioned dem elevation geophysical hydrography hydrology -
WWF HydroSHEDS Drainage Direction, 30 Arc-Seconds
HydroSHEDS is a mapping product that provides hydrographic information for regional and global-scale applications in a consistent format. It offers a suite of geo-referenced datasets (vector and raster) at various scales, including river networks, watershed boundaries, drainage directions, and flow accumulations. HydroSHEDS is based on … direction drainage flow geophysical hydrography hydrology -
WWF HydroSHEDS Basins Level 1

HydroSHEDS is a mapping product that provides hydrographic information for regional and global-scale applications in a consistent format. It offers a suite of geo-referenced datasets (vector and raster) at various scales, including river networks, watershed boundaries, drainage directions, and flow accumulations. HydroSHEDS is based on … geophysical hydrography hydrology hydrosheds srtm water -
WWF HydroSHEDS Basins Level 10

HydroSHEDS is a mapping product that provides hydrographic information for regional and global-scale applications in a consistent format. It offers a suite of geo-referenced datasets (vector and raster) at various scales, including river networks, watershed boundaries, drainage directions, and flow accumulations. HydroSHEDS is based on … geophysical hydrography hydrology hydrosheds srtm water -
WWF HydroSHEDS Basins Level 11

HydroSHEDS is a mapping product that provides hydrographic information for regional and global-scale applications in a consistent format. It offers a suite of geo-referenced datasets (vector and raster) at various scales, including river networks, watershed boundaries, drainage directions, and flow accumulations. HydroSHEDS is based on … geophysical hydrography hydrology hydrosheds srtm water -
WWF HydroSHEDS Basins Level 12

HydroSHEDS is a mapping product that provides hydrographic information for regional and global-scale applications in a consistent format. It offers a suite of geo-referenced datasets (vector and raster) at various scales, including river networks, watershed boundaries, drainage directions, and flow accumulations. HydroSHEDS is based on … geophysical hydrography hydrology hydrosheds srtm water -
WWF HydroSHEDS Basins Level 2

HydroSHEDS is a mapping product that provides hydrographic information for regional and global-scale applications in a consistent format. It offers a suite of geo-referenced datasets (vector and raster) at various scales, including river networks, watershed boundaries, drainage directions, and flow accumulations. HydroSHEDS is based on … geophysical hydrography hydrology hydrosheds srtm water -
WWF HydroSHEDS Basins Level 3

HydroSHEDS is a mapping product that provides hydrographic information for regional and global-scale applications in a consistent format. It offers a suite of geo-referenced datasets (vector and raster) at various scales, including river networks, watershed boundaries, drainage directions, and flow accumulations. HydroSHEDS is based on … geophysical hydrography hydrology hydrosheds srtm water -
WWF HydroSHEDS Basins Level 4

HydroSHEDS is a mapping product that provides hydrographic information for regional and global-scale applications in a consistent format. It offers a suite of geo-referenced datasets (vector and raster) at various scales, including river networks, watershed boundaries, drainage directions, and flow accumulations. HydroSHEDS is based on … geophysical hydrography hydrology hydrosheds srtm water -
WWF HydroSHEDS Basins Level 5

HydroSHEDS is a mapping product that provides hydrographic information for regional and global-scale applications in a consistent format. It offers a suite of geo-referenced datasets (vector and raster) at various scales, including river networks, watershed boundaries, drainage directions, and flow accumulations. HydroSHEDS is based on … geophysical hydrography hydrology hydrosheds srtm water -
WWF HydroSHEDS Basins Level 6

HydroSHEDS is a mapping product that provides hydrographic information for regional and global-scale applications in a consistent format. It offers a suite of geo-referenced datasets (vector and raster) at various scales, including river networks, watershed boundaries, drainage directions, and flow accumulations. HydroSHEDS is based on … geophysical hydrography hydrology hydrosheds srtm water -
WWF HydroSHEDS Basins Level 7

HydroSHEDS is a mapping product that provides hydrographic information for regional and global-scale applications in a consistent format. It offers a suite of geo-referenced datasets (vector and raster) at various scales, including river networks, watershed boundaries, drainage directions, and flow accumulations. HydroSHEDS is based on … geophysical hydrography hydrology hydrosheds srtm water -
WWF HydroSHEDS Basins Level 8

HydroSHEDS is a mapping product that provides hydrographic information for regional and global-scale applications in a consistent format. It offers a suite of geo-referenced datasets (vector and raster) at various scales, including river networks, watershed boundaries, drainage directions, and flow accumulations. HydroSHEDS is based on … geophysical hydrography hydrology hydrosheds srtm water -
WWF HydroSHEDS Basins Level 9
HydroSHEDS is a mapping product that provides hydrographic information for regional and global-scale applications in a consistent format. It offers a suite of geo-referenced datasets (vector and raster) at various scales, including river networks, watershed boundaries, drainage directions, and flow accumulations. HydroSHEDS is based on … geophysical hydrography hydrology hydrosheds srtm water -
WWF HydroSHEDS Free Flowing Rivers Network v1
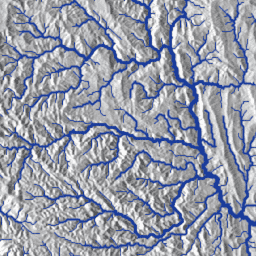
HydroSHEDS is a mapping product that provides hydrographic information for regional and global-scale applications in a consistent format. It offers a suite of geo-referenced datasets (vector and raster) at various scales, including river networks, watershed boundaries, drainage directions, and flow accumulations. HydroSHEDS is based on … geophysical hydrography hydrology hydrosheds srtm water -
WorldPop Global Project Population Data: Estimated Residential Population per 100x100m Grid Square

Global high-resolution, contemporary data on human population distributions are a prerequisite for the accurate measurement of the impacts of population growth, for monitoring changes, and for planning interventions. The WorldPop project aims to meet these needs through the provision of detailed and open access population … demography population worldpop -
WorldPop Global Project Population Data: Estimated Age and Sex Structures of Residential Population per 100x100m Grid Square
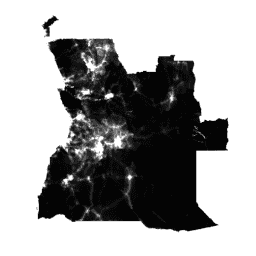
Global high-resolution, contemporary data on human population distributions are a prerequisite for the accurate measurement of the impacts of population growth, for monitoring changes, and for planning interventions. The WorldPop project aims to meet these needs through the provision of detailed and open access population … demography population worldpop -
WorldPop Global Project Population Data: Constrained Estimated Age and Sex Structures of Residential Population per 100x100m Grid Square

Global high-resolution, contemporary data on human population distributions are a prerequisite for the accurate measurement of the impacts of population growth, for monitoring changes, and for planning interventions. The WorldPop project aims to meet these needs through the provision of detailed and open access population … demography population worldpop -
YCEO Surface Urban Heat Islands: Pixel-Level Composites of Yearly Summertime Daytime and Nighttime Intensity

This dataset contains annual, summertime, and wintertime surface urban heat island (SUHI) intensities for day and night for over 10,000 urban clusters throughout the world. The dataset was created using the MODIS 8-day TERRA and AQUA land surface temperature (LST) products, the Landscan urban extent … climate uhi urban yale -
YCEO Surface Urban Heat Islands: Spatially-Averaged Daytime and Nighttime Intensity for Annual, Summer, and Winter

This dataset contains annual, summertime, and wintertime surface urban heat island (SUHI) intensities for day and night for over 10,000 urban clusters throughout the world. The dataset was created using the MODIS 8-day TERRA and AQUA land surface temperature (LST) products, the Landscan urban extent … climate uhi urban yale -
YCEO Surface Urban Heat Islands: Spatially-Averaged Monthly Composites of Daytime and Nighttime Intensity

This dataset contains annual, summertime, and wintertime surface urban heat island (SUHI) intensities for day and night for over 10,000 urban clusters throughout the world. The dataset was created using the MODIS 8-day TERRA and AQUA land surface temperature (LST) products, the Landscan urban extent … climate uhi urban yale -
YCEO Surface Urban Heat Islands: Spatially-Averaged Yearly Composites of Annual Daytime and Nighttime Intensity
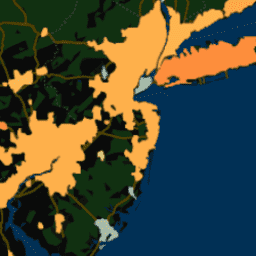
This dataset contains annual, summertime, and wintertime surface urban heat island (SUHI) intensities for day and night for over 10,000 urban clusters throughout the world. The dataset was created using the MODIS 8-day TERRA and AQUA land surface temperature (LST) products, the Landscan urban extent … climate uhi urban yale -
YCEO Surface Urban Heat Islands: Pixel-Level Annual Daytime and Nighttime Intensity

This dataset contains annual, summertime, and wintertime surface urban heat island (SUHI) intensities for day and night for over 10,000 urban clusters throughout the world. The dataset was created using the MODIS 8-day TERRA and AQUA land surface temperature (LST) products, the Landscan urban extent … climate uhi urban yale -
YCEO Surface Urban Heat Islands: Pixel-Level Yearly Composites of Wintertime Daytime and Nighttime Intensity
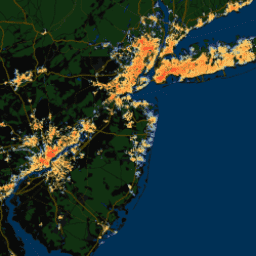
This dataset contains annual, summertime, and wintertime surface urban heat island (SUHI) intensities for day and night for over 10,000 urban clusters throughout the world. The dataset was created using the MODIS 8-day TERRA and AQUA land surface temperature (LST) products, the Landscan urban extent … climate uhi urban yale -
National Intertidal Digital Elevation Model 25m 1.0.0

The National Intertidal Digital Elevation Model (NIDEM; Bishop-Taylor et al. 2018, 2019) is a continental-scale elevation dataset for Australia's exposed intertidal zone. NIDEM provides the first three-dimensional representation of Australia's intertidal sandy beaches and shores, tidal flats and rocky shores and reefs at 25 m … australia dem ga geoscience-aus-cat landsat-derived publisher-dataset -
DEA Geometric Median and Median Absolute Deviation - Landsat 5 3.1.0
This product provides statistical tools to exploit the time series of Landsat 5 data available in Digital Earth Australia, providing annual images of general conditions and how much an area changes for a given year. The geomedian part of the product provides an "average" cloud-free … australia ga geoscience-aus-cat landsat-derived publisher-dataset -
DEA Geometric Median and Median Absolute Deviation - Landsat 7 3.1.0
This product provides statistical tools to exploit the time series of Landsat 7 data available in Digital Earth Australia, providing annual images of general conditions and how much an area changes for a given year. The geomedian part of the product provides an "average" cloud-free … australia ga geoscience-aus-cat landsat-derived publisher-dataset -
DEA Geometric Median and Median Absolute Deviation - Landsat 8 3.1.0
This product provides statistical tools to exploit the time series of Landsat 8 data available in Digital Earth Australia, providing annual images of general conditions and how much an area changes for a given year. The geomedian part of the product provides an "average" cloud-free … australia ga geoscience-aus-cat landsat-derived publisher-dataset -
DEA Land Cover 1.0.0
Digital Earth Australia (DEA) Land Cover provides annual land cover classifications for Australia using the Food and Agriculture Organisation Land Cover Classification System taxonomy Version 2 (Di Gregorio and Jansen, 1998; 2005). DEA Land Cover translates over 30 years of satellite imagery into evidence of … australia ga geoscience-aus-cat landcover landsat-derived publisher-dataset -
DEA Water Observations Statistics 3.1.6

Digital Earth Australia (DEA) Water Observations uses an algorithm to classify each pixel from Landsat satellite imagery as 'wet', 'dry', or 'invalid'. Water Observations Statistics provides information on how many times each year the Landsat satellites were able to clearly see an area, how many … australia ga geoscience-aus-cat landsat-derived publisher-dataset water -
Preview National Intertidal Digital Elevation Model 25m 1.0.0
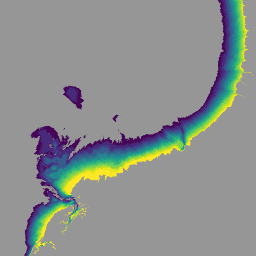
The National Intertidal Digital Elevation Model (NIDEM; Bishop-Taylor et al. 2018, 2019) is a continental-scale elevation dataset for Australia's exposed intertidal zone. NIDEM provides the first three-dimensional representation of Australia's intertidal sandy beaches and shores, tidal flats and rocky shores and reefs at 25 m … australia dem ga -
NICFI Satellite Data Program Basemaps for Tropical Forest Monitoring - Africa
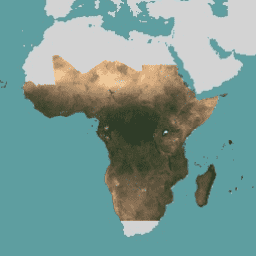
This image collection provides access to high-resolution satellite monitoring of the tropics for the primary purpose of reducing and reversing the loss of tropical forests, contributing to combating climate change, conserving biodiversity, contributing to forest regrowth, restoration and enhancement, and facilitating sustainable development, all of … basemaps forest nicfi planet planet-nicfi publisher-dataset -
NICFI Satellite Data Program Basemaps for Tropical Forest Monitoring - Americas
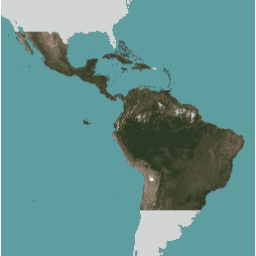
This image collection provides access to high-resolution satellite monitoring of the tropics for the primary purpose of reducing and reversing the loss of tropical forests, contributing to combating climate change, conserving biodiversity, contributing to forest regrowth, restoration and enhancement, and facilitating sustainable development, all of … basemaps forest nicfi planet planet-nicfi publisher-dataset -
NICFI Satellite Data Program Basemaps for Tropical Forest Monitoring - Asia
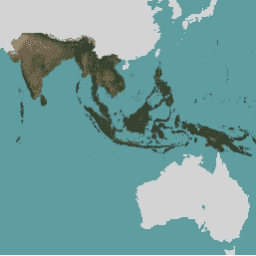
This image collection provides access to high-resolution satellite monitoring of the tropics for the primary purpose of reducing and reversing the loss of tropical forests, contributing to combating climate change, conserving biodiversity, contributing to forest regrowth, restoration and enhancement, and facilitating sustainable development, all of … basemaps forest nicfi planet planet-nicfi publisher-dataset -
GLOBathy Global lakes bathymetry dataset
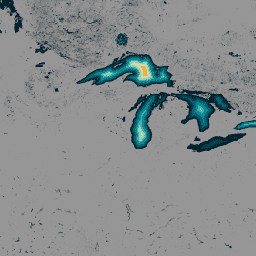
The GLObal Bathymetric (GLOBathy) dataset, comprising data on over 1.4 million waterbodies globally, has been meticulously developed to harmonize with the widely recognized HydroLAKES dataset. Utilizing a sophisticated Geographic Information System (GIS)-based framework, GLOBathy constructs detailed bathymetric maps by integrating maximum depth estimates and geometric/geophysical … community-dataset hydrology sat-io -
LandScan Population Data Global 1km
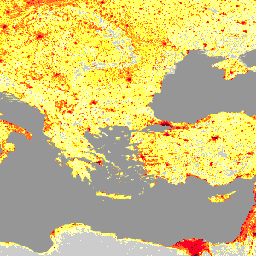
The LandScan dataset, provided by the Oak Ridge National Laboratory (ORNL), offers a comprehensive and high-resolution global population distribution dataset that serves as a valuable resource for a wide range of applications. Leveraging state-of-the-art spatial modeling techniques and advanced geospatial data sources, LandScan provides detailed … community-dataset demography landscan population sat-io -
United States Drought Monitor
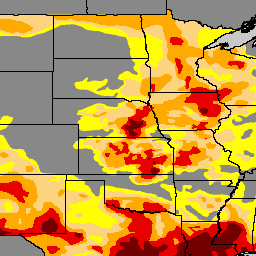
The U.S. Drought Monitor is a map released every Thursday, showing parts of the U.S. that are in drought. The map uses five classifications: abnormally dry (D0), showing areas that may be going into or are coming out of drought, and four levels of drought: … community-dataset drought noaa sat-io usda