

설명
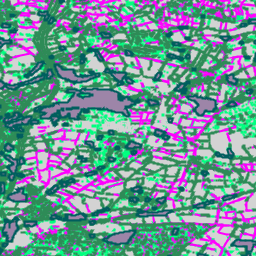
Farmscapes 2020 래스터 데이터 세트의 벡터화된 버전입니다. 영국의 농업 지형에서 미세한 반자연적 지형 (특히 생울타리, 삼림 지대, 돌담)을 나타내는 다각형 지오메트리를 제공합니다. 이 데이터 세트는 옥스포드 레버훌름 자연 회복 센터와 협력하여 개발되었으며, 지형 복원, 생물 다양성 모니터링, 생태적 연결성 분석을 비롯한 애플리케이션의 기준선 역할을 합니다.
고해상도 (25cm) Farmscapes 2020 확률 지도를 벡터화하여 파생되었으며, '생울타리 간격' 지형을 제외하도록 필터링되고 지형 분류 속성만 유지하도록 단순화되었습니다.
제한사항
- 지리적 범위: 주로 농촌 지형에 중점을 둔 학습 데이터에서 과소 대표된 밀집된 도시 환경과 산악 지역에서는 모델 성능이 저하됩니다.
- 시간 정확성: 소스 이미지는 2018년에서 2020년 사이에 캡처되었습니다. 따라서 데이터 세트는 이 기간 이후에 발생한 지형 변화를 고려하지 않습니다.
- 클래스별 성능: 돌담 클래스는 삼림 지대 및 생울타리에 비해 정확도가 낮습니다. 이는 학습 데이터의 상당한 클래스 불균형으로 인한 결과입니다.
테이블 스키마
테이블 스키마
| 이름 | 유형 | 설명 |
|---|---|---|
| feature_name | STRING | 지형 유형: '생울타리', '작은 숲', '선형 삼림 지대', '돌담' 또는 '삼림 지대' |
이용약관
이용약관
이 데이터 세트는 CC-BY 4.0에 따라 라이선스가 부여되며 '이 데이터 세트는 Google에서 제작했습니다'라는 저작자 표시가 필요합니다.
인용
인용:
Michelangelo Conserva, Alex Wilson, Charlotte Stanton, Vishal Batchu, Varun Gulshan , 'Mapping Farmed Landscapes from Remote Sensing'(검토 중). doi:10.48550/arXiv.2506.13993,
Earth Engine으로 탐색
코드 편집기(JavaScript)
var fc = ee.FeatureCollection('projects/nature-trace/assets/farmscapes/england_v1_0_vectorised');

var styles = {
  'hedgerow': {color: 'FF00FF', fillColor: '40FF00FF'},
  'copse': {color: '00FF7F', fillColor: '4000FF7F'},
  'linear_woodland': {color: '2E8B57', fillColor: '402E8B57'},
  'stone wall': {color: 'D3D3D3', fillColor: '40D3D3D3'},
  'woodland': {color: '005e5e', fillColor: '40005e5e'},
};

var styleDict = ee.Dictionary(styles);

var styledFc = fc.map(function(f) {
  var featureStyle = ee.Dictionary(styleDict.get(f.get('feature_name')));
  return f.set('style', featureStyle);
});

var styledImage = styledFc.style({
  styleProperty: 'style', width: 2
});

Map.addLayer(styledImage, {}, 'Farmscapes Vectors');

var legend = ui.Panel({
  style: {
    position: 'top-left',
    padding: '8px 15px',
    backgroundColor: 'rgba(255, 255, 255, 0.9)',
    border: '1px solid black'
  }
});

legend.add(ui.Label({
  value: 'Farmscapes Vectors',
  style: {fontWeight: 'bold', fontSize: '16px', margin: '0 0 4px 0', padding: '0'}
}));

var palette = [
  {color: 'FF00FF', name: 'Hedgerow'},
  {color: '00FF7F', name: 'Copse'},
  {color: '2E8B57', name: 'Linear Woodland'},
  {color: 'D3D3D3', name: 'Stone Wall'},
  {color: '005e5e', name: 'Woodland'},
];

palette.forEach(function(item) {
  var colorBox = ui.Label({
    style: {backgroundColor: '#' + item.color, padding: '8px', margin: '0 0 4px 0'}
  });
  var desc = ui.Label({value: item.name, style: {margin: '0 0 4px 6px'}});
  legend.add(ui.Panel({
    widgets: [colorBox, desc],
    layout: ui.Panel.Layout.Flow('horizontal')
  }));
});

Map.add(legend);

var lon = -1.43;
var lat = 52.973;
Map.setCenter(lon, lat, 15);
FeatureView로 시각화
FeatureView는
FeatureCollection의 보기 전용 가속화된 표현입니다. 자세한 내용은
FeatureView 문서를 참고하세요.
코드 편집기 (JavaScript)
var fv = ui.Map.FeatureViewLayer(
    'projects/nature-trace/assets/farmscapes/england_v1_0_vectorised_FeatureView');

fv.setVisParams({
  lineWidth: 2,
  color: '808080',
  polygonFillOpacity: 0.25,
  rules: [
    {
      filter: ee.Filter.eq('feature_name', 'hedgerow'),
      color: 'FF00FF',
      polygonFillColor: 'FF00FF'
    },
    {
      filter: ee.Filter.eq('feature_name', 'copse'),
      color: '00FF7F',
      polygonFillColor: '00FF7F'
    },
    {
      filter: ee.Filter.eq('feature_name', 'linear_woodland'),
      color: '2E8B57',
      polygonFillColor: '2E8B57'
    },
    {
      filter: ee.Filter.eq('feature_name', 'stone wall'),
      color: 'D3D3D3',
      polygonFillColor: 'D3D3D3'
    },
    {
      filter: ee.Filter.eq('feature_name', 'woodland'),
      color: '005e5e',
      polygonFillColor: '005e5e'
    }
  ]
});
fv.setName('Farmscapes Vectors');
Map.add(fv);

var legend = ui.Panel({
  style: {
    position: 'top-left',
    padding: '8px 15px',
    backgroundColor: 'rgba(255, 255, 255, 0.9)',
    border: '1px solid black'
  }
});
legend.add(ui.Label({
  value: 'Farmscapes Vectors',
  style:
      {fontWeight: 'bold', fontSize: '16px', margin: '0 0 4px 0', padding: '0'}
}));

var palette = [
  {color: 'FF00FF', name: 'Hedgerow'}, {color: '00FF7F', name: 'Copse'},
  {color: '2E8B57', name: 'Linear Woodland'},
  {color: 'D3D3D3', name: 'Stone Wall'}, {color: '005e5e', name: 'Woodland'},
];

palette.forEach(function(item) {
  var colorBox = ui.Label({
    style:
        {backgroundColor: '#' + item.color, padding: '8px', margin: '0 0 4px 0'}
  });
  var desc = ui.Label({value: item.name, style: {margin: '0 0 4px 6px'}});
  legend.add(ui.Panel(
      {widgets: [colorBox, desc], layout: ui.Panel.Layout.Flow('horizontal')}));
});

Map.add(legend);

var lon = -1.43;
var lat = 52.973;
Map.setCenter(lon, lat, 15);