- Dataset Availability
- 2020-01-01T00:00:00Z–2020-01-02T00:00:00Z
- Dataset Provider
- United States Census Bureau
- Earth Engine Snippet
-
FeatureCollection
ee.FeatureCollection("TIGER/2020/TABBLOCK20") -
FeatureView
ui.Map.FeatureViewLayer("TIGER/2020/TABBLOCK20_FeatureView") - Tags
Description
The United States Census Bureau regularly releases a geodatabase named TIGER. This dataset contains the 2020 census blocks, roughly equivalent to a city block. There are just over eight million polygon features covering the United States, the District of Columbia, Puerto Rico, and the Island areas.
For full technical details on all TIGER 2020 products, see the TIGER technical documentation.
Table Schema
Table Schema
| Name | Type | Description |
|---|---|---|
| ALAND20 | DOUBLE | 2020 Census land area |
| AWATER20 | DOUBLE | 2020 Census water area |
| BLOCKCE20 | STRING | 2020 Census tabulation block number |
| COUNTYFP20 | STRING | 2020 Census county FIPS code |
| FUNCSTAT20 | STRING | 2020 Census functional status |
| GEOID20 | STRING | Census block identifier: a concatenation of 2020 Census state FIPS code, 2020 Census county FIPS code, 2020 Census tract code, and 2020 Census block number |
| INTPTLAT20 | STRING | 2020 Census latitude of the internal point |
| INTPTLON20 | STRING | 2020 Census longitude of the internal point |
| MTFCC20 | STRING | MAF/TIGER feature class code |
| NAME20 | STRING | 2020 Census tabulation block name: a concatenation of Block and the tabulation block number |
| STATEFP20 | STRING | 2020 Census state FIPS code |
| TRACTCE20 | STRING | 2020 Census tract code |
| UACE20 | STRING | 2020 Census urban area code |
| UATYPE20 | STRING | 2020 Census urban area type |
| UR20 | STRING | 2020 Census urban/rural indicator |
Terms of Use
Terms of Use
The U.S. Census Bureau offers some of its public data in machine-readable format via an Application Programming Interface (API). All of the content, documentation, code and related materials made available to you through the API are subject to these terms and conditions.
Citations
For the creation of any reports, publications, new data sets, derived products, or services resulting from the data set, users should cite the US Census Bureau.
Explore with Earth Engine
Code Editor (JavaScript)
var dataset = ee.FeatureCollection('TIGER/2020/TABBLOCK20');
var visParams = {
min: 0.0,
max: 1e7,
palette: ['d8d9d9', 'aaaaaa', 'b6dfe9', '2ea3f2', '0c71c3']
};
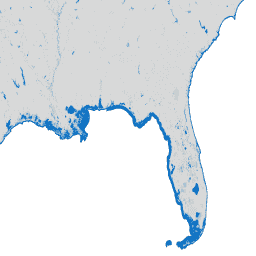
// plotting the water area per polygon
dataset = dataset.map(function (f) {
return f.set('AWATER20', ee.Number.parse(f.get('AWATER20')));
});
var image = ee.Image().float().paint(dataset, 'AWATER20');
Map.setCenter(-73.15, 40.9, 9);
Map.addLayer(ee.Image(1), {min:0, max:1}, 'background');
Map.addLayer(image, visParams, 'TIGER/2020/TABBLOCK20');
Map.addLayer(dataset, null, 'for Inspector', false);
Visualize as a FeatureView
A FeatureView is a view-only, accelerated representation of a
FeatureCollection. For more details, visit the
FeatureView documentation.
Code Editor (JavaScript)
var fvLayer = ui.Map.FeatureViewLayer('TIGER/2020/TABBLOCK20_FeatureView');

var visParams = {
  opacity: 1,
  color: {
    property: 'AWATER20',
    mode: 'linear',
    palette: ['d8d9d9', 'aaaaaa', 'b6dfe9', '2ea3f2', '0c71c3'],
    min: 0,
    max: 1e7
  }
};

fvLayer.setVisParams(visParams);
fvLayer.setName('Water area by US census block');

Map.setCenter(-73.15, 40.9, 9);
Map.add(fvLayer);