Dataset Availability
: 2001-01-01T00:00:00Z--2017-01-01T00:00:00Z
Dataset Producer
:
[iSDA](https://isda-africa.com/)
Tags
:
[africa](https://developers.google.com/earth-engine/datasets/tags/africa) [isda](https://developers.google.com/earth-engine/datasets/tags/isda) [sand](https://developers.google.com/earth-engine/datasets/tags/sand) [soil](https://developers.google.com/earth-engine/datasets/tags/soil)
#### Description
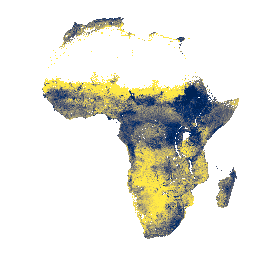
Sand content at soil depths of 0-20 cm and 20-50 cm,\\npredicted mean and standard deviation.
In areas of dense jungle (generally over central Africa), model accuracy is
low and therefore artifacts such as banding (striping) might be seen.
Soil property predictions were made by
[Innovative Solutions for Decision Agriculture Ltd. (iSDA)](https://isda-africa.com/)
at 30 m pixel size using machine learning coupled with remote sensing data
and a training set of over 100,000 analyzed soil samples.
Further information can be found in the
[FAQ](https://www.isda-africa.com/isdasoil/faq/) and
[technical information documentation](https://www.isda-africa.com/isdasoil/technical-information/). To submit an issue or request support, please visit
[the iSDAsoil site](https://isda-africa.com/isdasoil).
### Bands
**Bands**
Pixel size: 30 meters (all bands)
| Name | Units | Min | Max | Pixel Size | Description |
|---|---|---|---|---|---|
| `mean_0_20` | % | 2 | 94 | 30 meters | Sand content, predicted mean at 0-20 cm depth |
| `mean_20_50` | % | 2 | 95 | 30 meters | Sand content, predicted mean at 20-50 cm depth |
| `stdev_0_20` | % | 0 | 144 | 30 meters | Sand content, standard deviation at 0-20 cm depth |
| `stdev_20_50` | % | 0 | 143 | 30 meters | Sand content, standard deviation at 20-50 cm depth |
### Terms of Use
**Terms of Use**
[CC-BY-4.0](https://spdx.org/licenses/CC-BY-4.0.html)
### Citations
Citations:
- Hengl, T., Miller, M.A.E., Križan, J., et al. African soil properties and nutrients
mapped at 30 m spatial resolution using two-scale ensemble machine learning.
Sci Rep 11, 6130 (2021).
[doi:10.1038/s41598-021-85639-y](https://doi.org/10.1038/s41598-021-85639-y)
### Explore with Earth Engine
> [!NOTE]
> **Important:** Earth Engine is a platform for petabyte-scale scientific analysis and visualization of geospatial datasets, both for public benefit and for business and government users. Earth Engine is free to use for research, education, and nonprofit use. To get started, please [register for Earth Engine access.](https://console.cloud.google.com/earth-engine)
### Code Editor (JavaScript)
```javascript
var mean_0_20 =
'' +
'' +
'' +
'' +
'' +
'' +
'' +
'' +
'' +
'' +
'' +
'' +
'' +
'' +
'' +
'' +
'' +
'' +
'' +
'';
var mean_20_50 =
'' +
'' +
'' +
'' +
'' +
'' +
'' +
'' +
'' +
'' +
'' +
'' +
'' +
'' +
'' +
'' +
'' +
'' +
'' +
'';
var stdev_0_20 =
'' +
'' +
'' +
'' +
'' +
'' +
'' +
'' +
'' +
'';
var stdev_20_50 =
'' +
'' +
'' +
'' +
'' +
'' +
'' +
'' +
'' +
'';
var raw = ee.Image("ISDASOIL/Africa/v1/sand_content");
Map.addLayer(
raw.select(0).sldStyle(mean_0_20), {},
"Sand content, mean visualization, 0-20 cm");
Map.addLayer(
raw.select(1).sldStyle(mean_20_50), {},
"Sand content, mean visualization, 20-50 cm");
Map.addLayer(
raw.select(2).sldStyle(stdev_0_20), {},
"Sand content, stdev visualization, 0-20 cm");
Map.addLayer(
raw.select(3).sldStyle(stdev_20_50), {},
"Sand content, stdev visualization, 20-50 cm");
var converted = raw.divide(10).exp().subtract(1);
var visualization = {min: 0, max: 3000};
Map.setCenter(25, -3, 2);
Map.addLayer(converted.select(0), visualization, "Sand content, mean, 0-20 cm");
```
[Open in Code Editor](https://code.earthengine.google.com/?scriptPath=Examples:Datasets/ISDASOIL/ISDASOIL_Africa_v1_sand_content) [iSDAsoil Sand Content](https://developers.google.com/earth-engine/datasets/catalog/ISDASOIL_Africa_v1_sand_content) Sand content at soil depths of 0-20 cm and 20-50 cm,\\npredicted mean and standard deviation. In areas of dense jungle (generally over central Africa), model accuracy is low and therefore artifacts such as banding (striping) might be seen. Soil property predictions were made by Innovative Solutions for Decision Agriculture Ltd. ... ISDASOIL/Africa/v1/sand_content, africa,isda,sand,soil 2001-01-01T00:00:00Z/2017-01-01T00:00:00Z -35.22 -31.46 37.98 57.08 Google Earth Engine https://developers.google.com/earth-engine/datasets
- [](https://doi.org/https://isda-africa.com/)
- [](https://doi.org/https://developers.google.com/earth-engine/datasets/catalog/ISDASOIL_Africa_v1_sand_content)