- Dataset Availability
- 1979-01-02T00:00:00Z–2020-07-09T00:00:00Z
- Dataset Provider
- ECMWF / Copernicus Climate Change Service
- Earth Engine Snippet
-
ee.ImageCollection("ECMWF/ERA5/DAILY") - Tags
Description
NOTE (2024-03-15): Due to modernization work impacting the Copernicus Climate Data Store, production of ECMWF datasets will be significantly disrupted. The provider did not specify a planned completion date, so for more details, see the user forum.
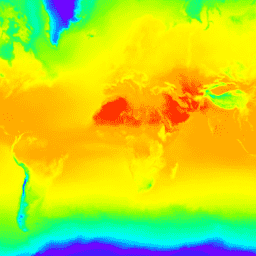
ERA5 is the fifth generation ECMWF atmospheric reanalysis of the global climate. Reanalysis combines model data with observations from across the world into a globally complete and consistent dataset. ERA5 replaces its predecessor, the ERA-Interim reanalysis.
ERA5 DAILY provides aggregated values for each day for seven ERA5 climate reanalysis parameters: 2m air temperature, 2m dewpoint temperature, total precipitation, mean sea level pressure, surface pressure, 10m u-component of wind and 10m v-component of wind. Additionally, daily minimum and maximum air temperature at 2m has been calculated based on the hourly 2m air temperature data. Daily total precipitation values are given as daily sums. All other parameters are provided as daily averages.
ERA5 data is available from 1979 to three months from real-time. More information and more ERA5 atmospheric parameters can be found at the Copernicus Climate Data Store.
Provider's Note: Daily aggregates have been calculated based on the ERA5 hourly values of each parameter.
Bands
Resolution
27830 meters
Bands
| Name | Units | Min | Max | Description |
|---|---|---|---|---|
mean_2m_air_temperature |
K | 223.6* | 304* | Average air temperature at 2m height (daily average) |
minimum_2m_air_temperature |
K | 220.7* | 300.8* | Minimum air temperature at 2m height (daily minimum) |
maximum_2m_air_temperature |
K | 225.8* | 310.2* | Maximum air temperature at 2m height (daily maximum) |
dewpoint_2m_temperature |
K | 219.3* | 297.8* | Dewpoint temperature at 2m height (daily average) |
total_precipitation |
m | 0* | 0.02* | Total precipitation (daily sums) |
surface_pressure |
Pa | 65639* | 102595* | Surface pressure (daily average) |
mean_sea_level_pressure |
Pa | 97657.4* | 103861* | Mean sea level pressure (daily average) |
u_component_of_wind_10m |
m/s | -11.4* | 11.4* | 10m u-component of wind (daily average) |
v_component_of_wind_10m |
m/s | -10.1* | 10.1* | 10m v-component of wind (daily average) |
Image Properties
Image Properties
| Name | Type | Description |
|---|---|---|
| month | INT | Month of the data |
| year | INT | Year of the data |
| day | INT | Day of the data |
Terms of Use
Terms of Use
Please acknowledge the use of ERA5 as stated in the Copernicus C3S/CAMS License agreement:
- 5.1.1 Where the Licensee communicates or distributes Copernicus Products to the public, the Licensee shall inform the recipients of the source by using the following or any similar notice: "Generated using Copernicus Climate Change Service information (Year)".
- 5.1.2 Where the Licensee makes or contributes to a publication or distribution containing adapted or modified Copernicus Products, the Licensee shall provide the following or any similar notice: "Contains modified Copernicus Climate Change Service information (Year)".
- 5.1.3 Any such publication or distribution covered by clauses 5.1.1 and 5.1.2 shall state that neither the European Commission nor ECMWF is responsible for any use that may be made of the Copernicus information or Data it contains.
Citations
Copernicus Climate Change Service (C3S) (2017): ERA5: Fifth generation of ECMWF atmospheric reanalyses of the global climate. Copernicus Climate Change Service Climate Data Store (CDS), (date of access), https://cds.climate.copernicus.eu/cdsapp#!/home
Explore with Earth Engine
Code Editor (JavaScript)
// Example script to load and visualize ERA5 climate reanalysis parameters in
// Google Earth Engine

// Daily mean 2m air temperature
var era5_2mt = ee.ImageCollection('ECMWF/ERA5/DAILY')
                   .select('mean_2m_air_temperature')
                   .filter(ee.Filter.date('2019-07-01', '2019-07-31'));
print(era5_2mt);

// Daily total precipitation sums
var era5_tp = ee.ImageCollection('ECMWF/ERA5/DAILY')
                  .select('total_precipitation')
                  .filter(ee.Filter.date('2019-07-01', '2019-07-31'));

// Daily mean 2m dewpoint temperature
var era5_2d = ee.ImageCollection('ECMWF/ERA5/DAILY')
                  .select('dewpoint_2m_temperature')
                  .filter(ee.Filter.date('2019-07-01', '2019-07-31'));

// Daily mean sea-level pressure
var era5_mslp = ee.ImageCollection('ECMWF/ERA5/DAILY')
                    .select('mean_sea_level_pressure')
                    .filter(ee.Filter.date('2019-07-01', '2019-07-31'));

// Daily mean surface pressure
var era5_sp = ee.ImageCollection('ECMWF/ERA5/DAILY')
                  .select('surface_pressure')
                  .filter(ee.Filter.date('2019-07-01', '2019-07-31'));

// Daily mean 10m u-component of wind
var era5_u_wind_10m = ee.ImageCollection('ECMWF/ERA5/DAILY')
                          .select('u_component_of_wind_10m')
                          .filter(ee.Filter.date('2019-07-01', '2019-07-31'));

// Convert pressure levels from Pa to hPa - Example for surface pressure
var era5_sp = era5_sp.map(function(image) {
  return image.divide(100).set(
      'system:time_start', image.get('system:time_start'));
});

// Visualization palette for total precipitation
var visTp = {
  min: 0.0,
  max: 0.1,
  palette: ['ffffff', '00ffff', '0080ff', 'da00ff', 'ffa400', 'ff0000']
};

// Visualization palette for temperature (mean, min and max) and 2m dewpoint
// temperature
var vis2mt = {
  min: 250,
  max: 320,
  palette: [
    '000080', '0000d9', '4000ff', '8000ff', '0080ff', '00ffff', '00ff80',
    '80ff00', 'daff00', 'ffff00', 'fff500', 'ffda00', 'ffb000', 'ffa400',
    'ff4f00', 'ff2500', 'ff0a00', 'ff00ff'
  ]
};

// Visualization palette for u- and v-component of 10m wind
var visWind = {
  min: 0,
  max: 30,
  palette: [
    'ffffff', 'ffff71', 'deff00', '9eff00', '77b038', '007e55', '005f51',
    '004b51', '013a7b', '023aad'
  ]
};

// Visualization palette for pressure (surface pressure, mean sea level
// pressure) - adjust min and max values for mslp to min:990 and max:1050
var visPressure = {
  min: 500,
  max: 1150,
  palette: [
    '01ffff', '058bff', '0600ff', 'df00ff', 'ff00ff', 'ff8c00', 'ff8c00'
  ]
};


// Add layer to map
Map.addLayer(
    era5_tp.filter(ee.Filter.date('2019-07-15')), visTp,
    'Daily total precipitation sums');
Map.addLayer(
    era5_2d.filter(ee.Filter.date('2019-07-15')), vis2mt,
    'Daily mean 2m dewpoint temperature');
Map.addLayer(
    era5_2mt.filter(ee.Filter.date('2019-07-15')), vis2mt,
    'Daily mean 2m air temperature');
Map.addLayer(
    era5_u_wind_10m.filter(ee.Filter.date('2019-07-15')), visWind,
    'Daily mean 10m u-component of wind');
Map.addLayer(
    era5_sp.filter(ee.Filter.date('2019-07-15')), visPressure,
    'Daily mean surface pressure');

Map.setCenter(21.2, 22.2, 2);
import ee
import geemap.core as geemap
Colab (Python)
# Example script to load and visualize ERA5 climate reanalysis parameters in
# Google Earth Engine

# Daily mean 2m air temperature
era5_2mt = (
    ee.ImageCollection('ECMWF/ERA5/DAILY')
    .select('mean_2m_air_temperature')
    .filter(ee.Filter.date('2019-07-01', '2019-07-31'))
)
display(era5_2mt)

# Daily total precipitation sums
era5_tp = (
    ee.ImageCollection('ECMWF/ERA5/DAILY')
    .select('total_precipitation')
    .filter(ee.Filter.date('2019-07-01', '2019-07-31'))
)

# Daily mean 2m dewpoint temperature
era5_2d = (
    ee.ImageCollection('ECMWF/ERA5/DAILY')
    .select('dewpoint_2m_temperature')
    .filter(ee.Filter.date('2019-07-01', '2019-07-31'))
)

# Daily mean sea-level pressure
era5_mslp = (
    ee.ImageCollection('ECMWF/ERA5/DAILY')
    .select('mean_sea_level_pressure')
    .filter(ee.Filter.date('2019-07-01', '2019-07-31'))
)

# Daily mean surface pressure
era5_sp = (
    ee.ImageCollection('ECMWF/ERA5/DAILY')
    .select('surface_pressure')
    .filter(ee.Filter.date('2019-07-01', '2019-07-31'))
)

# Daily mean 10m u-component of wind
era5_u_wind_10m = (
    ee.ImageCollection('ECMWF/ERA5/DAILY')
    .select('u_component_of_wind_10m')
    .filter(ee.Filter.date('2019-07-01', '2019-07-31'))
)

# Convert pressure levels from Pa to hPa - Example for surface pressure
era5_sp = era5_sp.map(
    lambda image: image.divide(100).set(
        'system:time_start', image.get('system:time_start')
    )
)

# Visualization palette for total precipitation
vis_tp = {
    'min': 0.0,
    'max': 0.1,
    'palette': ['ffffff', '00ffff', '0080ff', 'da00ff', 'ffa400', 'ff0000'],
}

# Visualization palette for temperature (mean, min and max) and 2m dewpoint
# temperature
vis_2mt = {
    'min': 250,
    'max': 320,
    'palette': [
        '000080',
        '0000d9',
        '4000ff',
        '8000ff',
        '0080ff',
        '00ffff',
        '00ff80',
        '80ff00',
        'daff00',
        'ffff00',
        'fff500',
        'ffda00',
        'ffb000',
        'ffa400',
        'ff4f00',
        'ff2500',
        'ff0a00',
        'ff00ff',
    ],
}

# Visualization palette for u- and v-component of 10m wind
vis_wind = {
    'min': 0,
    'max': 30,
    'palette': [
        'ffffff',
        'ffff71',
        'deff00',
        '9eff00',
        '77b038',
        '007e55',
        '005f51',
        '004b51',
        '013a7b',
        '023aad',
    ],
}

# Visualization palette for pressure (surface pressure, mean sea level
# pressure) - adjust min and max values for mslp to 'min':990 and 'max':1050
vis_pressure = {
    'min': 500,
    'max': 1150,
    'palette': [
        '01ffff',
        '058bff',
        '0600ff',
        'df00ff',
        'ff00ff',
        'ff8c00',
        'ff8c00',
    ],
}


# Add layer to map
m = geemap.Map()
m.add_layer(
    era5_tp.filter(ee.Filter.date('2019-07-15')),
    vis_tp,
    'Daily total precipitation sums',
)
m.add_layer(
    era5_2d.filter(ee.Filter.date('2019-07-15')),
    vis_2mt,
    'Daily mean 2m dewpoint temperature',
)
m.add_layer(
    era5_2mt.filter(ee.Filter.date('2019-07-15')),
    vis_2mt,
    'Daily mean 2m air temperature',
)
m.add_layer(
    era5_u_wind_10m.filter(ee.Filter.date('2019-07-15')),
    vis_wind,
    'Daily mean 10m u-component of wind',
)
m.add_layer(
    era5_sp.filter(ee.Filter.date('2019-07-15')),
    vis_pressure,
    'Daily mean surface pressure',
)

m.set_center(21.2, 22.2, 2)
m