Andy Granowitz, Google Analytics Developer Advocate – September 2014
The goal of this article is to encourage the great statisticians, researchers, and data scientists currently using R to look to Google Analytics as a useful dataset, and likewise, to encourage Google Analytics users to utilize R for their serious data crunching needs. This article walks through an example that demonstrates how to measure the long-term value of marketing campaigns using Google Analytics data in R.
Introduction
R, the popular programming language for statistical computing, is a powerful tool for analyzing and drawing insights from data. When you combine R with your Google Analytics data, you can perform statistical analysis and generate data visualizations to better understand and improve your business.
The remainder of this article describes the steps required to generate some insightful data and graphs using the Google Analytics library with R.
Setup
The RGoogleAnalytics library allows you to retrieve Google Analytics data natively from R. To get started:
- Verify you have access to a Google Analytics account that contains data that can be used for analysis
- Install R
- Install the RGoogleAnalytics package
- Follow the example code on Github to ensure you can access Google Analytics data within R
For additional setup resources, visit the RGoogleAnalytics setup guide.
Question
What is the long-term value of my marketing campaigns?
Standard reports in Google Analytics can help you determine if marketing campaigns lead to conversions in the short-term, but it can be difficult to determine the long-term value of campaigns since this requires you to perform cumulative analysis.
Analysis
To determine the long-term value of marketing campaigns, you can use R to generate cumulative revenue and transaction graphs for given cohorts. This way, you will be able to see how many transactions a group of customers that were acquired from a given marketing campaign made over the course of a longer period of time. This is in contrast to a more standard analysis, where you might observe whether or not a customer that visited your property from a marketing campaign made a purchase right away.
The Query
To perform this analysis, the RGoogleAnalytics sample query can be modified. The following query below pulls transactions and revenue for all users who first visited the site from Campaign A between September 1 and September 7, 2014, and made a purchase at some point between September 1 and November 29.
query.list <- Init(start.date = "2014-09-01",
        end.date = "2014-11-29",
        dimensions = "ga:date",
        metrics = "ga:transactions,ga:transactionRevenue",
        segment = "users::sequence::^ga:userType==New%20Visitor;dateOfSession<>2014-09-01_2014-09-07;ga:campaign==Campaign%20A;->>perSession::ga:transactions>0",
        max.results = 10000,
        sort = "ga:date",
        table.id = tableId)
If the segment is omitted, this query extracts transactions and revenue for all users by date. Adding the segment only includes users who visited the site for the first time and made a transaction between the specified time periods.
Understanding the Segment
The segment consists of a few sequence conditions:
- The segment selects
users::in order to include not only the sessions that match the conditions, but all sessions among users who match the conditions. - The
sequence::prefix allows the selection of a set of users that completed a specified set of steps. In this case, the first step is to visit from a given campaign in a given set of time, and the second step is to make a purchase. - The
^prefix in front ofga:userType==New%20Visitor;dateOfSession<>2014-09-01_2014-09-07ensures that the Date of Session, Campaign, and User Type conditions are true for the first hit of the first session in the given date range. ->>perSession::ga:transactions>0specifies the second step of making a purchase at some point.
Refer to the Segments Developer Guide for more details on possible segments to create and syntax details if you wish to modify this segment or construct your own.
Working with the Results
The result of this query is transactions and revenue per day for the specified group of users.
The daily, or incremental transactions and revenue per day can be turned into cumulative numbers
in R using the cumsum function. This data can then be graphed using the
plot function or the ggplot2 package.
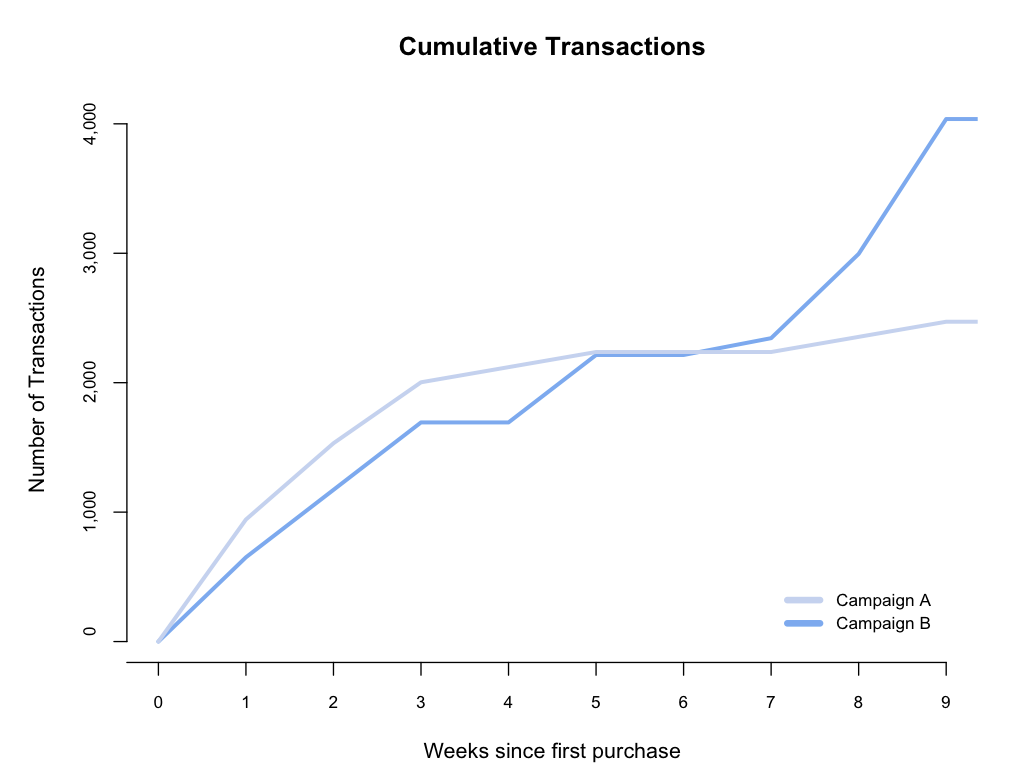
While an incremental transaction plot shows the number of transactions that occurred on each date, a cumulative transactions plot shows the number of total transactions that occurred up to and including each date. Therefore, the cumulative transactions plot allows us to see the longer-term value of each campaign:
Outcome
Analyzing these two campaigns, we see that although customers acquired from Campaign A completed more transactions than customers acquired from Campaign B for the first four weeks, in the long-term, customers from Campaign B completed more cumulative transactions. Looking only at transactions that occurred immediately following a visit from Campaign A or B would have led to the incorrect conclusion that Campaign A was more effective.

Hopefully this has whet your appetite for analyzing Google Analytics data in R. Visit the Google Analytics Reporting API forum to share some of the exciting analysis you're doing.
Video overview
The video below outlines the example in this article. Additionally, two other use cases for using R with Google Analytics are presented.